Hello everyone 🤗
I trust we all are doing well today.
I am so glad that the season 6 of the crypto academy has began and fortunately I am lucky to meet all the criteria for participation. 🥰
So today I will be giving answers to the lesson homework by my admirable professor @dilchamo,I have gone through the lesson and I must say it is exhaustive and enlightening.
so please Enjoy.
 designed in pixellab

 screenshot from trading view
In trading of cryptocurrency today,alot of technical analysis tool is utilise and the success a trader will make heavily and solely depends on the analysing tool utilise during trading process.
One of the major and most important tool used by trader to to trade is the chart.
The chart can either be candle stick chart,line chart or any other chart,but today we will be discussing the LINE CHART.
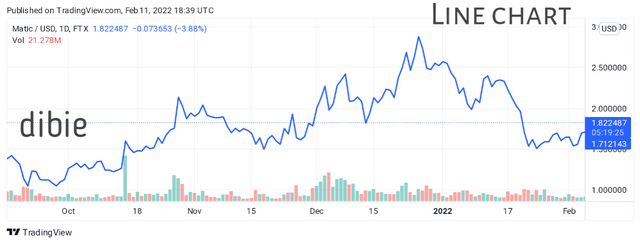
The Line chart can be said to be a graphical representation kind of chart that uses lines as the means of connecting and showing the closing price of an asset for each day.
It is a 2D chart which shows the closing price of an asset as a single input across different time frame or timeline.In other words,it is a price chart that represents price of an asset using only a single and continuous line.
The line chart is basically used by traders to get a clearer picture of price change over a higher time frame,it also reduces the volatility of price and filter noise from the chart.
USES OF LINE CHART
•The line chart is ideally used for analysing higher time frame in a situation where the trader only needs to see the price movement or direction and not other information or details.
• The line chart is used in tracking the changes in price of an asset over short and long period of time.
• It can also be use In striking balance and comparing the change in price of an asset for the same period of time but different group.
•It is also used in filtering noise from the chart as it only shows the closing price of an asset.
•it is used to generate a clearer picture of the support and resistance level of price on the chart which is no doubt the foundation of technical analysis in the crypto world.


Support and resistance level just like I mentioned above are the basics of technical analysis and a trader who want to make progress must understand them.
To identify these level in the line chart is not difficult ,we just need to understand what the support and resistance line means and where to find them.
•How to identify support level in line chart.
screenshot from trading view
A support level in a line chart is the level that prevent the further and continuous fall of price of an asset on the chart.
it is the regarded as the level where the buying power is maximum which inturn stop the continuous fall in price of asset.
It is usually located at the bottom or below the current market price or level.
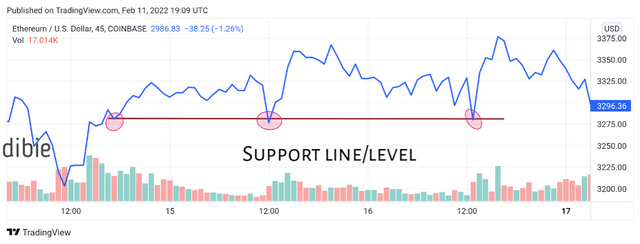
To identify this support level using line chart,a trendline is draw below the current market price or level which connects the recent lows below the market price.
For the support line to be considered valid the line must atlest touch about 3 swings point below the current market level or price.
You can see the illustration from the screenshot above.
•How to identify resistance level using line chart.
screenshot from trading view
The resistance level is a point or level in the line chart that prevent the continuous rise in price of an asset.
It is a level where the seller power is strong and the sellers are making sure to stop the further increase in price of an asset.
It is always located above or at the top of the current market price or level.
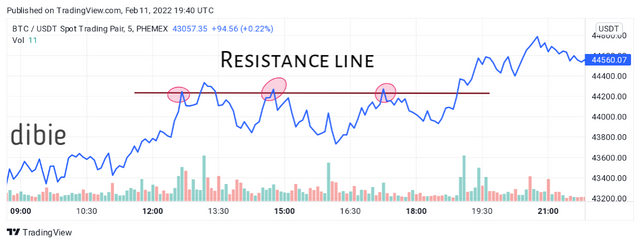
To identify the resistance line using line chart,a line is draw above the current market price connecting recent highs in the market.
For the resistance line to be considered valid in the line chart it must atleast touch about 3 swings point above the current market price just as seen in the screenshot above.


The line chart and candlestick chart are both important as far as price technical analysis is concern.
They sometimes can be used to carry out the same function but they are different.
In this part of the question,I will be distinguishing between a line chart and a candlestick chart.
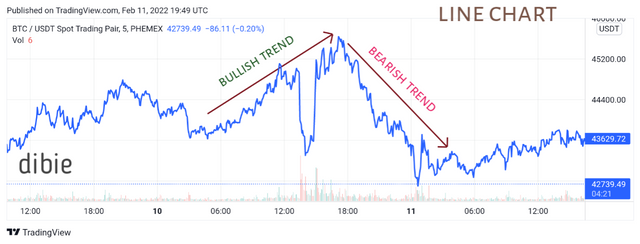
•LINE CHART
 screenshot from trading view
The line chart is a kind of chart that uses a single and continuous line in represent price movement and action In a chart.
Unlike the candlestick chart, it only displays the information regarding the closing price of an asset over a specific period of time which inturn helps to filter noise from the chart.
It is also suitable for for analysing higher time frame for price in situation where a trader only need information regarding price movement and direction and not other necessary information about the price.
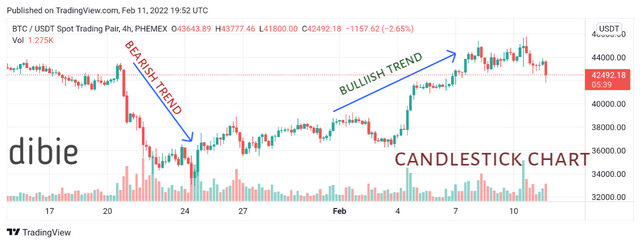
•CANDLESTICK CHART
 screenshot from trading view
The candlestick chart is another technical analysis tool that most traders have embraced globally.
It is a kind of chart that make use of candlestick for representation of price action and movement in the chart.
It provides all necessary information regard price such as the opening,closings,high,lows and price movement and direction.
And this makes it unique and different from the line chart.


In trading cryptocurrency,it is always advisable to make use of Indicators along side technical chart as it tends to give a clear picture of the price movement and also signals the possible outcome in price direction.
In this part of the question,I will will be listing atleast 2 other Indicators that can be used alongside the line chart.
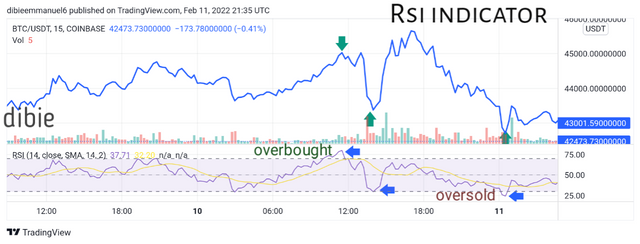
•RSI{Relative Strength Index}
I have always been a fan of the RSI Indicator and fortunately it can be used with the line chart.
screenshot from trading view
The RSI Indicator is used in measuring the rate/speed of recent price changes or price direction in the chart.
It is an oscillating Indicator that measures between Zero to 100 and a measurement below 70 is regarded as overbought while a measurement below 30 signals an oversold.
Using the RSI Indicator alongside line chart will increase the chances of understanding the chart better and making profit as it will help to generate signal for divergence and swing failure.
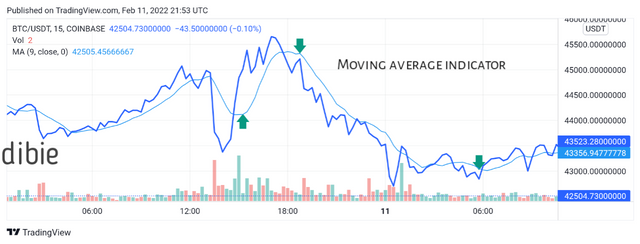
•MOVING AVERAGE
The moving average Indicator can also be used with the line chart because it is also one of the few Indicator best for trading swings.
 screenshot from trading view
Using this Indicator with line chart will help smoothening out the short term volatility that might want to confuse trader on the line chart whereby creating a clearer picture on the chart.


Before trading Bullish and bearish using line chart, it is only imperative that we understand what these two things means to a certain degree and then we can discuss how to spot their opportunity and trade them using the line chart.
Bullish trend in a line chart is the region or situation in which price continue to make higher high than the previous high which is as a result of increase in price of an asset while the bearish trend In the line chart is the continuous movement of price towards a downward trend due to decrease in price of an asset.
•Bullish Trading Opportunity Using Line Chart.
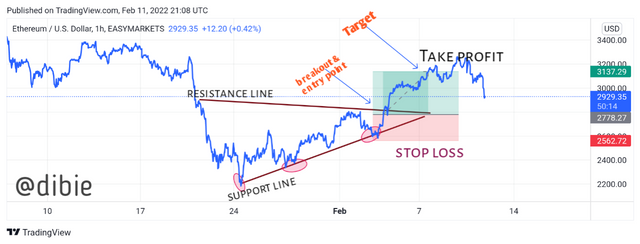
We can trade bullish opportunity using the line chart by making use of the ascending triangle pattern.
The ascending triangle is a bullish triangle pattern that indicates the uptrend in price movement of an asset and it can be used in trading on the line chart.
This can be done by making two sloppy lines above and below the market price whereby the line above the market price represent the resistance line and the line below represent the support line.
 screenshot from trading view
The point where this lines meet and breakout from the "resistance" line is the entry point and so a trader is expected to enter the market and place a long buy position as price is expected reverse into an uptrend or upward direction after the breakout just as seen in the screenshot above.
•Bearish Trading Opportunity Using Line Chart.
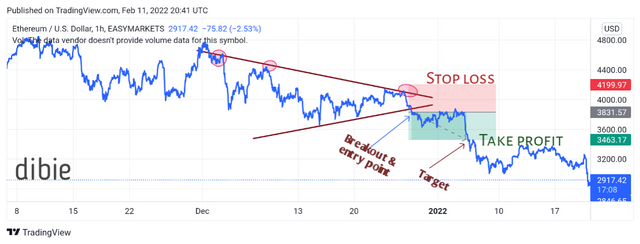
We can as well trade bearish opportunity using the line chart by making use of the decending triangle pattern.The descending triangle is a bearish triangle pattern that indicates a bearish or downward movement of price.
It can be used to trade bearish opportunity on the chart by drawing two slope line which indicate both the resistance and support line.
 screenshot from trading view
The point or region where both line meet and price breaks out from the "support line" is the entry point and so trader are expected to enter the market and place a short sell position as price is expected to start continuing or reversing in a downward trend just as seen in the screenshot above.


ADVANTAGES
• it filters out too much noise from the chart as it only shows the closing price of the asset on the chart.
• Traders can use it to track higher time frame when a trader is only interested in seeing the price movement of an asset and not other information regarding price.
•It provides a clearer view of the resistance and support level on chart.
•Because of it simplicity, beginners can make use of it and understand how to trade cryptocurrency better.
DISADVANTAGES
•Line chart only provide less information about price as it only shows the closing price for the day leaving other relevant information regarding price which might not be a welcome idea most times.
•it is harder to compare with other chart because we are unable to see Information
between or within the points.


The line chart is an important technical analysis tool that every trader should understand and make use of.it's simplicity make it very easy to use and beginners that are just getting into the cryptocurrency world can make use of it.
One unique thing about the line chart is that it helps to filter noise from the chart as it only show the closing price of an asset and it is suitable to tracking higher time frame of price direction of an asset.
Although this chart comes with lot of goodies and advantages,but we still can't shy away from the detrimental side of it.
In some situations,the uses of line chart is not advisable especially when you want to see more information about price of an asset.This is where the candlestick chart comes in as a useful substitute.
Thanks for reading through.
Enjoy the rest of your day.
Assignment by @dibie.
special regards : professor @dichamo and @shemul21