Hello everyone 🤗
I hope we are all in good health.
I have gone through the lesson by professor @sachin08 and so today I will be working on the assignment.
Please enjoy.
 designed in pixellab

Before delving into the Crux of explaining the detailed information about the rectangle pattern,it is only methodical that I first establish what a rectangle pattern is.
The Rectangle pattern is an technical analysis pattern which occur in a chart when price of an asset is moving within a specified bounded range or an horizontal level where resistance and support line are parallel to each other and so the price ends up forming a kind of rectangle shape.
This is due to the fact that the market is ranging and not trending in either direction,price is unable to cut through or break the support line or resistance line.
The rectangle pattern is made up of 2 trendlines which are the support trendline and the resistance trendline,these lines are horizontal and should always be horizontal,but it is imperative to note that they can also slope slightly to the top or down.
The rectangle pattern shows the struggle between the bull and the bear in the market,as to the direction the price is going to breakout.
Due to this struggle,we see price bouncing within a bounded range and not trending in either direction.
In the Rectangle pattern,there is no trend.
After the struggle within the bounded range,we expect price to break out of the rectangle ,the direction where it breakout eventually will automatically become the trending direction and price will start trending towards the direction.
But most times,we experience what is called false breakout.
This is a breakout that is not successful,it occurs when price breaks out of the rectangle to an uptrend/downtrend and then fall back into the rectangle again.
Explaining the rectangle in my own words without talking about breakout, which happens to be an important part of this pattern is incomplete.
A break out is the point where price break the rectangle and end it by trending above it or below it.it is the point where price moves out of the bounded range which forms a rectangle.


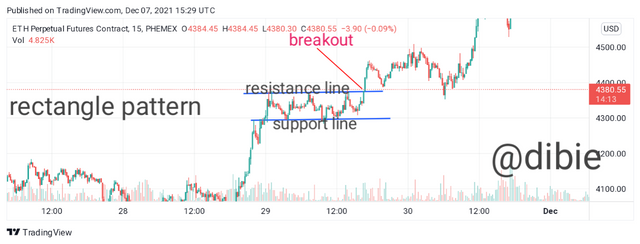 screenshot from trading view
The rectangle pattern is a pattern that is really not that easy to identify or locate,but with the help of some point and ways,we can reduce the stress of Identifying it and also make it easy to identify.
With the use of price trend,we can easily Identify a rectangle pattern.
This can be done by looking for a point or region where price moved up or moved down for a short time and then start forming a ranging market where the price couldn't go beyond a particular level.
We tend to see price moving in a zigzag kind of motion not trending at all, just ranging.
We can also draw 2 horizontal trendlines above and below a ranging market, whereby enclosing the price in a rectangle like shape, forming parallel trendlines.
For the rectangle to be valid,there should be at least 2 point where the price touches the support line making a "W" and 2 points where it also touches the resistance line forming an "M".


As far as trading is concerned especially when making use of chart,the Importance of using indicators to get accurate result can not be overemphasize.
Indicator helps trader understand the market more and also give a clearer view of the market as well as alerting and giving signals to traders.
Indicators can be use alongside this pattern and it is also advisable to always make use of indicators when trading.
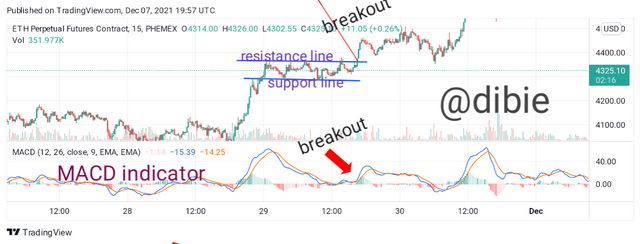 screenshot from trading view
Looking at my screenshot above,I made use of Moving average convergence and divergence{MACD} indicator alongside this rectangle pattern,not only does it provides a clearer view of the market it also indicate that price is about to break out and continue in an uptrend.
With this MACD,a trader can recognize false breakout from a genuine breakout in the chart.


RECTANGLE TOP
The rectangle top is a type of rectangle pattern which occurs in the market when price enter a rectangle pattern from below or from the buttom and then the price starts consolidating for a bit by not trending in either direction and can be seen ranging within an horizontal level of resistance and support whereby it ends up forming a rectangle pattern.
The ranging Market or consolidation phase is taking as a slight pause in the market,given room to traders to reevaluate their trading position and make Importance decision in the market..
After this slight pause,we expect price to resume and continue in an uptrend since rectangle pattern is a continuation pattern.
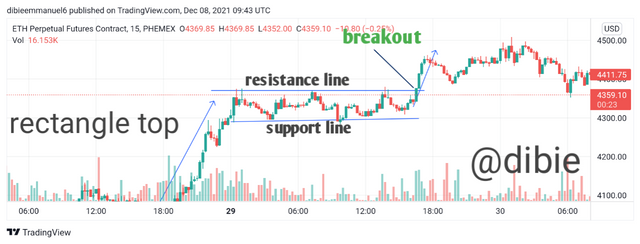 screenshot from trading view
Looking at my screenshot above,you will notice how price started initially with an uptrend and then entered the rectangle pattern from the buttom after this,we see price struggling between the resistance and support line and price eventually broke out of the rectangle from the resistance level to continue the uptrend.
RECTANGLE BUTTOM
The rectangle buttom occur in the market when price enters Into the rectangle pattern from the above,it is the contrast of the rectangle top.
The price starts with a downtrend and eventually entered the rectangle pattern from above and then price starts ranging within and between the resistance and support horizontal level forming a ranging market.
The ranging market or consolidation phase which is like a pause in the market indicates that sellers needs to catch their breath before the price continue to go down further.
After the slight pause,we expect price to break out from the buttom since it entered the rectangle from above and then continue to trend downward.
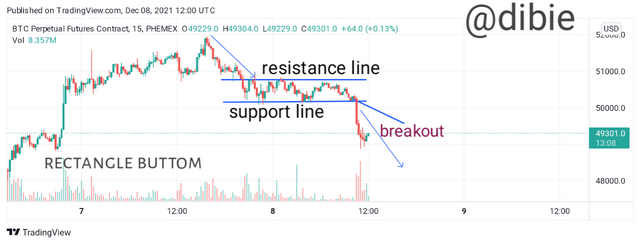 screenshot from trading view
Just as seen in.my screenshot,it is a replication of everything I stated above.
price started with downtrend,entered the rectangle pattern from above,breaks out of the rectangle from the support line and continue trending downward.


To set up a trade for rectangle is not as complex as it seems.
One just have to understand simple steps and certain procedures.
In this part of the question,I will be setting up trade using both the rectangle top and buttom trend.
Trade set up for rectangle top[ETH/USD]
To set up trade using the rectangle top pattern is very simple and I will be highlighten the steps and procedure to follow.
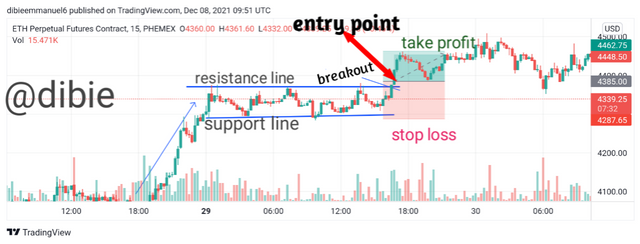
•First thing to do is to draw two parallel lines which signifies the resistance and support line.
•Entry point:once these lines are drawn,we look for the point where the price closes above the upper parallel line or resistance level which is the breakout and then you
enter a long buy order
•Your stop loss should be placed below the support line or the lower parallel line of the rectangle.
•To take profit,you have to set a profit target by measuring the height of the the rectangle pattern and then replicate that same height at the top of the resistance line or above the upper parallel line.
Just as simple as that.
screenshot from trading view
As seen in my screenshot,I enter the market and place my buy order as soon as the price broke the resistance line at 4385.00 and I place my stop loss at 4287.65 and after measuring my rectangle and replicating it above the resistance line,I placed my take profit at 4462.75.
once any of these requirement is met,my order will b executed.
Trade setup for rectangle buttom [BTC/USD]
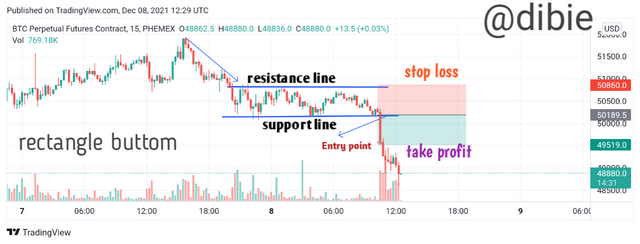
•Draw two parallel line which will stands as resistance and support line for price.
•Enter the market as soon as the price breakout of the rectangle from the support line and place a short sell order.
•Stop loss should be above the resistance line or upper parallel line.
•Take profit should be done by setting a profit target by measuring the height of the rectangle use for the pattern and then replicating that same height below the support level.
 screenshot from trading view
from my screenshot,after making the rectangle by drawing 2 parallel lines which serve as resistance and support,I entered the market as soon as it breaks out from the support and then place a short sell order at 50189 and stop loss at 50860 and my profit target at 49519.


The Rectangle pattern is no doubt an important pattern when trading,it is made up of 2 trendline that are parallel to each other and we see price bouncing and ranging in it.
Understanding and being able to identify this pattern will go a long way in helping trader make more profit and avoid loss in the market.
I wouldn't fail to acknowledge and appreciate the effort of professor @sachin08 for this wonderful and eye opening lesson.
Thanks for reading 🤗
assignment by @dibie