.png)
1- Define Fractals in your own words.
2- Explain major rules for identifying fractals. (Screenshots required)
3- What are the different Indicators that we can use for identifying Fractals easily? (Screenshots required)
4- Graphically explore Fractals through charts. (Screenshots required)
5- Do a better Technical Analysis identifying Fractals and make a real purchase of a coin at a suitable entry point. Then sell that purchased coin before the next resistance line. Here you can use any other suitable indicator to find the correct entry point in addition to the fractal. (Usually, You should demonstrate all the relevant details including entry point, exit point, resistance lines, support lines or any other trading pattern)

1- Define Fractals in your own words.
A fractal is a pattern that will be repeating over time, since we will be finding similar structures in the present according to what happened in the past, but it is said that it will have a larger or smaller size depending on whether the graph is is in a bullish or bearish phase. So traders are simply waiting to notice certain similar movements, where it can be said that a fractal has happened and it can be a very successful strategy because many times the price movements if they make rises or falls that are traced to past movements and that they can be used in the present to take a trade in the market.
The so-called fractal was born from a mathematician named Mandelbrot and was later used in trading, taking into account that many things that happen in everyday life can have a great relationship in the markets, which is a structure that is later replicated in a way subdivided and with great similarity of the same scale or greater or less, but in itself I can say that the structures of the past can then be used in the present and that they leave us positive operations.
In the market certain movements in the short term or low time frame can have a disorderly movement, but a trader with great detail about the price action can see that this movement has great shape in the long term or longer time frames and all this generates patterns. fractals. Then we have indicators that help us achieve these fractal movements, giving us buy and sell signals but it is important that we first learn the rules for identifying types of fractal patterns, which I will be talking about next in the next question.

2- Explain major rules for identifying fractals. (Screenshots required)
As in all the patterns or strategies that are used in trading, certain rules must be carried out so that a valid criterion of the operations that we will be taking in the market can be had:
First of all we have to visualize an impulse, as I was telling you in the definition, a fractal begins with consecutive candles which are intended to be at least 5 candles, so that a fractal can be identified with greater precision and if we find fewer consecutive candles then It would not be a highly accurate fractal and even the best thing is to wait for another movement.
Then we have to take into account that we are going to find bearish or bullish fractals, then we have to first identify the trend of the cryptographic asset, then hope that this movement can be replicated later in time and thus we would have a fractal.
Bullish Fractal
In the concept, if you do not handle the market terms very well, it may seem somewhat confusing, but in reality, it is very simple since we will simply be able to identify the bullish fractal when we see a lower low and two higher lows on each side. of that candle in the center that will be the lowest low and thus we would have the bullish fractal.
Bearish Fractal
Again we are going to find the same pattern in the market, but this time in an inverse way, taking into account that to identify a bearish fractal we need a higher high, where then we have two candles on the sides that have a lower high and thus we would have a bearish fractal in the markets.

3- What are the different Indicators that we can use for identifying Fractals easily? (Screenshots required)
I have shown a few main indicators that can be used to support fractals in the above image.
Fractal Support Resistance Indicator
To place this indicator on our chart, we have to locate on the Tradingview platform where it says Fx , which is located at the top of the chart, then a box will appear and we will place Fractal Support Resistance and the indicator will appear for us to do. click and have it in our graph.
This indicator will indicate the resistance and support of a fractal where we will be able to identify them by lines, which will be red to identify the support and indicate a buy and a green line for resistance and indicating sales in the fractal patterns.
Fractals average breakout
Again we must follow the same steps to be able to place this fractal indicator, we simply have to click where it says Fx at the top of the graph, then in the box we are going to place Fractal average Breakout and the indicator should appear to click and now appear in our graph.
The upper line will have an average of 5 fractals, then the lower line is the average of the last 5 fractals and the line that we are going to find in the middle will be the average of the two upper and lower lines.
Williams Fractal
Again in the graph we click where it says Fx at the top of the graph, after the box appears we are going to place Fractal and in the first option we will get the Williams indicator which by clicking it will be placed in our graph.
We will be able to appreciate that the indicator is identified with red arrows that go to the bottom of the candles, but also green arrows that go to the top of the candles, as this indicator indicates fractal movements and that we must make purchases or sales depending on the signal that shows us when trend reversals are made in the market.
In the Tradingview platform we can find other indicators that are also based on fractals, such as the Fractal Breakout indicator that has a custom configuration, but I feel that these 3 that I was mentioning are easier to use for any trader in the market and much more if you still lack experience.

4- Graphically explore Fractals through charts. (Screenshots required)
Here we need to have a good vision of the price action to be able to find similar movements from the past, which now have a great comparison in terms of their movements and this we will do without resorting to an indicator, if not we will be placing a Pattern of Bars to be able to identify these movements in the market. To do this I will be using the ADA / USDT chart which I could notice a movement very similar in the past to what happened in the present.
In order to use the Bar Patterns tool we are going to be clicking on one of the tool options on the left side, where then we find the bar pattern and the Fibonacci tool in the same way. I will be showing how to get both options, although I must emphasize that the Fibonacci tool has to be configured, which you must place the important levels according to your technical analysis.
First I will be using the pattern of Bars, because we simply have to select from left to right on the graph to draw the pattern that we are going to be identifying. It is very easy to use but also very practical because it helps us precisely to be able to identify similar movements in a cryptographic asset. After having traced the bar pattern in the first movement, I will be dragging it to place it where its movement seems similar at present and thus they will be able to detail that it has great similarity.
We can visualize in the ADA / USDT chart how the first bullish movement has a great similarity with another bullish movement that was taking place some time later in the present, so we can say that we are facing a fractal pattern that has been repeated today and that we can find a reversal movement in a fall similar to how it was happening in the past.

5- Do a better Technical Analysis identifying Fractals and make a real purchase of a coin at a suitable entry point. Then sell that purchased coin before the next resistance line. Here you can use any other suitable indicator to find the correct entry point in addition to the fractal. (Usually, You should demonstrate all the relevant details including entry point, exit point, resistance lines, support lines or any other trading pattern)
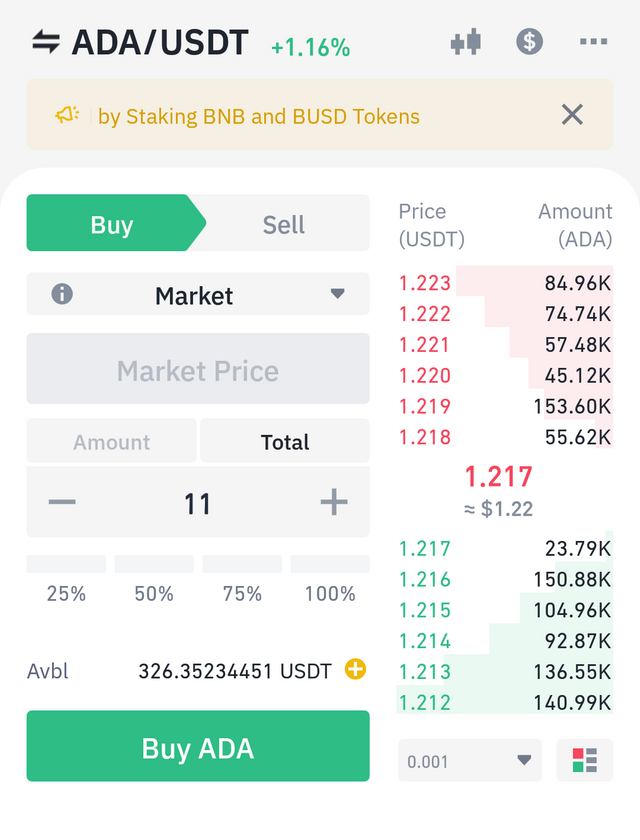
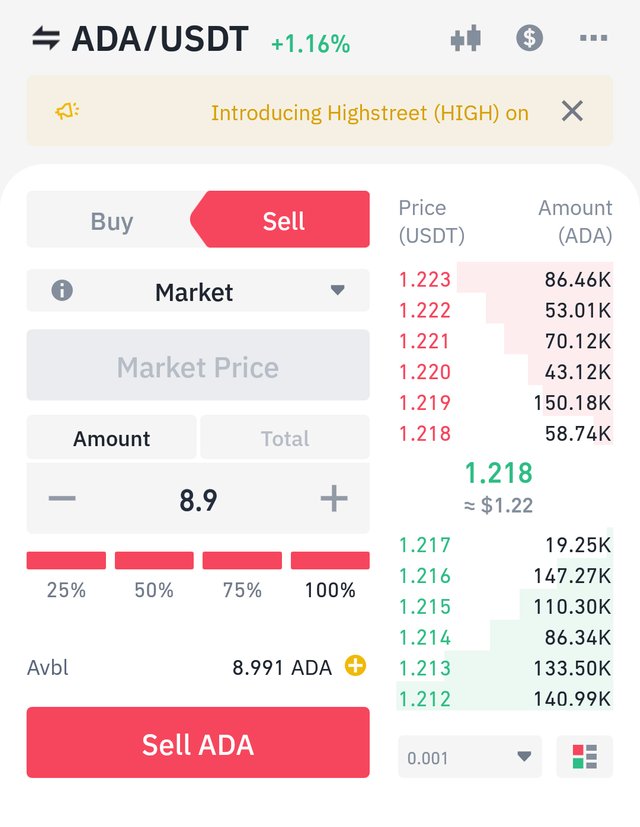
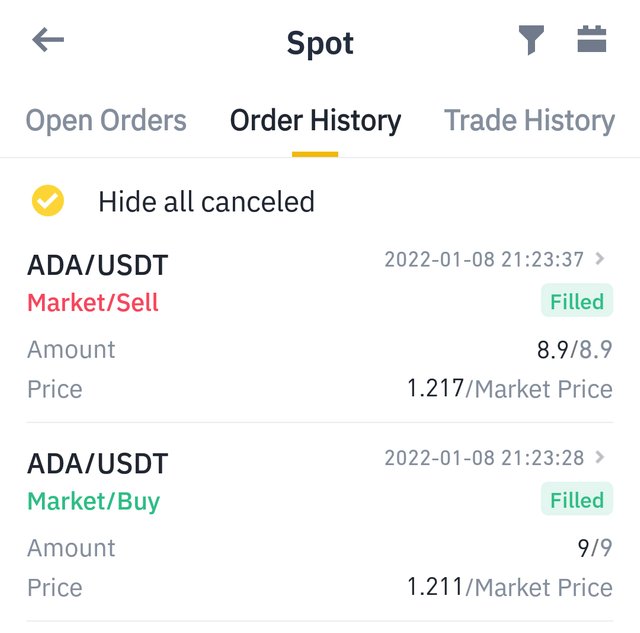
I have selected the ADA/ USDT cryptocurrency pair to demonstrate the buy and sell orders.


The sell order is placed at 1.217 and the buy order is placed at 1.211.

Conclusion
We have been able to learn a lot about what a fractal is, taking into account that it is a pattern that repeats over time and that in the market it can be identified by 3 candles, being in a bearish phase a candle in the middle with a lower low. low and two candles on the sides with higher lows. Then in a bullish phase, we find a candle that has a higher high, while on the sides it has 2 candles with lower highs, and in this way we have the fractal signal both bearish and bullish.


