.png)

1- Introduce Leverage Trading in your own words.
The leverage trading by its name says it’s about trading from a borrowed capital from another party. In trading crypto currencies traders engage in leverage trading by the capital borrowed from a broker. This is also called the margin trading. This method can be identified as one of the best ways to earn maximum profit. The trading amount exceeds the amount that the traders have in his account. When the cash used for trading is high then the purchase ability is high. It is just like trading from lent money. According to the crypto asset the trader is trading the amount that is lent by the broker is different.
Leveraged trading is an attractive option for traders and investors given that it allows them to get their potential returns. It is clear that the higher the risk you take then, the greater the level of knowledge and experience required overcoming risk, which is important when trading leveraged assets in a volatile market like crypto trading.
For example if we have 10$ with us but we need 100$ for the trade we can go for a leverage trading method by lending the needed amount from another party, probably a broker.
This method is recommended for experienced and advanced traders as they have the knowledge to deal wibe lentfor beginners it is not advisable to use the leverage trading system.

2- What are the benefits of Leverage Trading?
When talking about leverage trading it gives smart opportunities for the traders. Everything has its own risks and opportunities. So we will understand the benefits and opportunities that we can gain from leverage trading as traders.
- Provides us with access to additional funds as we lend money from the broker to enter to the market.
- The leverage trading allows us to broaden the market so that it gives the opportunity to have good profits
- We see that the use of leverage will increase the profitability as traders.
As a whole if we take the leverage trading, the money can be lend for a low interest according to the cash in hand. The losses can be minimized when the market seems to be still the traders can keep the trade by adding more money without liquidizing the whole amount. The profit margin is clearly visible so the trader can exit the trade once the desired profit is gained.

3- What are the disadvantages of Leverage Trading
As I mentioned above, the leverage trading is not recommended for all traders as even the strong traders fail due to its high risk. Let us identify its disadvantages and risks before using this method for trading.
- A fee is charged from our invested amount as a holding fee.
- This is very easily subjected to liquidation once facing a trend breakout creating a loss.
- The initial capital subjects to depreciation in a liquidation of the trade.
- This is a more complex method as it contains capital loss risk and more management skills.
- The leverage takes the capital of investment to a very higher level from the current position so the investment is open for high risks.
- More probability of losing the cash due to market trend breakouts.

4- What are the Basic Indicators that we can use for Leverage Trading
Parabolic SAR
This indicator helps to identify the price trends and movements in trading using leverage method. The appearance of the indicator can be changed but there I no need to change the start, increment and the maximum value of the indicator. The Parabolic SAR is used to identify the price movement of the asset. It also indicates the change of price so that the trader can get the idea about the market properly.
The indicator consists of a dotted line segments which switch from the bullish to bearish according to the price movement. Most experienced and strong hands use the parabolic SAR indicator to predict the price trends.
Relative Strength Index
The Relative strength Index is one of the best indicators to use when leverage trading. The RSI is used to identify the overbought or oversold positions of an asset. It is added as an oscillator which comes below the price chart as a line which moves up and down with the change of price.
The RSI values over 70 to indicate an overbought position of an asset and it values below 30 to indicate oversold position of an asset. This is easy for the traders to take investment decisions using leverage trading.
Exponential Moving Average
The EMA is a type of weighted moving average which represents the price of assets over time. This indicator gives more weight to recent data. The EMA has a formula to calculate its value. It can be gained after calculating the Simple moving average.
If the asset price goes below the EMA gives a bearish signal when the traders need to go for sell positions and when it goes above the EMA it signals a bullish signal the traders can go for buy positions.

5- How to perform Leverage Trading using special trading strategies
Change the chart Pattern
We can change the chart pattern to get the exact and accurate price movements in the market. I changed the chart to Heikin Ashi charts which give smooth price information that the normal candlestick chart.
EMA 200 Period
We can use the EMA by changing the period to 200 from the settings. So that we get a line which the price chart goes up and down the line. At the moment the asset price goes above the EMA line which indicates bullish signals where the traders can buy assets.
Use 5 Minute charts
It is good to use 5 minute charts when trading using the leverage method as we need the most recent price movements to observe carefully to engage in trading with lent money.
Parabolic SAR indicator strategy
The parabolic SAR indicator spots the price trend by moving the dotted line segments. If the line segment comes below the chart it signals a bearish trend and if the line segment goes above the chart it signals a bullish trend.

6- Do a better Technical Analysis considering the above-explained trading strategy and make a real buy long or sell short position at a suitable entry point in any desired exchange platform. Then close that buy or sell position after appearing trend reversal signal from the Parabolic SAR indicator.
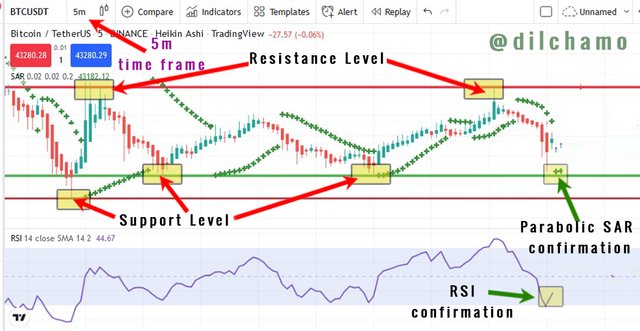
As the professor said I have used the 5-minute chart with the Heikin Ashi chart pattern. I have selected the BTC/USDT crypto currency pair in this. As seen in the image below good support has been given to the price level. here, the parabolic SAR indicator also signals about a buy long position.
Especially, the RSI indicator denotes an oversold position. So undoubtedly I can enter into the trade.
Below you can see how I have successfully entered into the buy long position. As the initial investment I have used 22 dollars and I selected the 2x leverage. From that point onwards I carefully observed whether the price moves towards the target.
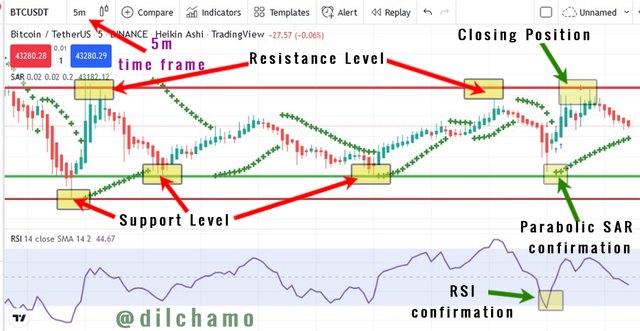
Here you can clearly see that the price has reached up the expected level. Here I have set the resistance level and I hope that the price will reject from that point. So I close my position from that point.
As I mentioned above I have successfully closed my position. I must say that as I identified the price movement clearly, I could earn a simplw profit of 2.6$ from this trade.

Conclusion
Leverage trading is about trading from a borrowed capital from another party. In trading cryptocurrencies traders engage in leverage trading by the capital borrowed from a broker. This is also called margin trading. This method can be identified as one of the best ways to earn maximum profit. The trading amount exceeds the amount that the traders have in his account. There are pros and cons in this method of trading but it is up to the trader to identify the accurate trading strategies. Thank you professor @reddileep for this valuable lesson.


Downvoting a post can decrease pending rewards and make it less visible. Common reasons:
Submit