Hello Steemians!
Here is my entry for crypto professor @stream4u homework task
What Is A Chart Pattern? Explain with Candlestick Charts.
What Is A Price Breakout? Explain with Candlestick Charts and mention the price levels.
What Is A Continuation Pattern? Explain with Candlestick Charts and mention the price levels.
What Is A Higher High Formation? (Explain with one of the crypto coin charts where the Higher High Formation identified.)
What Is A Lower Low Formation? (Explain with one of the crypto coin charts where the Double Top Pattern identified.)
What Is A Reversal Pattern?
What Is A Double Top Pattern? Explain with one of the crypto coin charts where the Double Top Pattern identified.
What Is A Double Bottom Pattern? (Explain with one of the crypto coin charts where the Double Bottom Pattern identified.)
In Investing & Trading What Is The Importance of Stop Level(STOPLOSS)?
Where To Find & How To Set A Stoploss?
What Understood From This Course?/ Conclusion.
What Is A Chart Pattern? Explain with Candlestick Charts


According to IG.com
A chart pattern is a shape within a price chart that helps to suggest what prices might do next, based on what they have done in the past.
Based on this definition, its factual to say that Investing in the market has to do with a lot of predictions as analysis is carried out with respect to previous price changes or market behavior. These patterns are price formations which aid traders in determining trade levels or entry and exit points in a market.
As there are different time frames (30 min, 1 hr, 1 day). These time-frames would most likely give varying patterns but taking a glance through the different time frames of an asset pair helps one discover the trend in the market for example.
Here is a chart pattern of the BNB/BTC pair for a particular period
In the 15 minutes timeframe, the price movements are volatile, and no clear trend is revealed.
Upon switching to a longer time frame
The 1 hr timeframe shows a clearer upward trend for this time period.
The four hour timeframe confirms the upward trend for this time period. Hence with these I've demonstrated the importance of candlestick charts and time frames when trading.
What Is A Price Breakout? Explain with Candlestick Charts and mention the price levels.
A price breakout in a market occurs when a market price of an asset is moving outside a defined support levels or resistance level with accumulative levels.
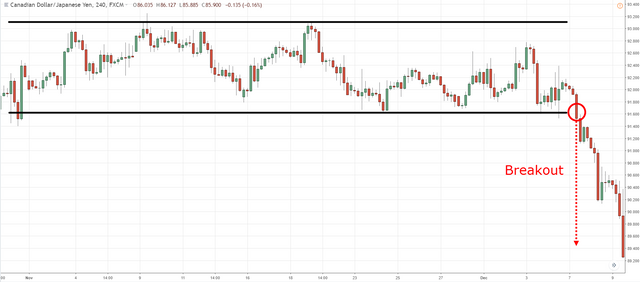
In this chart, we notice the market price constantly respects the support and resistance line as the price moves and restricts itself to these levels. However at a point, the price dips below the resistance line and continues to dip. Hence, at this point a breakout is formed.
From the previous classes by @stream4u. I've come to understand that when a breakout occurs and price maintains this movement, either a new support or resistance level is formed. In the case of the chart used above. The support line becomes new resistance line.
There are also the cases of fake breakouts. In this situation the price may tend to stick out or dip below the support or resistance line as in the case of breakouts but this only.lasts for a short while as price tends to adjust itself and respect the existing support and resistance lines once again. Hence the name "false" breakouts.
What Is A Continuation Pattern? Explain with Candlestick Charts and mention the price levels.
A continuous pattern in the market occurs when price tends to continue in it's existing trend direction (either bullish or bearish) usually followed by a brief pause. In this kind of pattern, price moves in it's direction but brief periods of stop or rest exists
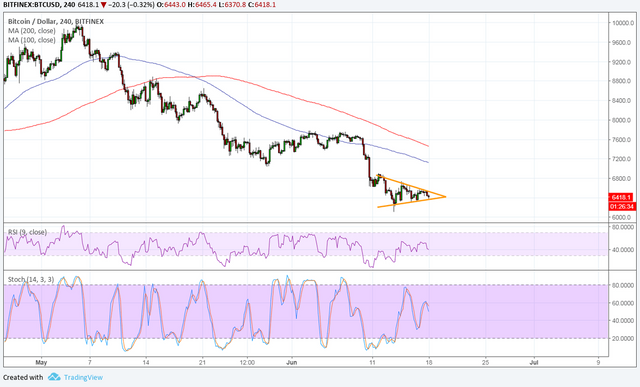
In the chary pattern above, we notice a bearish trend as price drops to a certain point, maintains that level for a while and then continues to drop further following it's trend.
What Is A Higher High Formation?
A higher high formation occurs when the price movement of an asset pair closes higher than the previous high levels. It usually signals that an Uptrend is occuring and here traders get confident and take advantage of the price movements.
I didn't quite get the big idea of this trade term until I did a bit of research myself. I stumbled upon a guide and found a chart where the various higher highs and higher Low's where identified.
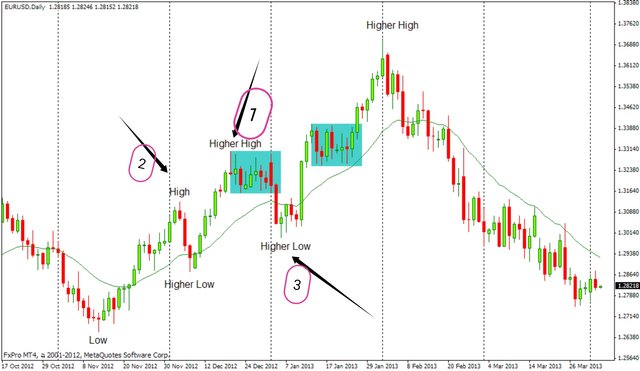
It's observed that the higher high is the point at which the current high (price marked as (1)) is above the previous existing high (marked as (2)). When a bullish movement begins at a point lower the previous existing highest point, it's termed as a "higher low". (Marked as (3)).
What Is A Lower Low Formation
In explaining the lower low formation. The 'lower' concept signals a downtrend. When trading we usually identify the highest and lowest points. A lower low occurs when the current price dips below the previous point marked as lowest on the chart.
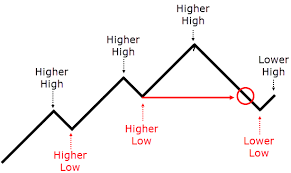
At first I misunderstood the whole concept and though that a higher low and a lower high were the same.bjt I did a little more research and discovered it's just as the name signifies. If the point at which a Uptrend begins is lower than the point at which a previous Uptrend began it's tagged as a lower high. (I'd like to be corrected if I'm either wrong or using the wrong terms to explain this concept).
I took a closer look and i noticed that upon identification of these various points (higher high, higher low, Lower high and lower low). It will be easier to draw trend lines, more like a connect the dots idea.
What Is A Reversal Pattern?
A reversal pattern occurs when the normal movement of a particular market changes i.e from bullish to bearish. It could be said to be the point at which the highs are lower the previous highs(bearish) or the lows are higher than the previous lows(bullish)
What Is A Double Top Pattern?
According to investopedia
A double top is an extremely bearish technical reversal pattern that forms after an asset reaches a high price two consecutive times with a moderate decline between the two highs. It is confirmed once the asset's price falls below a support level equal to the low between the two prior highs.
It took me a while to find this pattern. I opened up the Ada/BTC pair and switched between time frames to discover this pattern. It wasn't obvious at the 15-1hr time frame. However when I switched to a longer time frame, 1 day to be precise. I noticed the pattern and the bearish trend that followed suit.
These two point are higher than their respective highs but are equal to one another hence a Equal top pattern is formed. It's usually hard to spot and proximity might also have a role to play in this trend pattern. Spotting this trend signals a bearish trend.
What Is A Double Bottom Pattern?
A double bottom pattern is the opposite of a double top pattern. It's a bullish reversal pattern that forms after an asset reaches a low price two consecutive times with a moderate decline between the two lows.
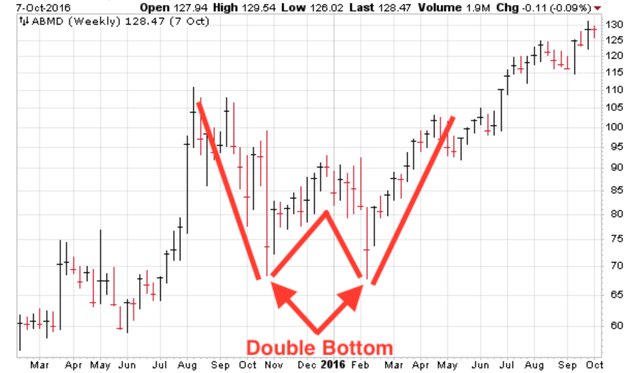
In this price chart we notice that the marked lower lows are equal and respect a particular support level.
In Investing & Trading What Is The Importance of Stop Level(STOPLOSS)?
The importance of using the stop loss/level feature while trading can't be over emphasized. It helps traders minimize their losses. Most beginner traders work with mental stop loss which is a very bad idea. The stop loss feature is automated, meaning you don't have to spend hours staring at your screen and monitoring your open trades for potential risks and losses.
Where To Find & How To Set A Stoploss?
Using Binance as an example.
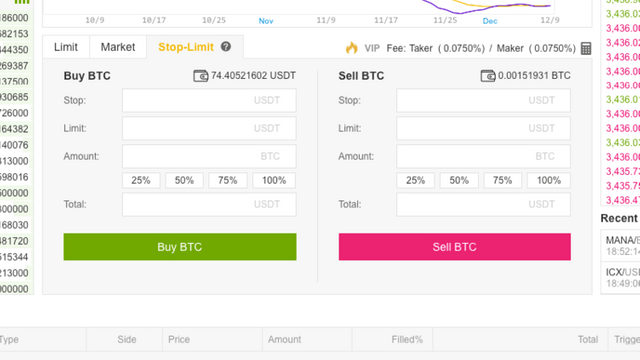
Before making a trade, there exists a stop loss feature. "Stop limit" in binance which enables a trader specify the price range at which a trade should be exited.

CONCLUSION
This course has been a blast!. I admit that before now I had no idea of the concept of higher lows and highs. I've come to understand the importance of these concepts in technical analysis and price prediction. I spent a lot of time on research before I could draft this post and I confess that the time spent was worth it.
Thanks to the steemit team and the crypto professors once again. It's been really interesting so far :)

Thanks for reading my write up.
Cc:-
@steemitblog
@steemcurator01
@steemcurator02
@stream4u
Hi @doppley
Thank you for joining Steemit Crypto Academy and participated in the Homework Task 3.
Your Homework task 3 verification has been done by @Stream4u.
Additional: I appreciate that you spend time finding a pattern and finally got the same in the 1 day candle. I hope the course will benefit your all future trading and Investment.
Thank You.
@stream4u
Crypto Professors : Steemit Crypto Academy
Downvoting a post can decrease pending rewards and make it less visible. Common reasons:
Submit
Thanks @stream4u. I've learnt my mistakes and I definitely wouldn't have to repeat them anymore. Thanks once again :)
Downvoting a post can decrease pending rewards and make it less visible. Common reasons:
Submit