what is the EMA Strategy + Breakout of the Trend line?
The strategy listed above is the combination of two technical analysis tool the Exponential moving average and the trend line. We will be looking at both indicators separately before we look at their functions together.
An Exponential moving average is a technical indicator which is a moving average that is drawn on a chart which is a line. The EMA moves with the price of an asset overtime, it averages data of the asset over a period of time but it's uniqueness is that it makes use of recent data of the asset as the price moves which makes it more effective and reduce false signals when using the indicator. The EMA is used to know price trend over time and several EMA can be used together to determine signals.

A trend line is a line which is usually straight that is drawn on a chart to touch the highest and lowest point of an asset price in order to know the which trend is dominant in the market.
Now that we have gotten the function of both tool we will now look at how they can function effectively together.
The EMA + TRENDLINE STRATEGY solely uses the price action and trendline to enter a trade, when the EMA is activated on the chart whenever the price is above or below the EMA line this shows that the trend is currently dominant, if the candlestick is above the EMA that signifies a bullish trend and if the candlestick is below the EMA it indicates a bearish trend, this alone isn't enough as the trendline will.also be used to validate the market movement.
As we know that the trend line is drawn to serve as a resistance or support and if there is a breakout we know the price keeps going higher. A trendline will then be drawn after determining the trend drawing the trendline from the highest point to the lowest point after identifying a harmony movement of the price of the asset.
ADVANTAGES OF THE STRATEGY
1 It enables a trader to trade with the trend
2 It combines two tools making use of price action and trendline to enter a trade. .
3 During an trend whenever the price breaks the trendline it signifies a good signal at the beginning of a new trend.
DISADVANTAGES OF THE STRATEGY
1 There is high probability of getting false signals during a ranging market
2 There are times where there aren't enough swing point which will allow for the drawing of a trendline especially when the market moves massively.
Step-by-step of what needs to be taken into account to execute the EMA + Trendline Breakout strategy correctly
Since we have gotten the concept behind the EMA + breakout strategy, we will then do a practical example and a step by step guide on how to make.use of the strategy correctly.
STEP 1
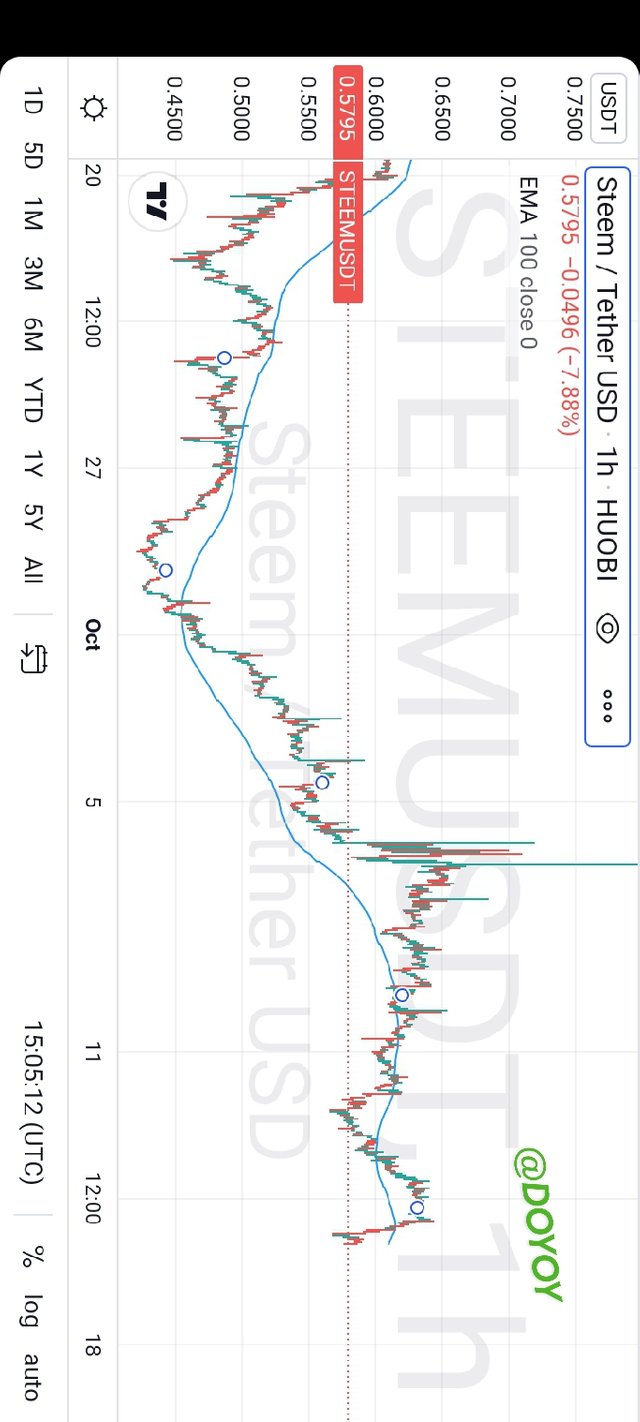
Firstly we need to add the EMA indicator on the chart,I trust we already know how to add indicators on chart if not lemme do a quick guide, first open your charting platform navigate to the chart page then click on the indicator button after which you search for the indicator EMA and click on it when it pops up.
After adding double click on the indicator line to change the length to 100 depending on you, you can use other lengths. The EMA will help us know which direction the trend is which means if the candlestick is above the 100 - period EMA it means the trend is bullish and we should look for a buying opportunity and if the candlestick is below the EMA we will look for a selling opportunity.
STEP 2
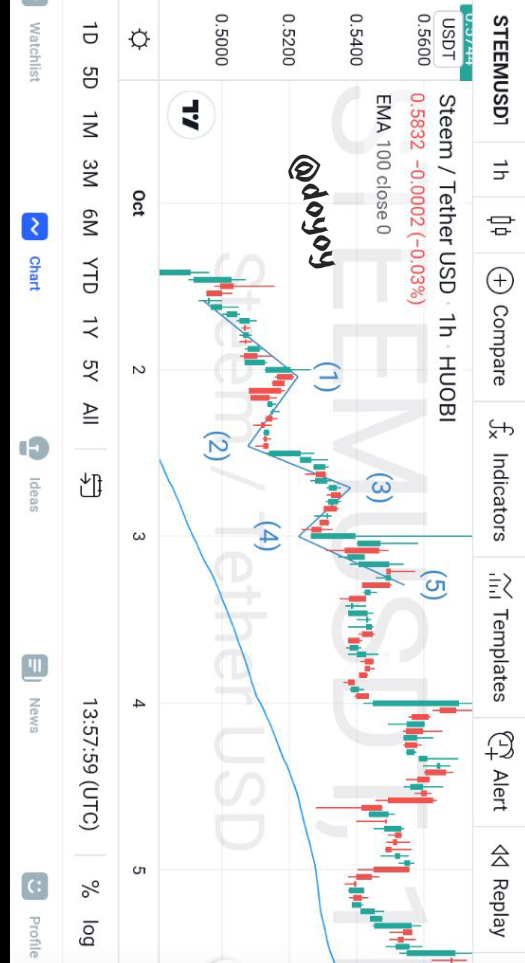
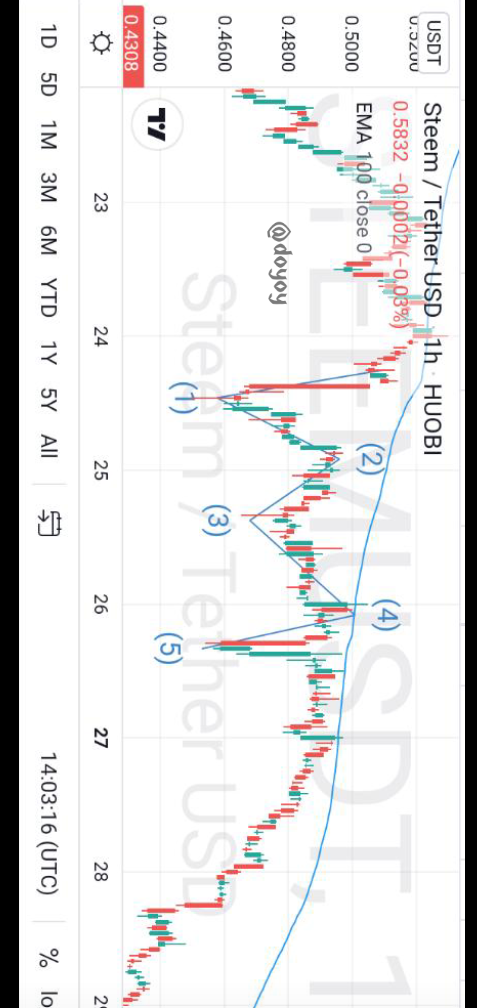
Then we check for the harmony of the price such as the impulses and setback are of similar size, to use in identifying the structure that the price is doing and the cycle which the market is.
For a healthy price structure in an uptrend the price must have Higher highs and lower lows, if this is observed and the price is above the EMA.
STEP 3
After identifying the harmony and the price cycle we then draw the trend line against the trend, in order to check for the breakout of the trendline. If the trend is bullish the trend line then must be bearish
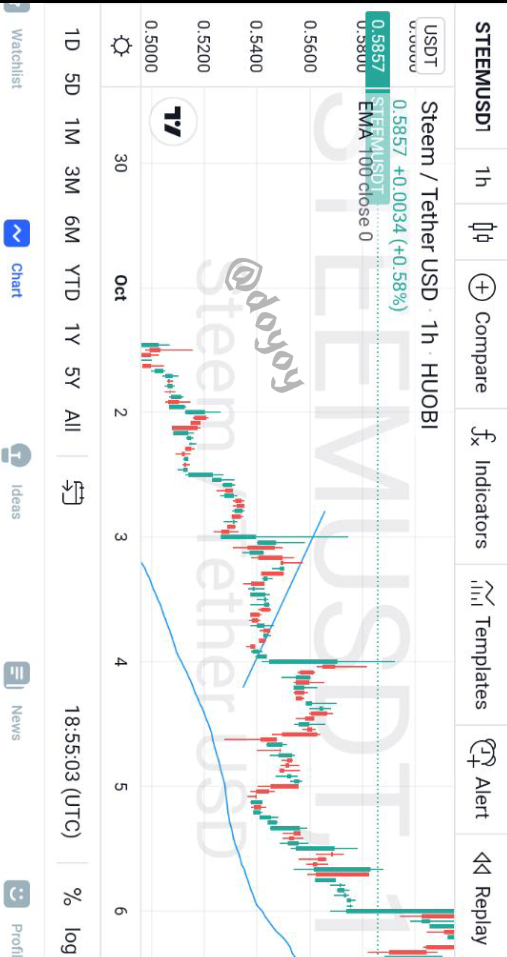
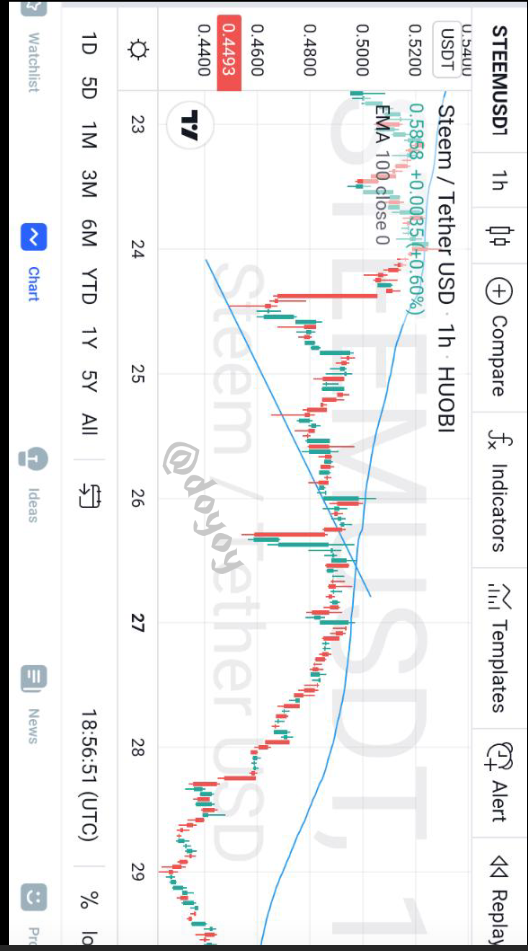
that is the highest point of the price is joined with the lower Hugh's.
This is to look for an upward break out from the trend line to be able to enter the trade. When the trend is bearish we do vice versa by joining lowest points of the price.
ENTRY AND EXIT CRITERIA USING THE EMA + BREAKOUT STRATEGY
Now that we have learnt how to make use of the strategy, and how to make use of the price action, now we need to learn the perfect entry and exit strategy to have a good risk to reward ratio when taking a trade in the market.
Firstly we must wait for the price to move above the EMA if we are looking at a bullish entry or when the price is below the EMA if we are looking at a bearish entry, also the harmony of the price must also be confirmed with higher and lower highs. We should also ensure the price breaks the trend line drawn and wait for the closing of the candlestick before entry.
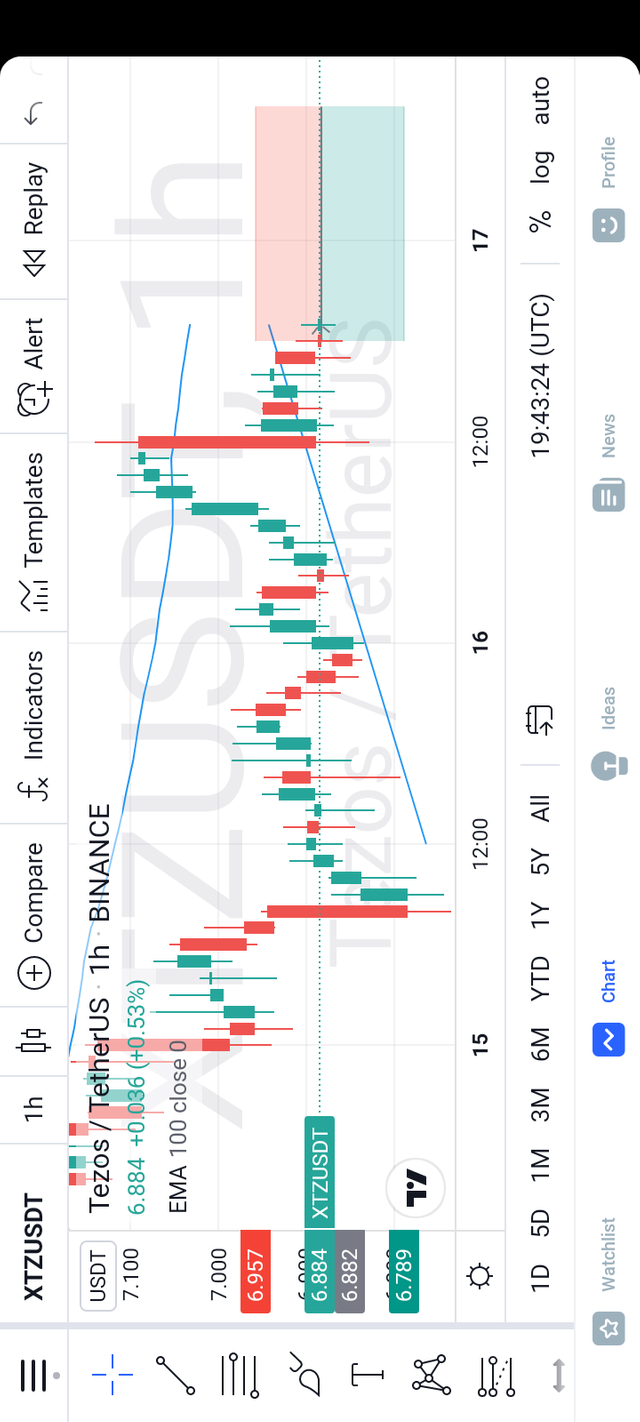
If there isn't a harmonized price in a trend it is better to wait for a new configuration so we can enter the market in line with the rules stated earlier. If the price configuration is established and the trend line has been broken we then enter the market placing a stop loss below the lowest point of the candlestick on the trend line for the long position and we place the stop loss above the candlestick of the higher high on the trendline.
The take profit should be in a ratio of 2:1 stating that for every $1 that will be lost we are risking it to earn $2.
BUYING AND SELLING OF ASSETS USING THE EMA STRATEGY + TRENDLINE
Now that we have understood the strategy, let's buy and sell an asset with the strategy.
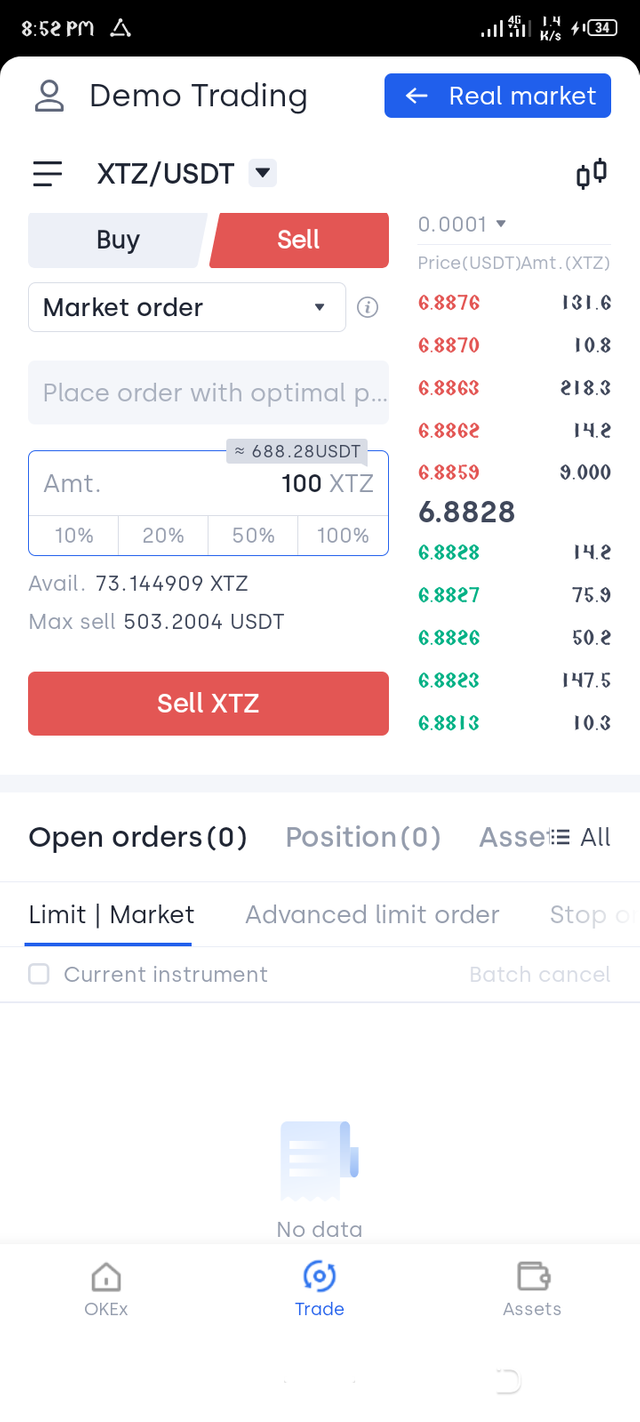
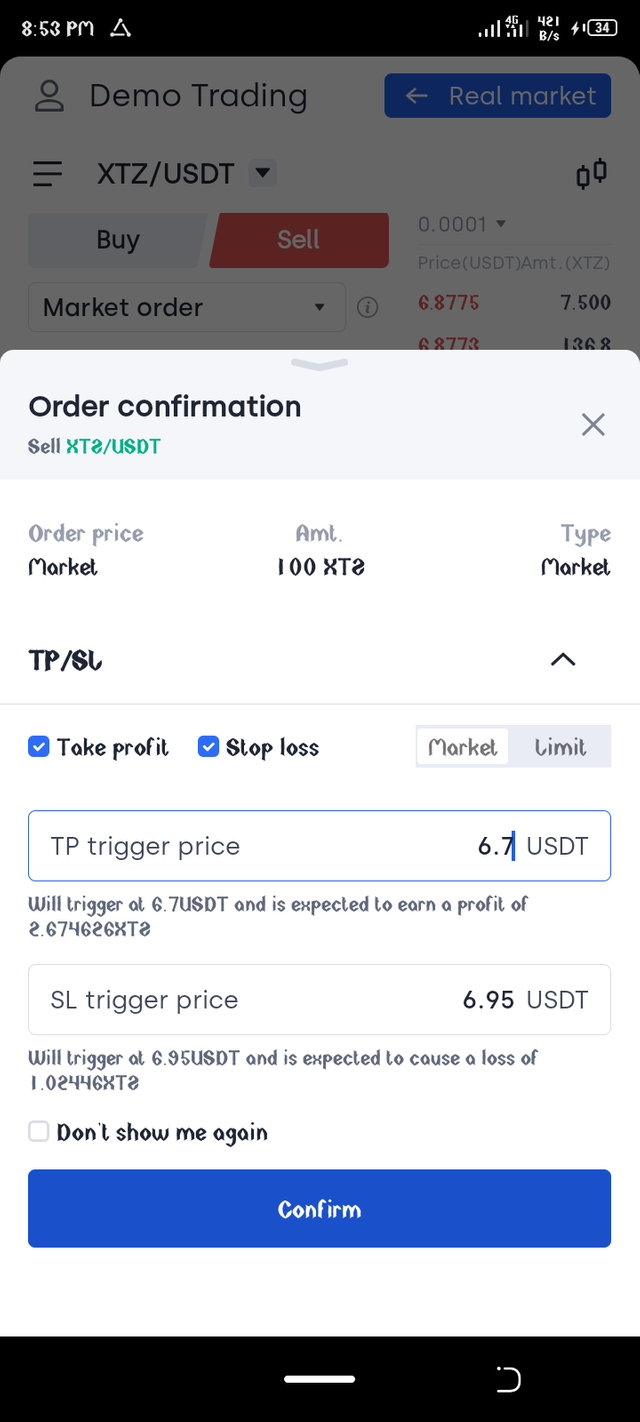
We will be performing a trade on the tezos token, this is a one hour time frame chart and as we can see the price is under the EMA and this indicates a bearish trend after drawing our trendline a break out was noticed we wait for the formation of the next candlestick before entering the trade. The stop loss ans take profit price.
The trade has been placed and we can see from the screenshot above