We are used to the word middle men or the word retailers in the general market. Retailers are those who sell in small quantities to consumers and are the middlemen between the wholesalers and the consumers, this is also what the trading brokers are.
Trading brokers are middlemen or intermediary between traders or investors and security exchanges in crypto. This broker plays the role of helping an investor to execute his or her order on a security exchange. They get commissions from investors or the exchange itself, they help investors trade but they never give investment advice.
Some of the trading brokers are FTX, FXCM, MetaTrader 4, MetaTrader 5 etc.
In this tutorial, we will be making use of the FXCM Demo account, this is quite easy to open and asses.
OPENING A DEMO ACCOUNT ON FXCM
To open a demo account on FXCM this is quite easy.

Firstly, we load the website fxcm.com on our browser and click on create a demo account which will lead us to the page as shown above.
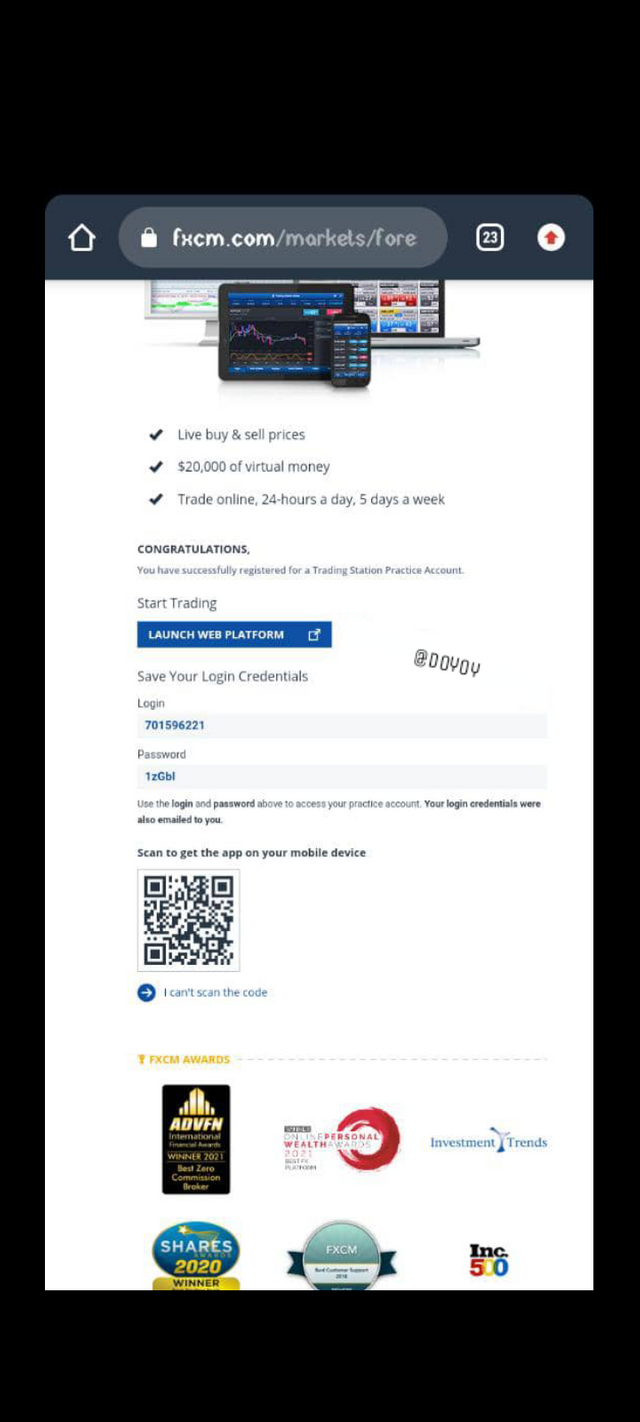
Then you input your email and select your country after which you click on trade now.
Your account has been created, a login will be displayed to you, which will also be sent to your email address.
This login details is what you use whenever you want to access the demo account.
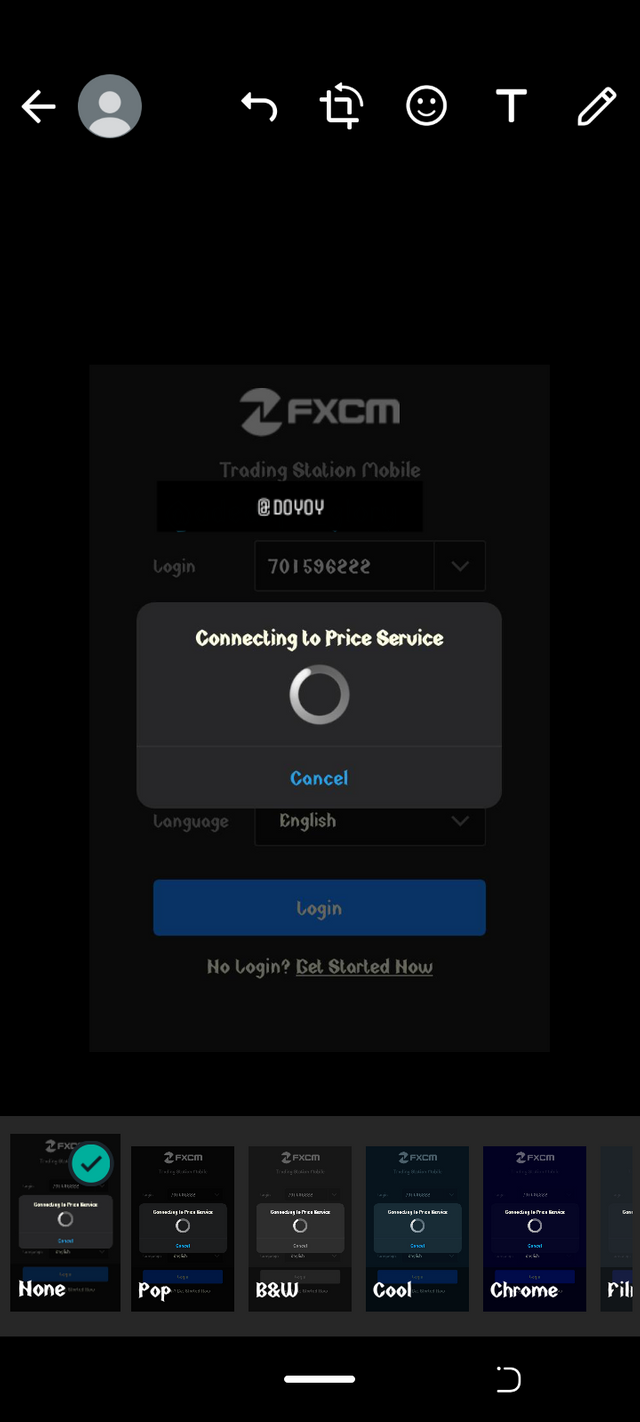
You can either continue using the web version or download the app for better experience.
I have downloaded the app from playstore and login into my account.
Now, we have to select the pairs that we are interested in so as not to have jam-packed pairs.
To select the pairs you wish to see on the platform click on market.
Various pairs has been ticked on default, so you just have to untick the ones you don't want and tick the pairs you wish to trade. I will be ticking 5 pairs in this tutorial.
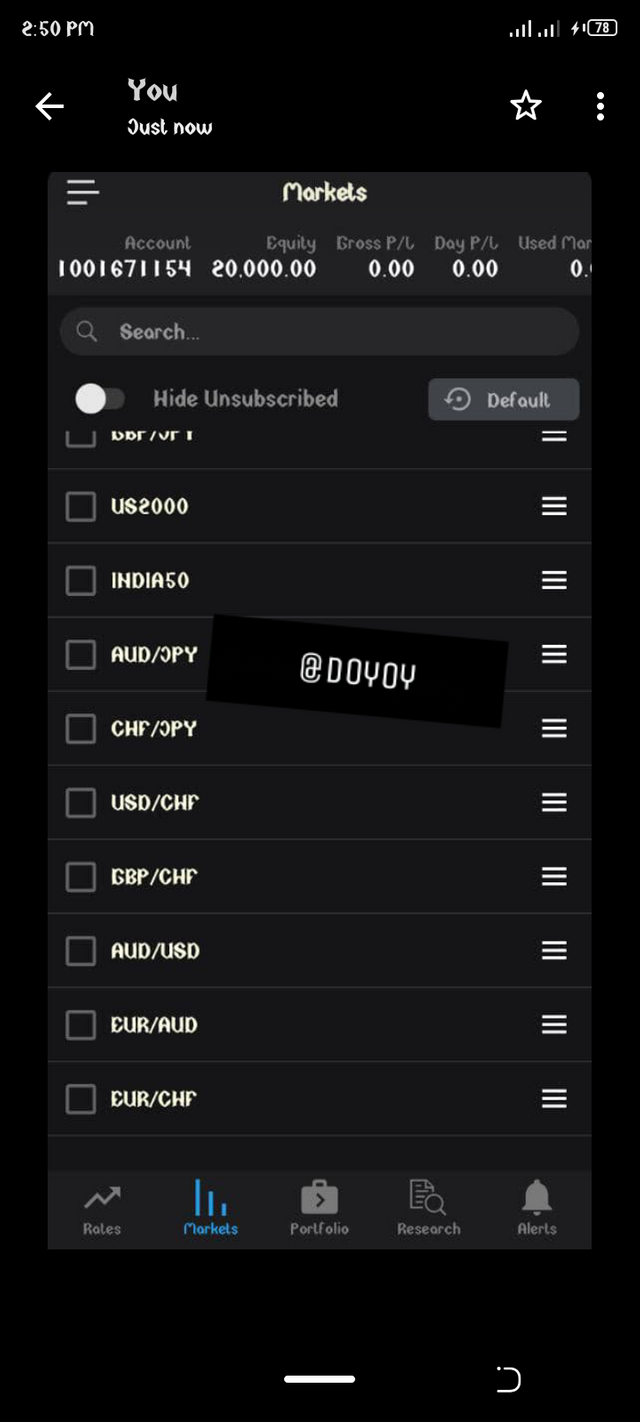
I chose BTCUSD, ETHUSD, EOSUSD, XLMUSD and LTCUSD pairs. These paiirs are all crypto pairs. After selecting them you can then view the pairs selected under the rates section as shown in the screenshot below.
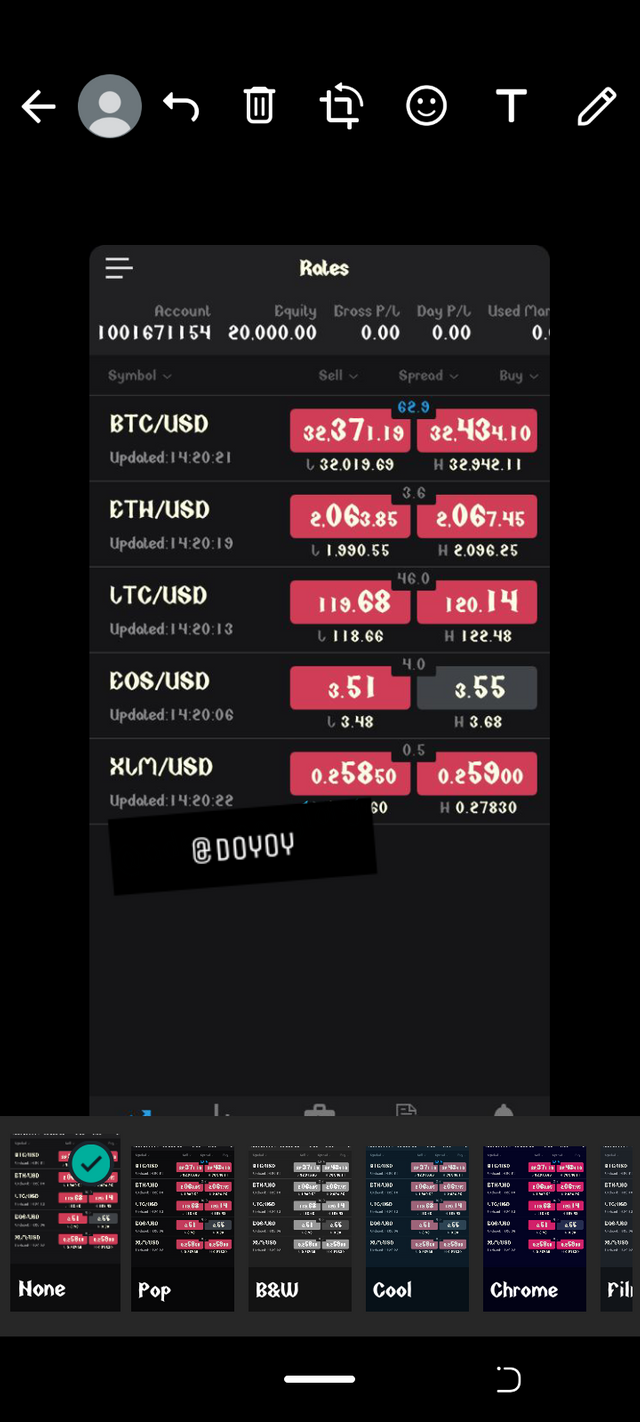
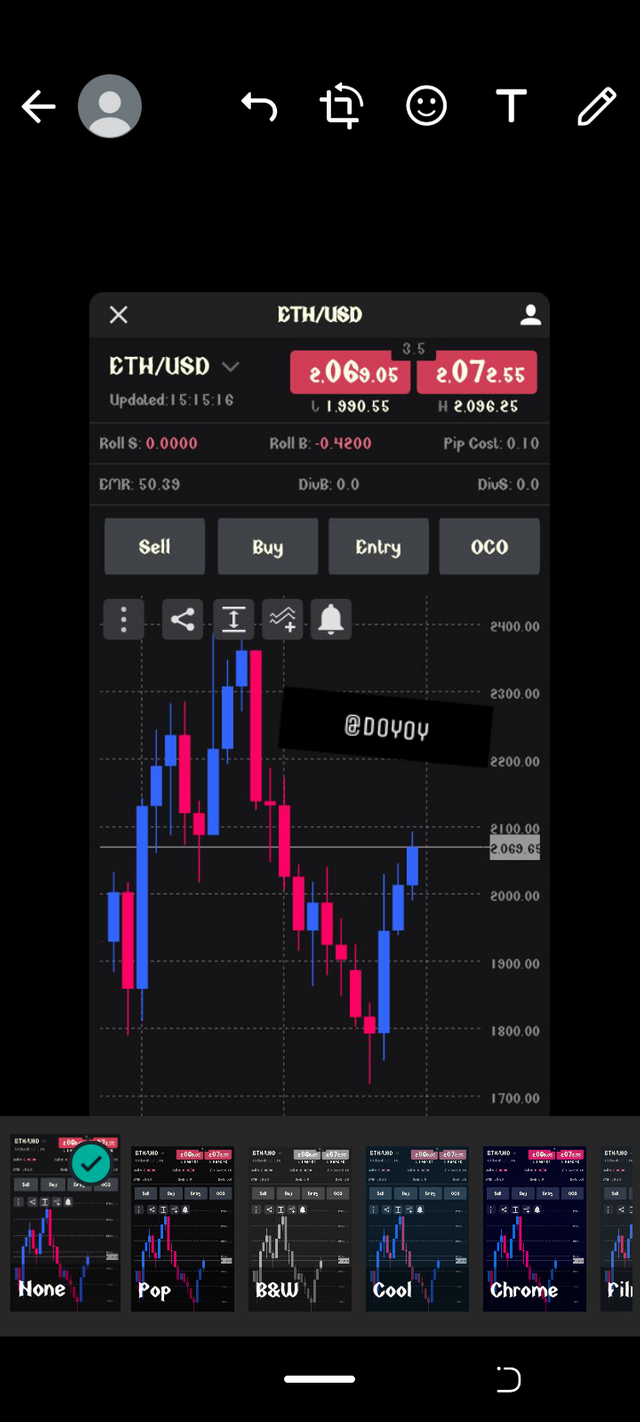
To view the chart of any of the pair just click on the pair and a chart will be shown.
Creating an entry and exit strategy
There are various entry and exit strategy but a trader should stick to the one he or she loves most and go for the one that is quite easy to use which can enable such person practice with it frequently.
For me, I will be using the resistance and support line as an entry and exit strategy.
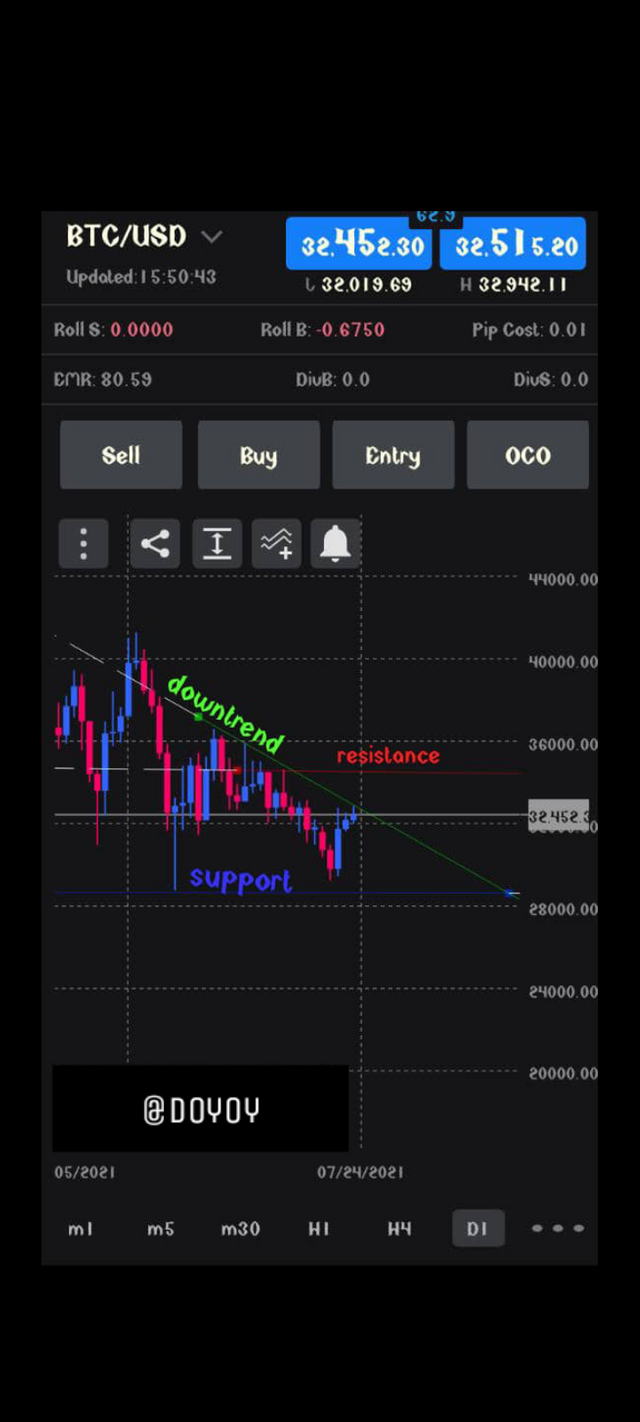
The resistance line is a point at which the price of an asset rises and stops at that point repeatedly either twice or thrice while a support line is a spot at which an asset price reverses back after touching that spot at different times.
These spots can be a significant point for both entry and exit strategy if it
can bemastered.
According to the screenshot above, we can see the lines for the support and resistance. When a trader is to go short or sell an asset, the resistance line is going to be the entry point, so once the candlestick hits the resistance point, we wait for the formation of a new candlestick that will indicate the reversal of the movement of the price, after the confirmation one can then short at that price, set his or her stop loss a little above the resistance level then set his or her take profit at the previous support line or before the support line depending on the trader and the profit one intends to take.
If one is to go long as well one will wait for the candlestick to get to the support line, after which we wait for the formation of a candlestick to show reversal for the price, this point becomes the entry point and then we set our stop loss a little below the line and set the take profit at the resistance line drawn.
A trader can decide to set multiple take profits depending on the trader. For me I take 2 to 3 take profit in my trades. Which at times 2 gets executed and most times all get executed. This strategy is for a scalping trader who takes profit little by little.
Also sometimes when the candlestick goes above or below the resistance and support line this is another indication of a reversal but one has to study the candlestick. So it is advisable to make the candlestick your friend in this kind of strategy.
Using the commodity channel index CCI to get signals for trade.
The commodity channel index is a type of technical analysis tool used by traders to give signals of trades.
This is under the oscillating tool of technical analysis. CCI is a bit related to RSI the only difference is that CCI doesn't have bound to unlike the RSI which is bounded to go between 0 to 100.
The CCI helps to identify when an asset has been overbought or oversold at a particular time.
The CCI has a high point which is above 100% the normal level is at 0 and the low level is at -100%> whenever the price crosses either the high level or the low level there is always a reversal.
The crossing of these levels shows either an overbought or an oversold assets the levels are set by calculating the historical prices of the asset both the highest and lowest prices for a particular time.
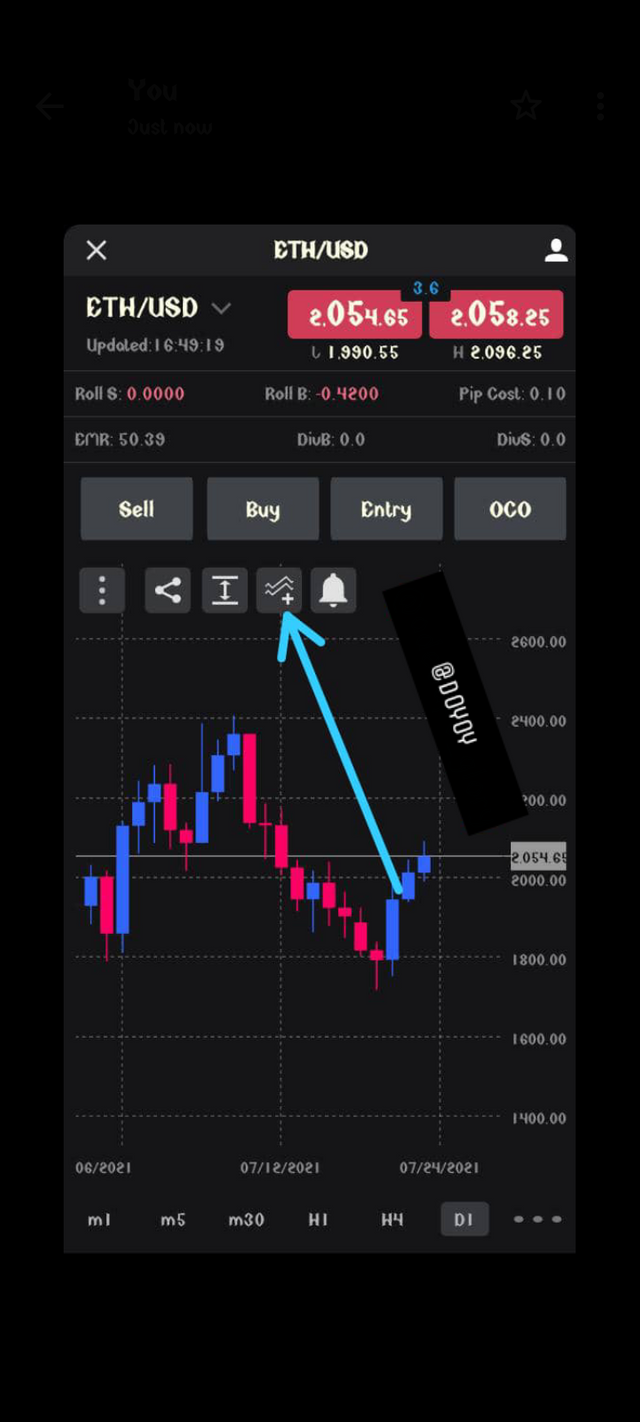
To set a CCI on a chart, firstly you open the chart on the platform, then we click on the button which the arrow is pointing at. That button is a button used in adding indicators and lines on the chart.
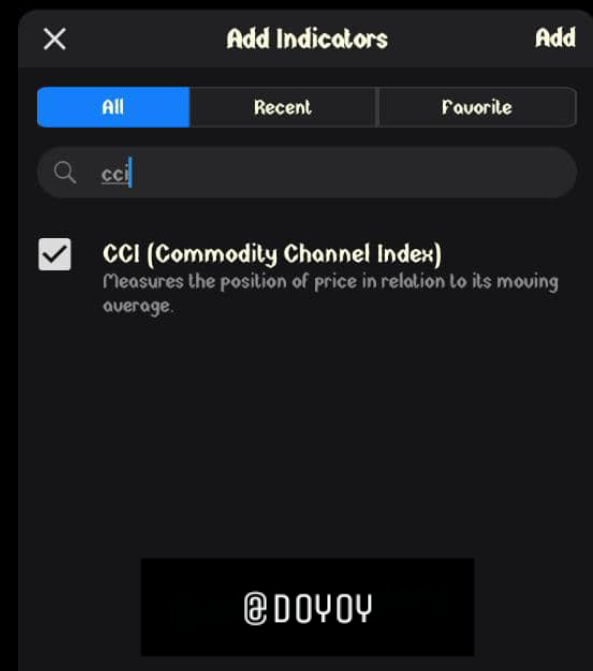
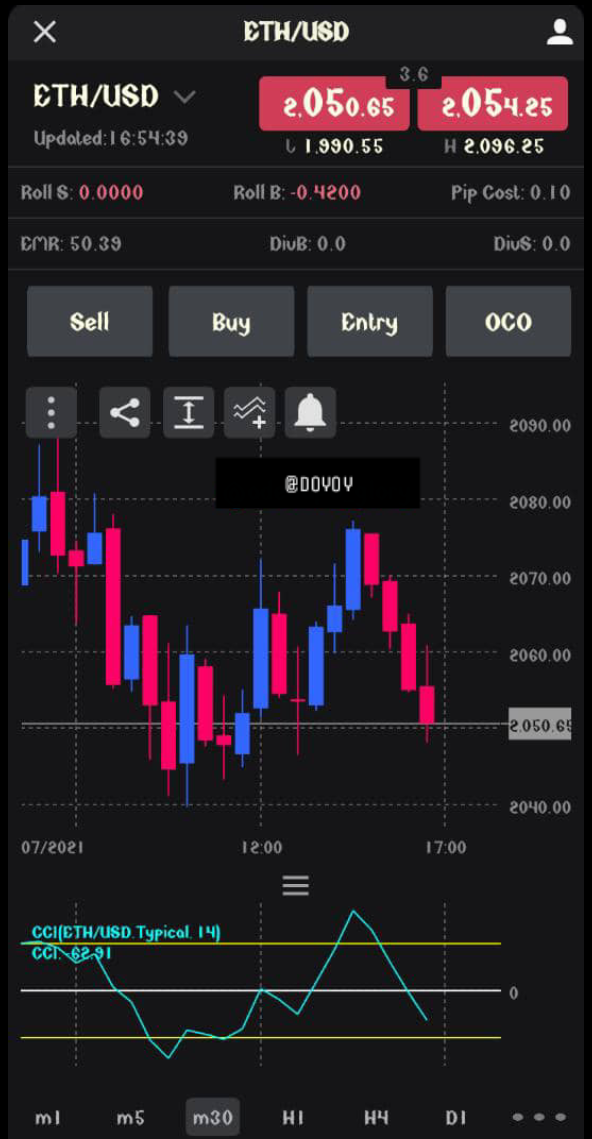
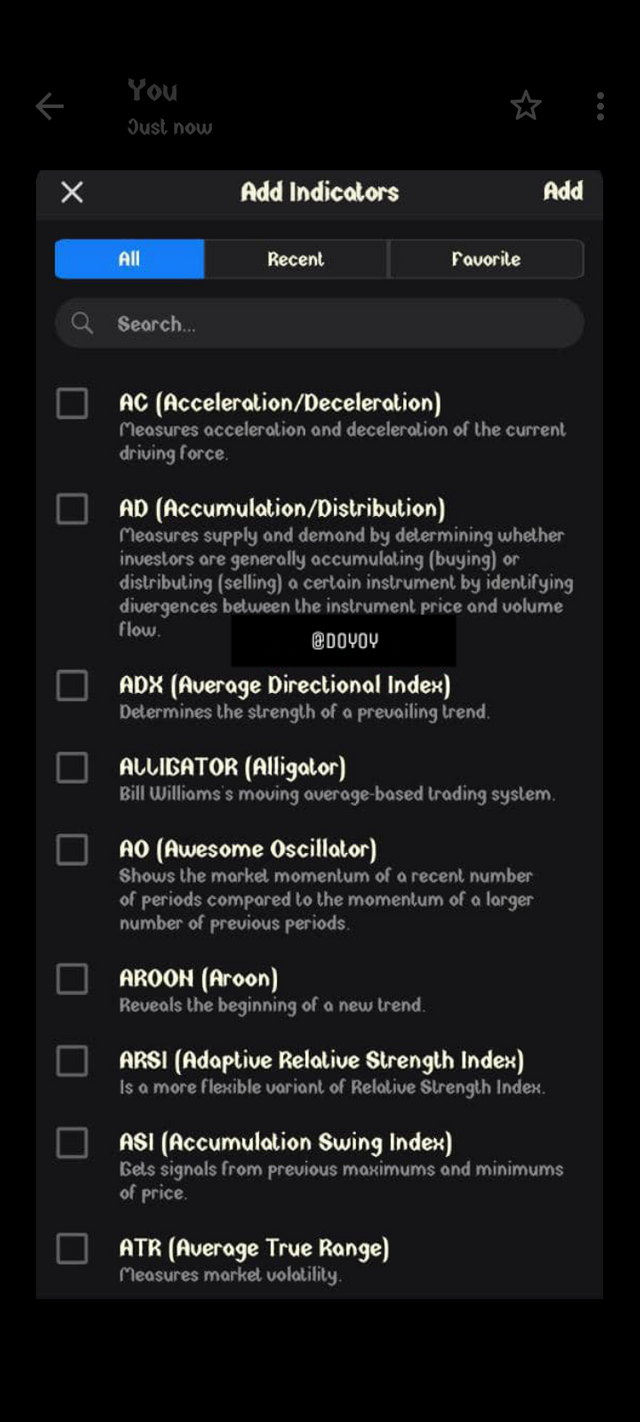
We then search for the indicator we want to use using the search bar, after which we click on the indicator when it pops up and click on add to add it to the chart.
The indicator is then shown on the chart.
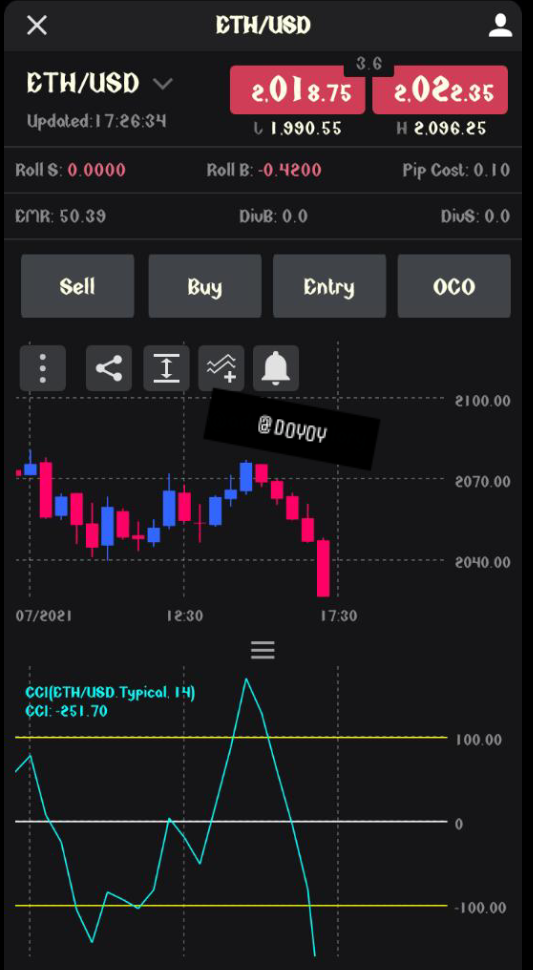
Using CCI to enter a trade, let's take a look at the screenshot below and see what it says.
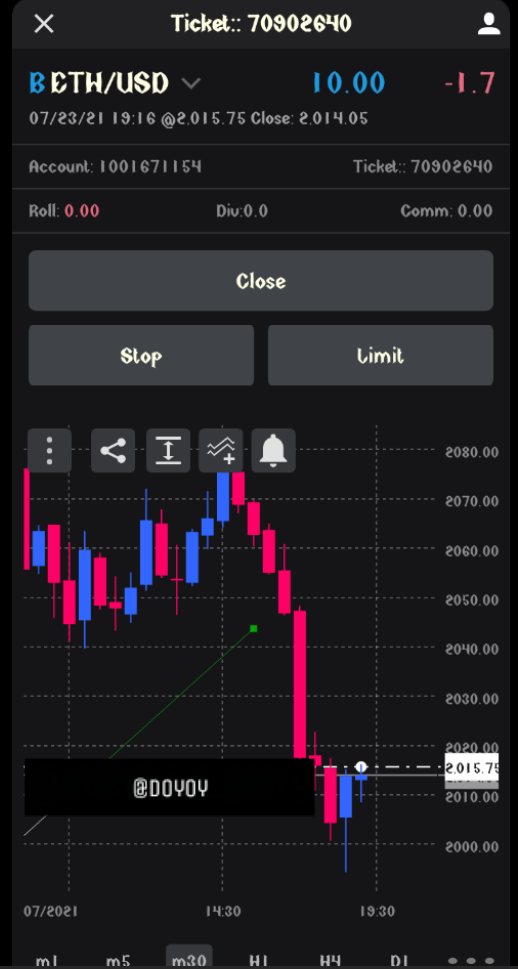
According to the chart we can see an oversold market in the 30 mins chart of ETHUSD. This shows that there will be a reversal soon and we need to monitor the chart for that.
The second screenshot shows a short change in the direction of the price but it is not certain yet, for me I will wait till the line touches lowest level before entering the trade.
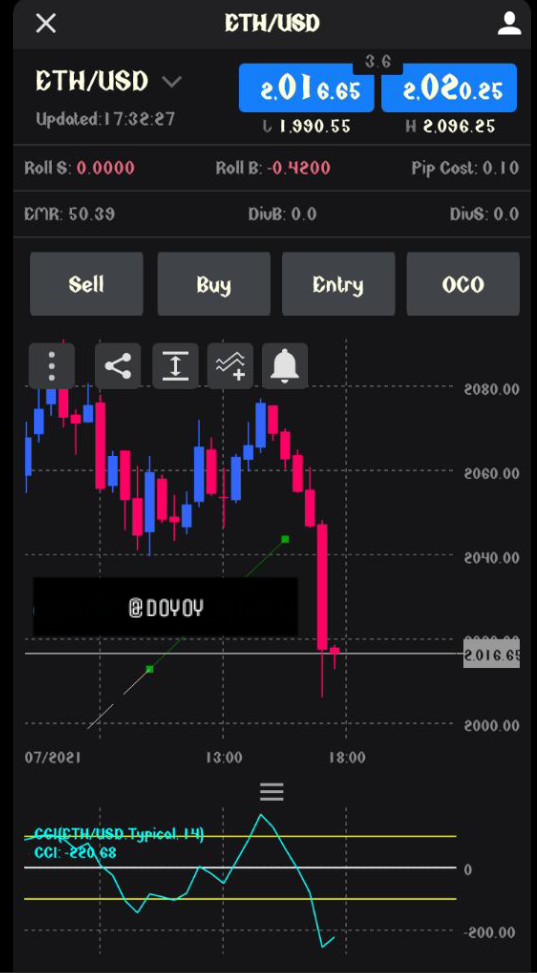
The trade has entered our entry point. The line has touched the lowest level which will be serving as our entry point. I will enter the trade at this point and set my first take profit when the line touches the normal level, then another take profit for the highest level.
According to the screenshot I entered the trade at $2015.75 and a stop loss was set at $2014. 05 which is a bit below the lowest level.
Note: it is advisable to use the timeframe 30mins, 5 mins or 1 mins when day trading so as to get the correct interpretation of the indicator tool been used. Since the day trading is for a shorter and quick profit.
LTCUSD.trading using the CCI as signal for buy and sell
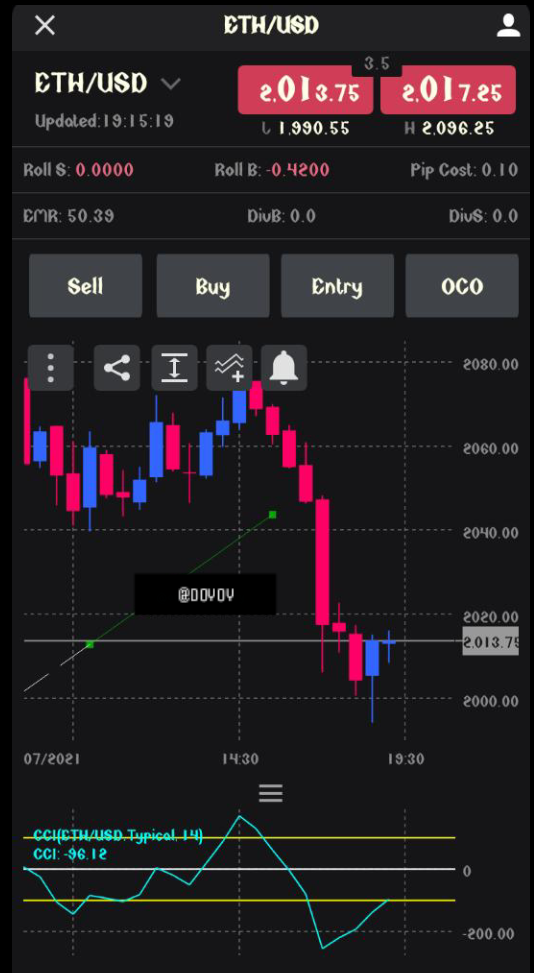
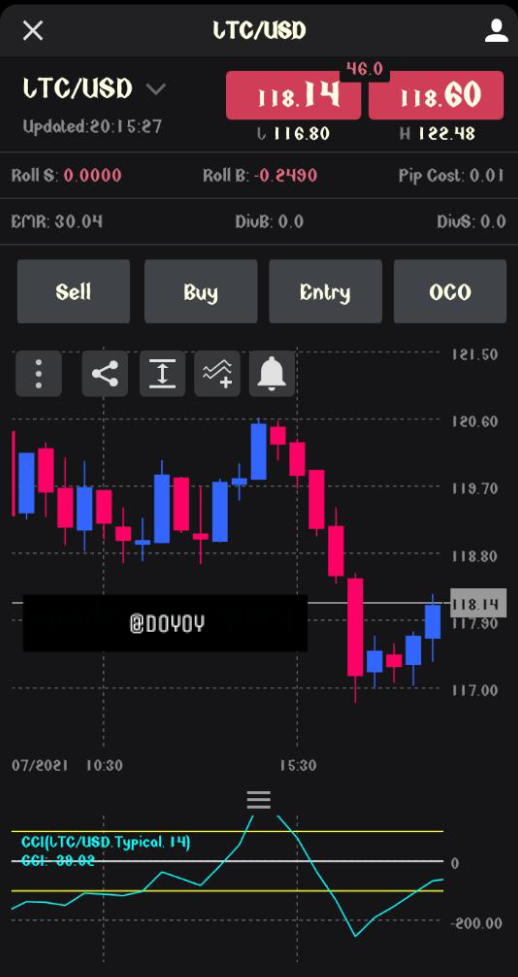
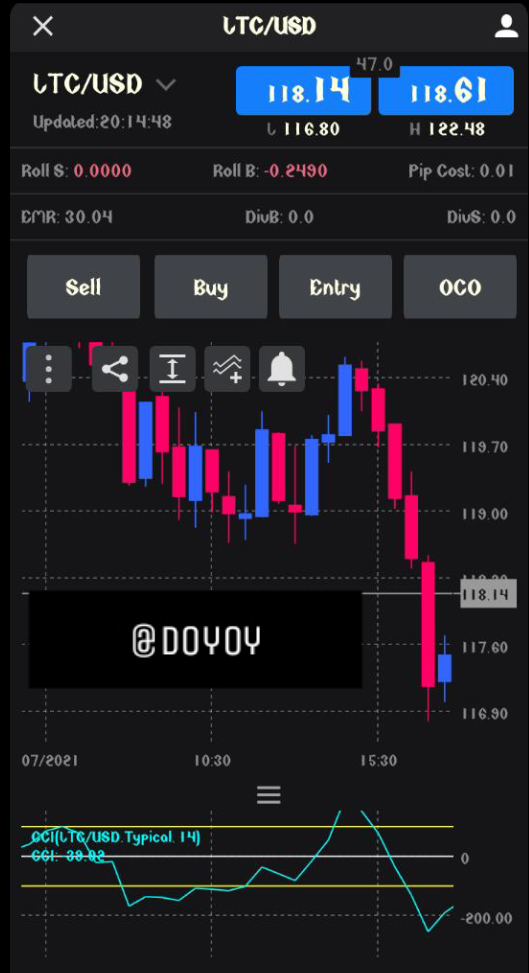
There is an oversold for the LTCUSD pair which signifies a reversal in the price of the asset. We need to wait for the reversal and for the line to go back into the width to enter the trade.
The line has gone into the width it is time to take a position. Just like my entry and exit strategy I will enter the buy position and set my stop loss just below the lowest value line and also I will set 2 take profits one at the zero level and the other at the highest level.
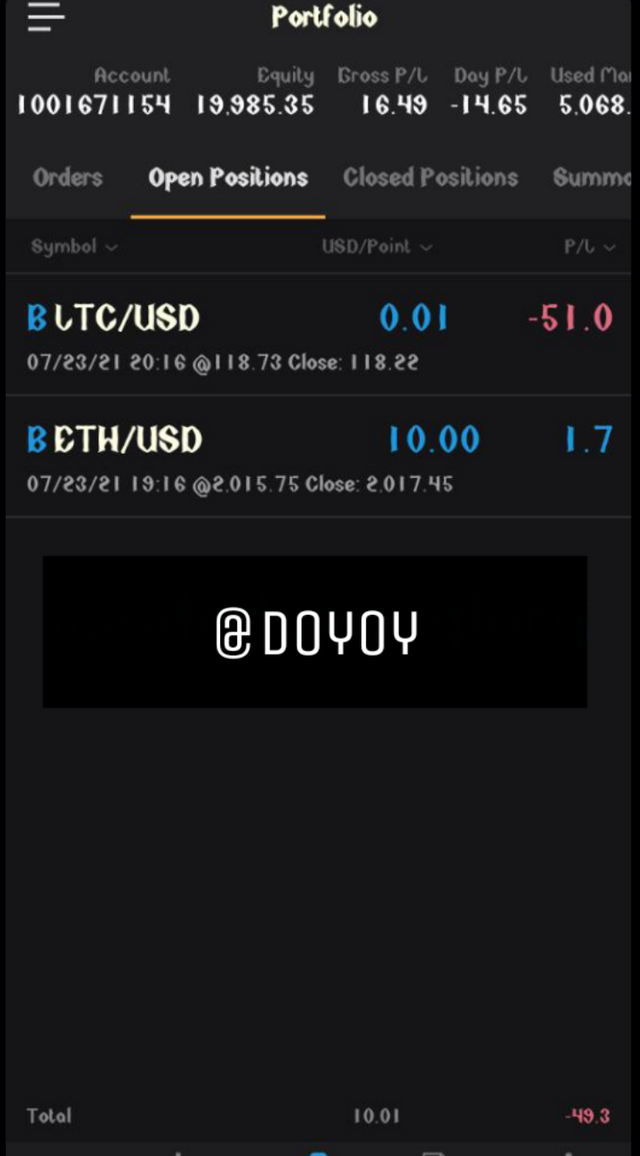
The screenshot below shows my current positions and how much profit and loss I am making at the moment. The position fit BTC is on profit while that of LTC is currently on loss but hasn't gone beyond my stop loss.
Trade management
My trade management strategy is the use and the way I set my stop loss and also the order of my take profit.
My stop loss is always set a little below the entry price and this follows the ratio of 1:2 which means if I enter a position if I am to take profit of $2 my loss will be at $1. Which means I am risking just $1 to be able to earn $2.
This way I ensure I don't run into too much loss and my profit also cover for my losses.
Also, I don't set a single take profit, I ensure to set 3 take profits this ways if atleast 2 take profit is executed I can always close the trade if I see there is about to be a turn in the market direction.
Hi @doyoy, thanks for performing the above task in the fourth week of Steemit Crypto Academy Season 3. The time and effort put into this work is appreciated. Hence, you have scored 5 out of 10. Here are the details:
Remarks:
Commendable effort but fair performance. You did well selecting the coins for this exercise. Also, your market entry and exit strategy as well as your trade management technique were okay.
Your work could have looked even better if you had attached a screenshot of your profit or loss. Again, thanks for participating in this task.
Downvoting a post can decrease pending rewards and make it less visible. Common reasons:
Submit