We have been learning about various technical indicators, we are here to learn about another one today which is called the stochastic oscillator.
This technical indicator is a popular tool among traders which is under the oscillating indicators. It helps to indicate overbought and oversold spots. It was first developed in the 1950s by George Lane. It tends to move around some average price level, since it's calculation is based on the asset price history.
Whenever the oscillator moves above 80 are considered to be in the overbought range and readings under 20 are considered to be in the oversold range.
This doesn't certainly mean there will be a reversal immediately as strong trends can be in the oversold and overbought range for a longer period.
Stochastic oscillator consists of two lines with one showing the actual value of the oscillator for each session and another one showing a three day moving average. Whenever the two lines crossed it is considered to be a reversal signal.
COMPONENTS OF THE STOCHASTIC OSSCILLATOR
The stochastic osscillator has two main components namely %K and %D.
%K line: this is the line which represents the stochastic, also this is also the fast moving average which moves faster than the other line.
The calculation is as follows.
%K line = 100 × ( C - L14)/(H14 - L14).
C= current closing price
L14= lowest price in the last fourteen days
Note: 14 was just used as an example, any value period can be used be it 9, 12 or 21.
%D line: This is the other moving average which is gotten from the same calculations of the %K line..
It is the slow moving average which has a lower period time frame. This line is the most important as it gives the signals for traders in conjunction with the %K line.
It can be a 3 period simple moving average.
% D line = 100 × ( C - L3)/(H3 - L3)
HOW DOES THE INDICATOR WORKS
As it has been stated above the range for the stochastic oscillator is between 0 to 100 and overbought is signified when the line is above 80 and oversold is signified when the line is at or below 20.
This can signify a reversal in the trend but this might stay longer than expected so we consider the intersection of the two moving average whenever they cross this shows that a reversal.is imminent.
Also when there is a divergence between the stochastic oscillator and trending price action this is also important as it signals reversal as well.
For example during a bullish trend and a higher high is sjwom on the chart but the indicator shows a lower high, this might be an indicator for a bearish trend reversal.
PARABOLIC SAR
Parabolic SAR is a technical indicator that was developed by J. Welles Wilder Jr. Which is used to determine the direction of an asset price as well as drawing attentions to when the price direction is about to change.
It is also known as stop and reverse hence the name SAR.
when activated on a chart it appears as a series of dots below or above the price candlestick. A dot below the candlestick shows a bullish signal while a dot above shows a bearish signal. When the dots flip to the opposite then it indicates a change in direction of the price.
For the Parabolic SAR to change from bullish to bearish the price of the asset must chnage from the upwards direction to a downward direction this also makes the Parabolic SAR to change direction, Also if the Parabolic SAR is to change from bearish to bullish the price of the assets must first chnage it's direction bearish direction to the bullish direction the Parabolic SAR will then change.
WAYS TO USE THE PARABOLIC SAR IN A TRADE
The parabolic SAR can be used in several ways in a trade, firstly it can be used to know which direction an asset price is moving towards in a trending market. It also helps to know where one can stop his or her stop loss. As the parabolic SAR moves a trader can set his or her stop loss at the first dot.
This indicator gives alot of force signal in a sideways movement, so as not to get a fake signal it is important for one to use the parabolic SAR whenever the market is trending.
HOW TO ADD THE STOCHASTIC OSCILLATOR ON A CHART
To know how to add the stochastic oscillator on a chart we will be using the trading view. We ought to have been familiar with the trading view platform, since that's what we use in doing our analysis.
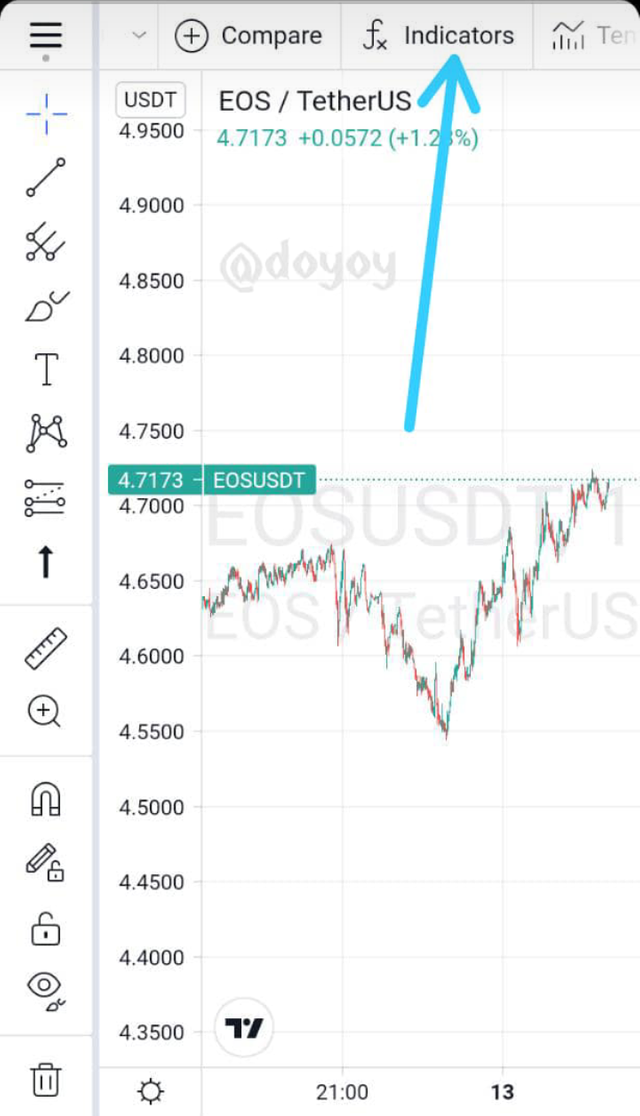
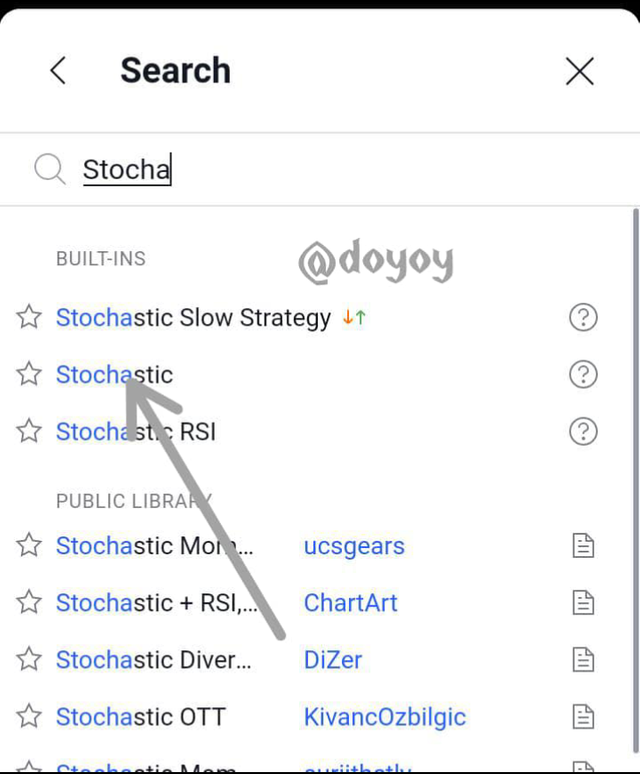
After getting to the chart interface and selecting the coin we want to trade with, we click on the indicator button and search for the stochastic on the search bar.
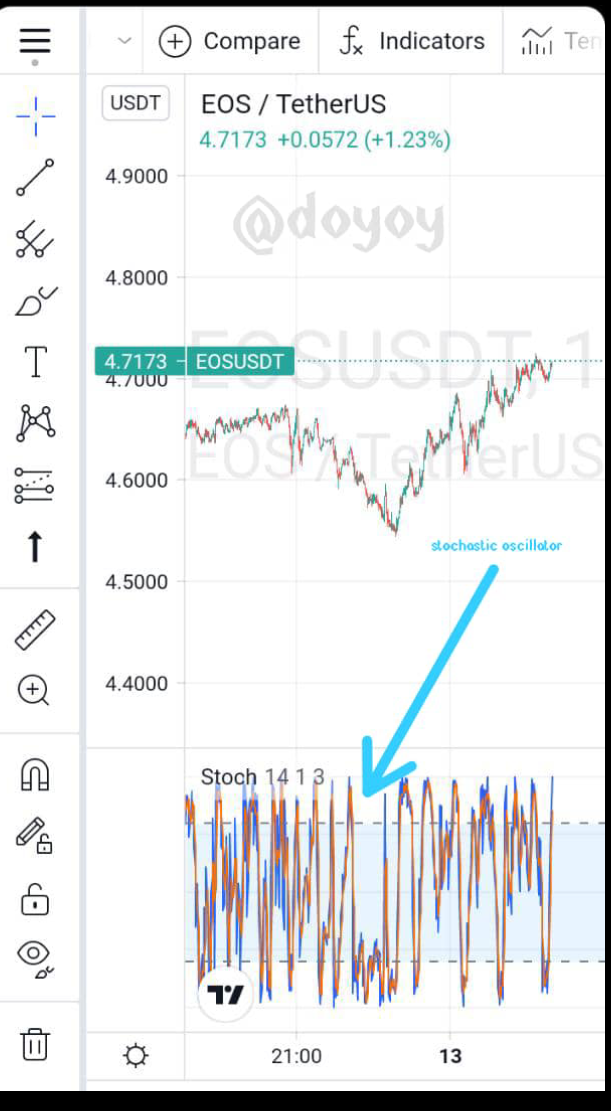
Various tool will be popped up then we select the one we want to use, the standard one is the scholastic which the arrow is pointing at. We select it, it will them appear on the chart.
After appearing we can then set the style and appearance of the indicator by double clicking on the indicator twice the settings panel will appear to you. The setting is standard already but you can modify it to whatever way you want.
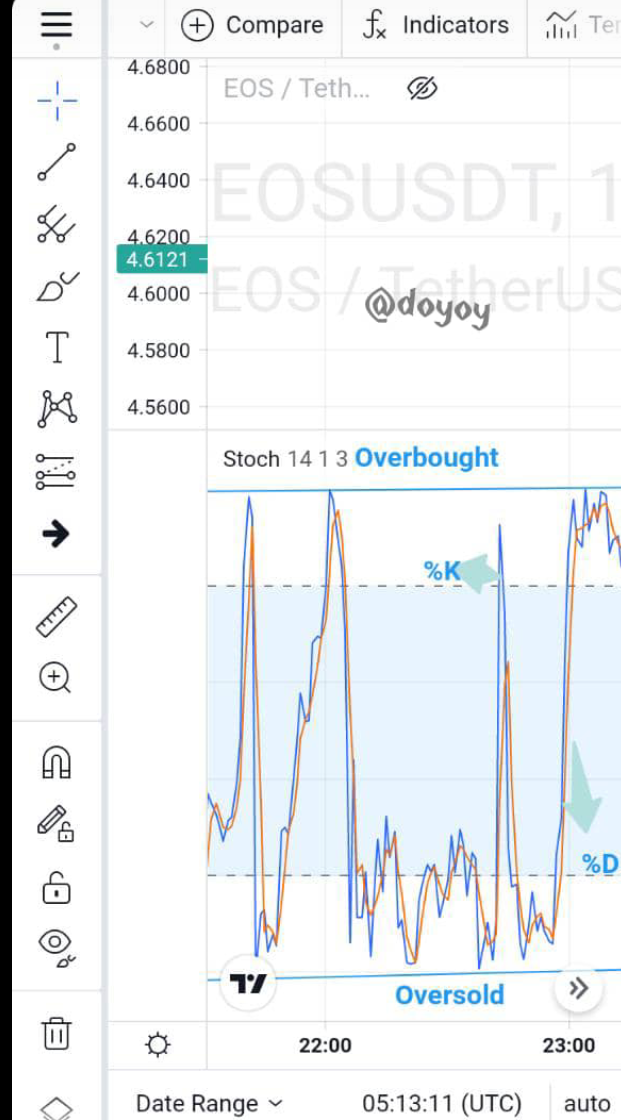
The blue line in the indicator is the %K line while the orange line is the %D line in the indicator. As explained above the fast moving average is the k line and the simple moving average is the D line.
As indicated in the screenshot above whenever the lines crosses the top dotted line it is in the overbought region while whenever it crosses the bottom dotted line it is in the oversold region. We can see that after every overbought or oversold there is always a reversal.
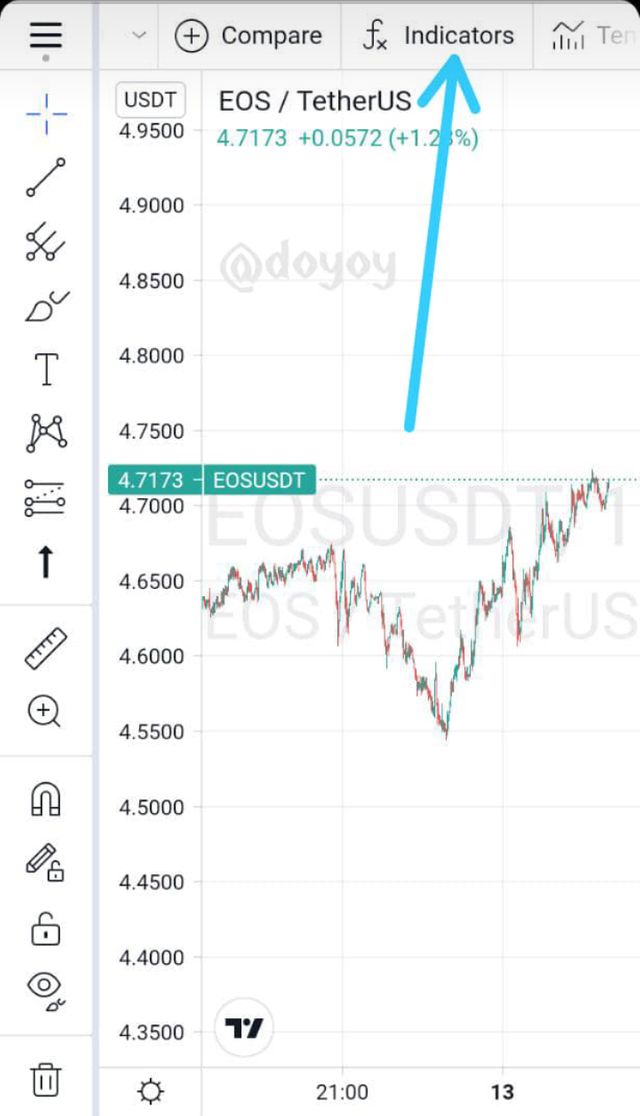
HOW TO ADD PARABOLIC SAR ON A CHART
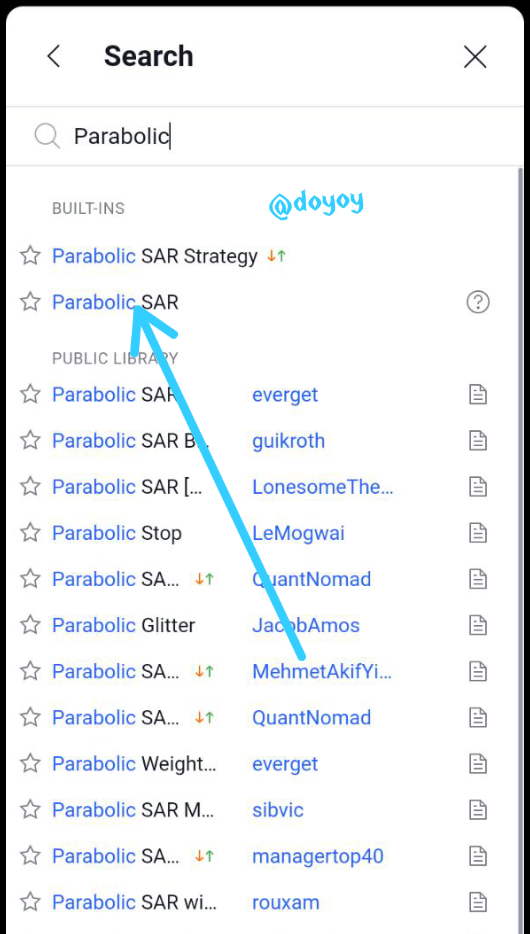
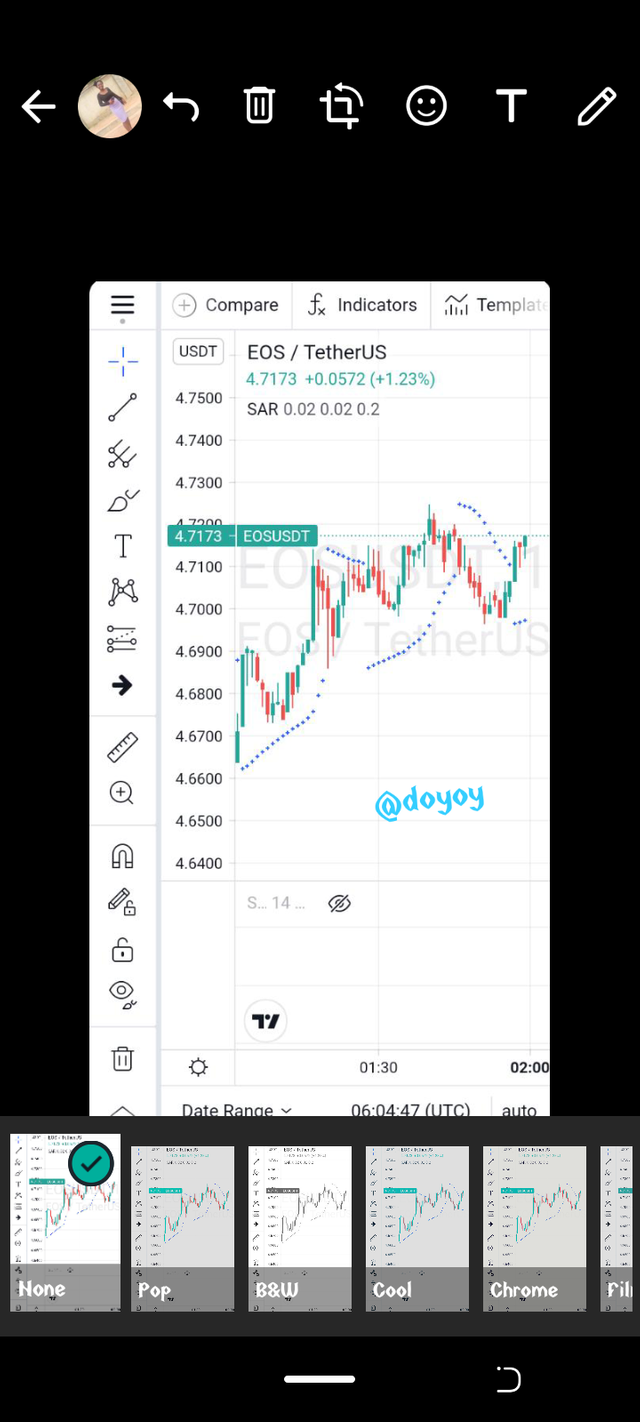
Just as we have explained above, adding indicators to chart is the same way. Firstly to add the parabolic indicator, we click indicator button and search for the parabolic SAR, when it pops up we click on the button it will then be added on the chart. When we see the dots on the chart it is certain the indicator has been added.
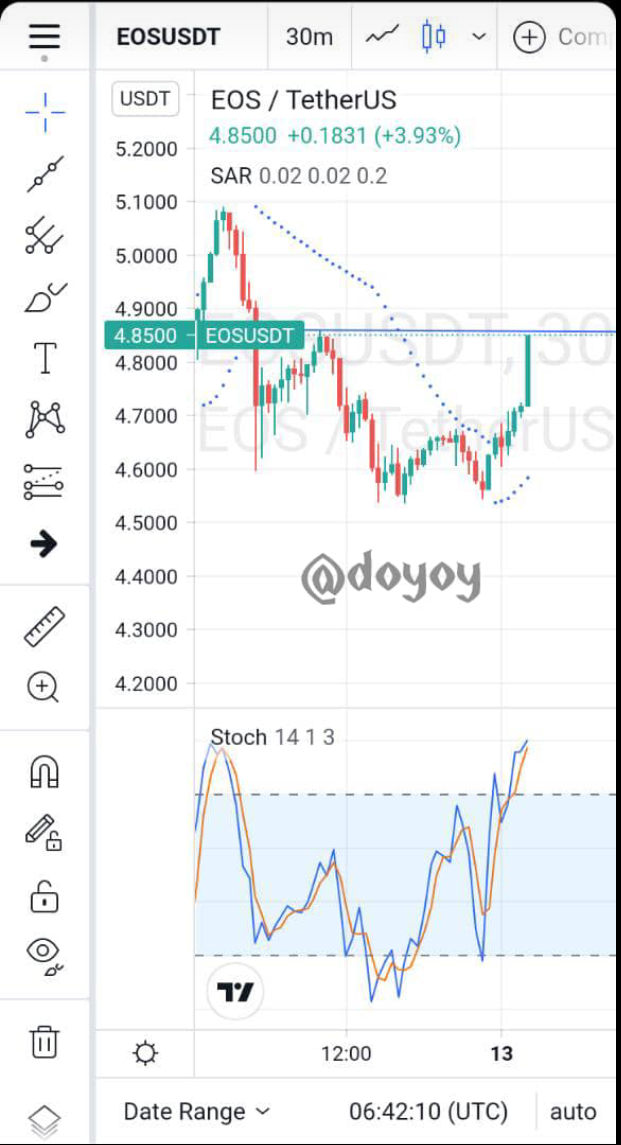
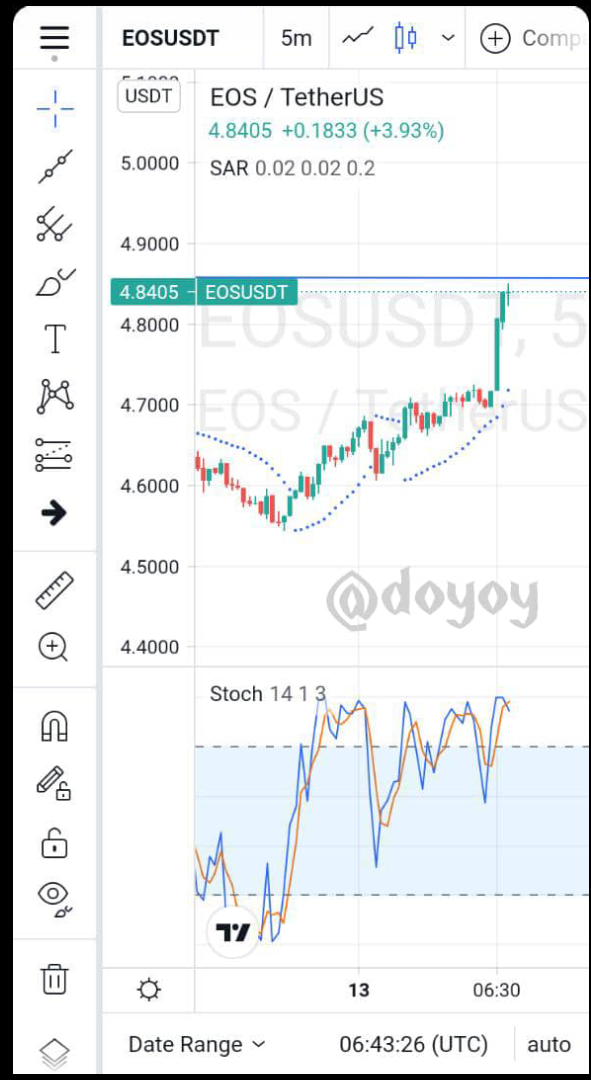
Whenever an uptrend is in play the dots is always under the candlestick and moves along with it also when there is a downtrend movement the dots are always at the top of the candlestick pointing downwards.
COMBINING PARABOLIC AND SCHOLASTIC INDICATOR TO PLACE A TRADE.
We will be placing a trade on an asset using both indicator to do our analysis. Since we have learnt how to add both indicator on our chart. We then add both indicator on the chart and we do our analysis on both indicator to know when to enter the trade and when to exit the trade.
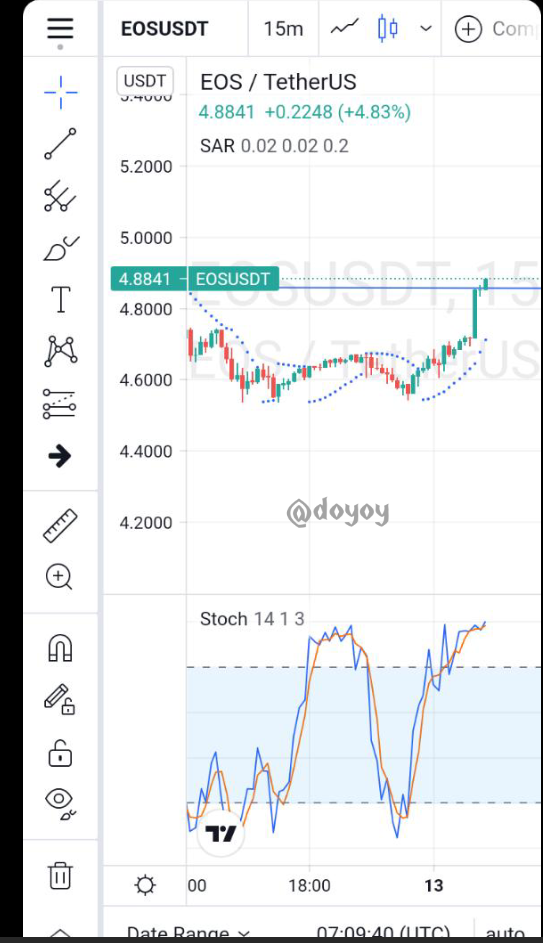

The screenshot above is a chart of EOS with a timeframe of 30 mins and 5 mins. According to the indicators set we can see that there is begining to be uptrend in the market after a fall in the price of the asset. The candlestick is approaching the last resistance and we hope for either a breakout or if there will be a reversal.
The scholastic indicator us showing an overbought but we don't know how long it will be in the region. With the use of the parabolic sar we can see that the uptrend is just getting started. To enter this trade we have to wait for either a breakout from the resistance line or a reversal before we enter the trade.
As we can see from the screenshot above a breakout has occurred and this is a perfect time to enter the trade to take a little profit from the movement. The second screenshot showed the profit taken from the trade. That's how to use both indicator in the market.