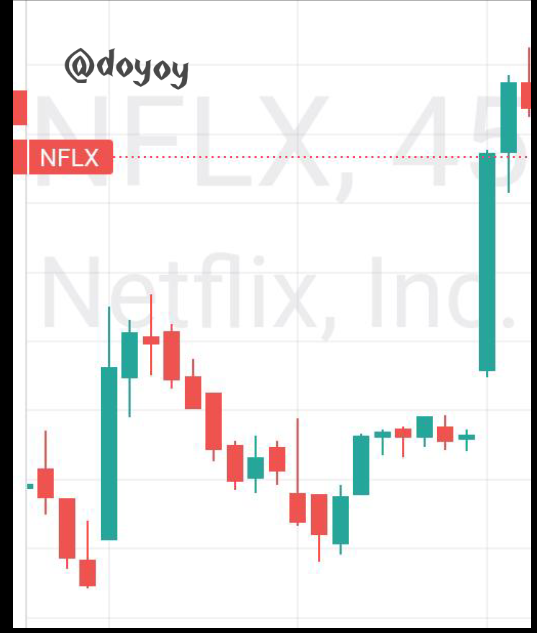
When we say something is weak or strong we are actually talking about the opposite of this two words. Weak means for something to lack strength, power or potency or have a limited power more than it is expected to have. While strong means for something to have enough strength, power and potency, it is very useful for the purpose which it is known for and this gives confidence in it.
Now that we have gotten the definition of weak and strong, let's quickly take a look at what a weak level is.
WEAK LEVEL
We have seen the definition of weak above, now when we talk about levels in crypto we are simply talking about the Resistance and support levels. A weak resistance and support level is one which isn't very solid to make the price of an asset reverse at that point. It is less reliable and this can cause a break in the level within a short period of time.
WEAK RESISTANCE
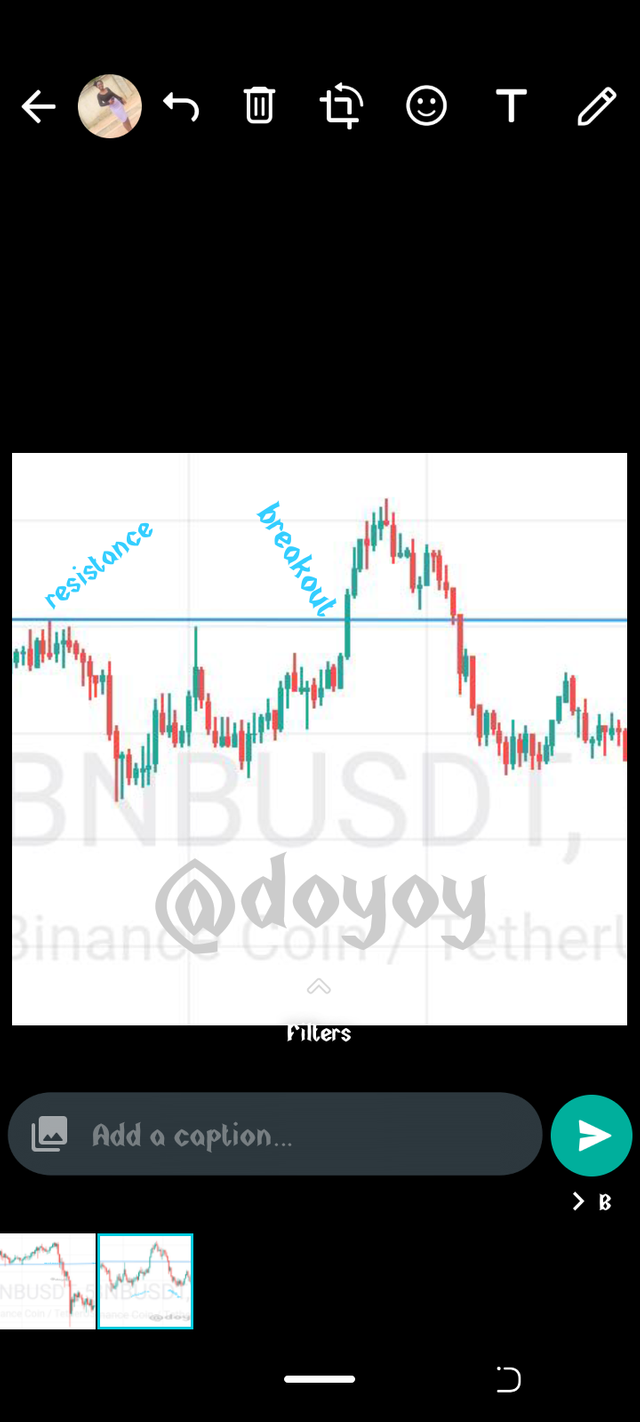
As we have defined a resistance as a spot at which a price reverses after getting to a particular price while the price is moving upward. A weak resistance reverses just once or maximum of twice at a point.
As seen in the screenshot above there was a resistance of the price at the line drawn about twice before there was a breakout in the market. This shows that this is a weak resistance and it has been broken as a resistance.
WEAK SUPPORT
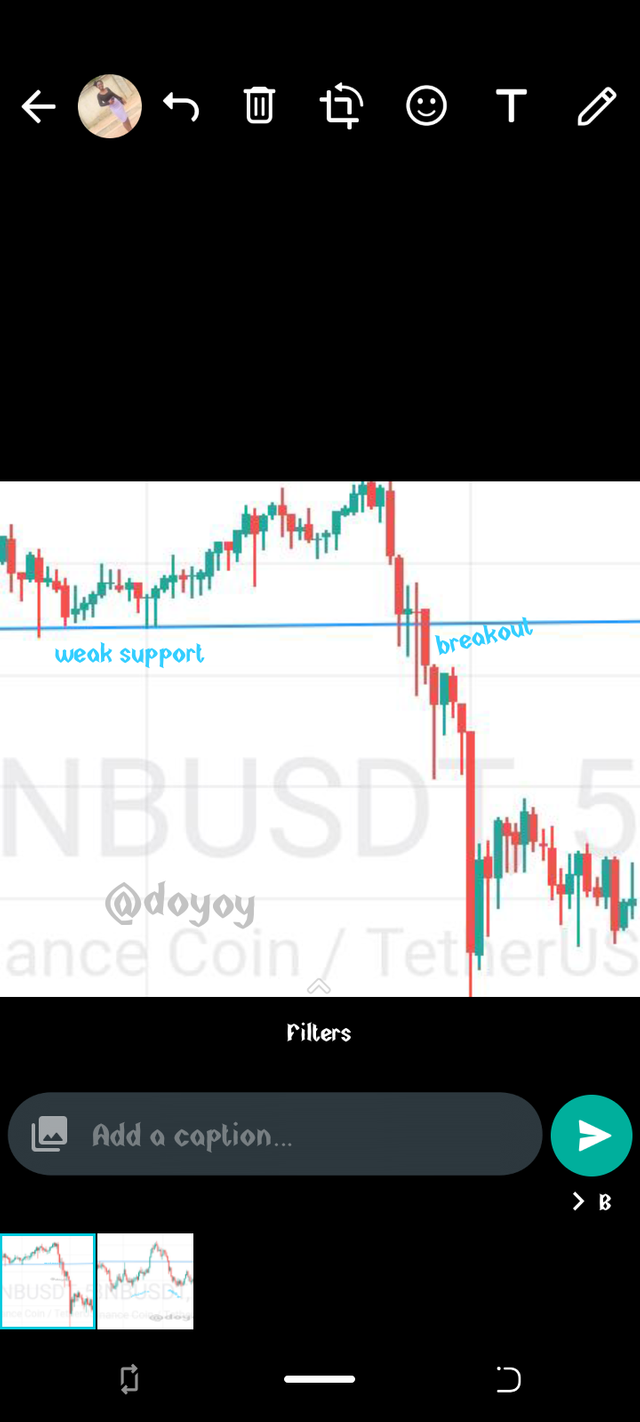
The support is a spot in which the price of an asset reverses after getting to a price when the price is falling. A weak support will reject the price of the asset at that price but the price will still find its way to breakout from that point after a trying once or twice.
A typical example is shown in the screenshot above where the price was rejected twice and then it broke the resistance to cause a dip in the price of the asset.
What actually happens in the market for this kind of situation to happen where we have a weak level is that, the levels are typically spots or marked price range where traders have placed a short or long trade in a limit order. In this condition not alot of trader has placed a trade at that point which makes the price try to reject at that point and soon breaks away from the level.
The resistance level is determined by how much sell order has been set at that particular price. The volume of the market actually determines if the level will remain which means that if there is more buyers than sellers.
STRONG LEVEL
Strong level refers to the strong support and resistance level formed on a chart by an asset. This level is one which is very solid and rooted and the price of an asset can't easily break pass it due to the power of the buying and selling occuring at the point. This levels are always retained for a longer period or time.
STRONG SUPPORT

The strong support level is a level that is not easily broken by an asset price after moving towards the downward direction in a particular time frame. As seen in the chart above the support level is always very solid whereby the price of the asset hits the spot highlighted multiple times without going below the highlighted point. This action shows a strong support.
STRONG RESISTANCE
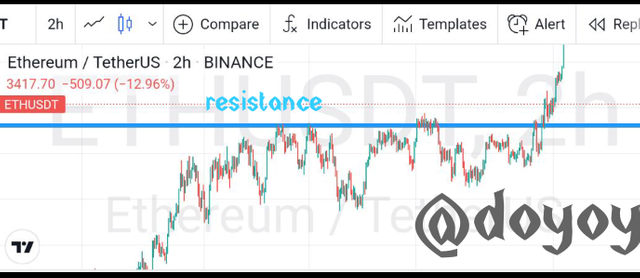
The strong resistance level is a level that can't be easily broken by the movement of a price asset after moving in an upward direction in a particular time frame. The chart above shows the resistance level where there was multiple times at which the price of the asset was reversed at a particular zone before we then had a major breakout from the zone.
The level proved solid after multiple hit on that zone.
In market wise what brings about a strong level is when alot of traders set a particular price at the same time to buy or sell an asset. There is always a high volume.in the market either in the bullish way or bearish trend. The price gets rejected at the level because once the price gets to that point alot of traders set trade will be executed immediately causing a set back in the price.
GAPS
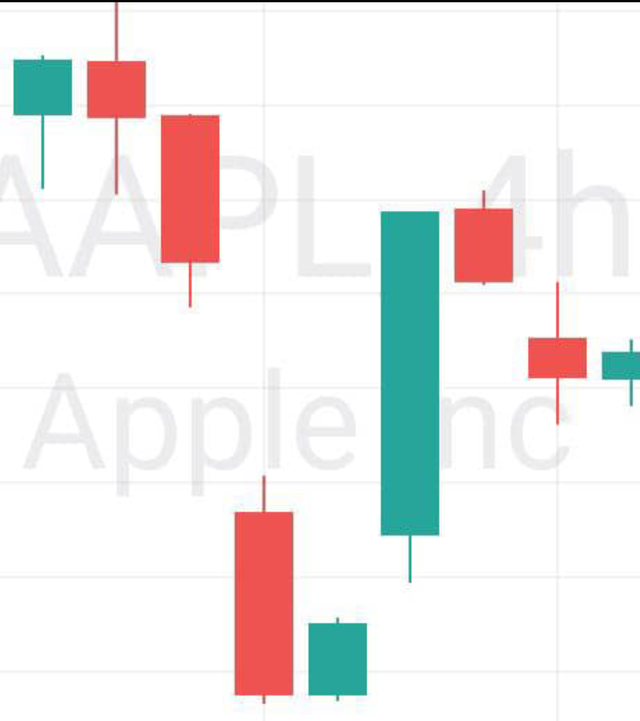
We hear the word gap in our everyday lives and we truly know what it means, while we were in school our teachers gives us task to do about filling the gap. Do we know that this gaps are also applicable in charts and can be used to the advantage of a trader if he or she reads them well.
A Gap is a space between two candles shown on a chart when the price of an asset moves greatly without any candle appearing in between the prior and newly formed candle.
Gaps doesn't happen Everytime but happens unexpectedly due to a fundamental or a technical factor. It basically happens when there is a great movement in the buying or selling of an asset which means there is a great volume of trade at that particular time. Below are some of the examples of a gap.
Exhaustion gaps
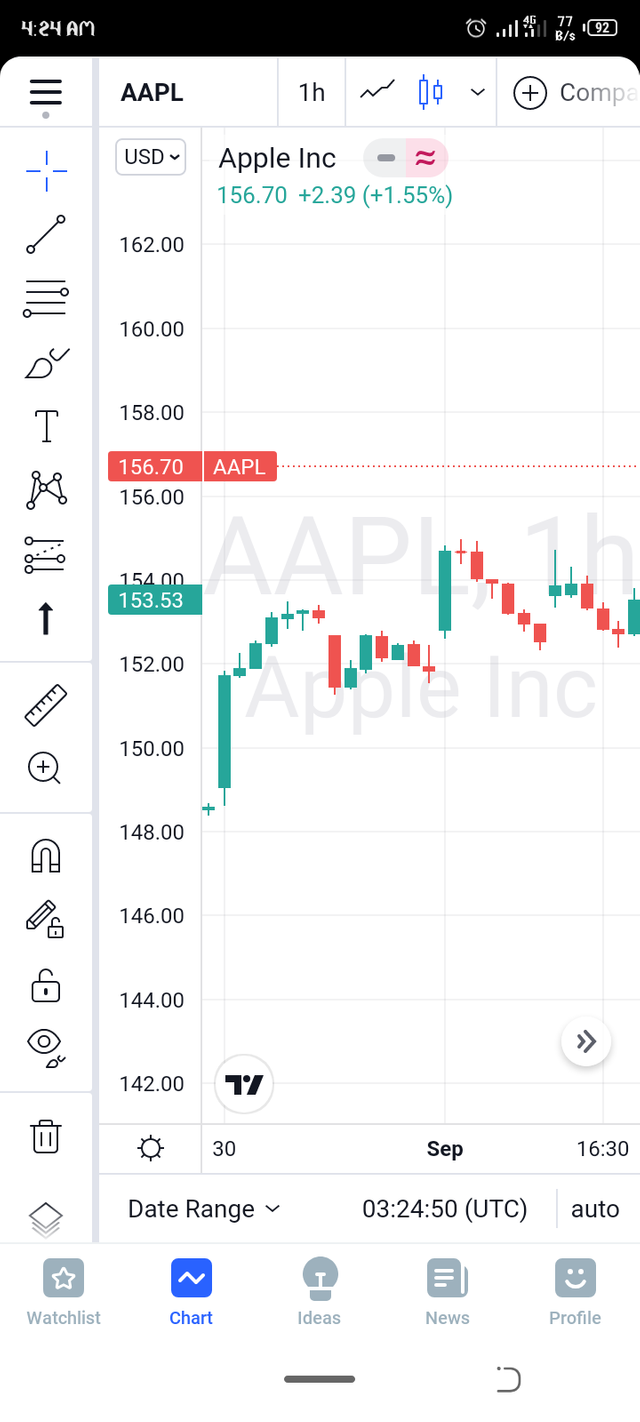
This are gaps that occurs towards the end of a change in price trend and signals a possible new highs or lows. This gaps are t easily identified as they are often mistakenly as the runaway gap. This kind of gaps are traded in the opposite direction.
Continuation gaps,
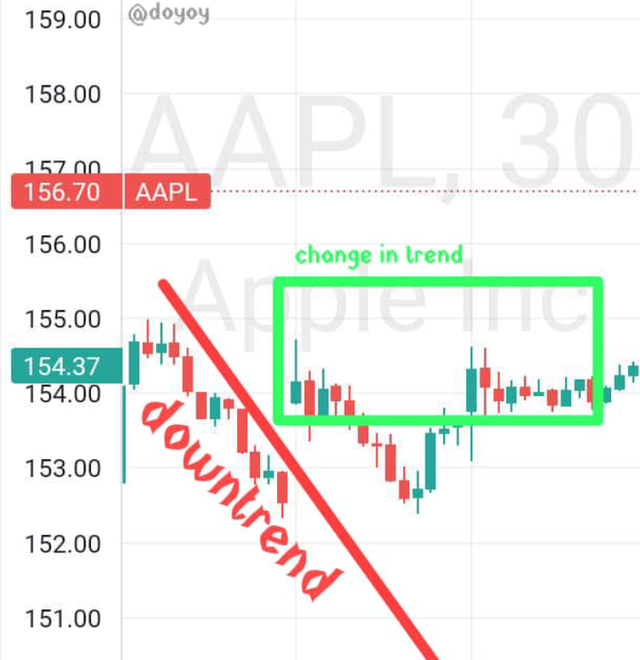
This kind.of gap.happensa at the middle.of a trend and signals that there is a higher volume.of Byers or sellers in that particular direction. This gap.is also known as runaway gaps and the price continues in the direction which it is going.
Breakaway Gap
This kind of gap occurs as a breakout from a previous trend to begin the start of a new trend. This indicates that a new trend will be starting and a new/strong support and resistance level will be set.
TRADING WITH A STRONG SUPPORT AND RESISTANCE LEVEL.
We will be placing a trade with our new learned lesson of support and resistance, to trade we first need to identify a very good support or resistance level of an asset and then wait for a retest or breakout to know when to enter the trade.
Below is a practical example of how to go about it.
First we go to our charting platform which I will be using the trading view as an example, we then try to identify a good support and resistance level of the asset.
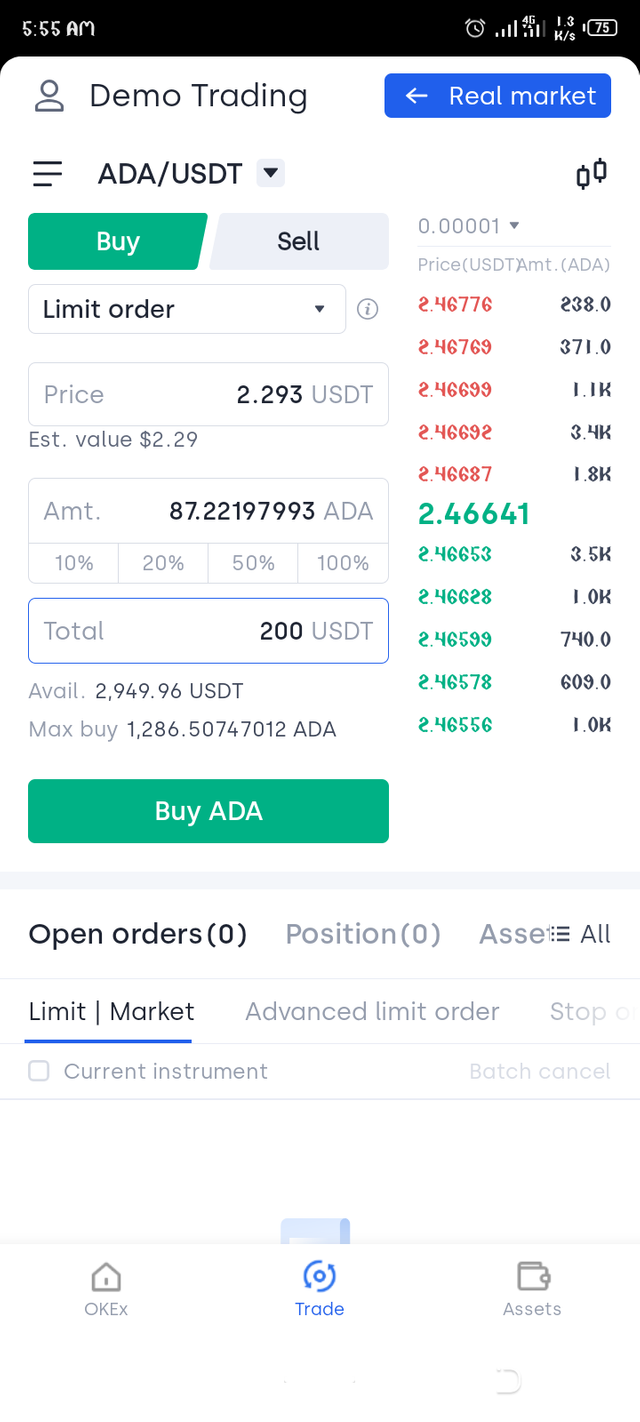
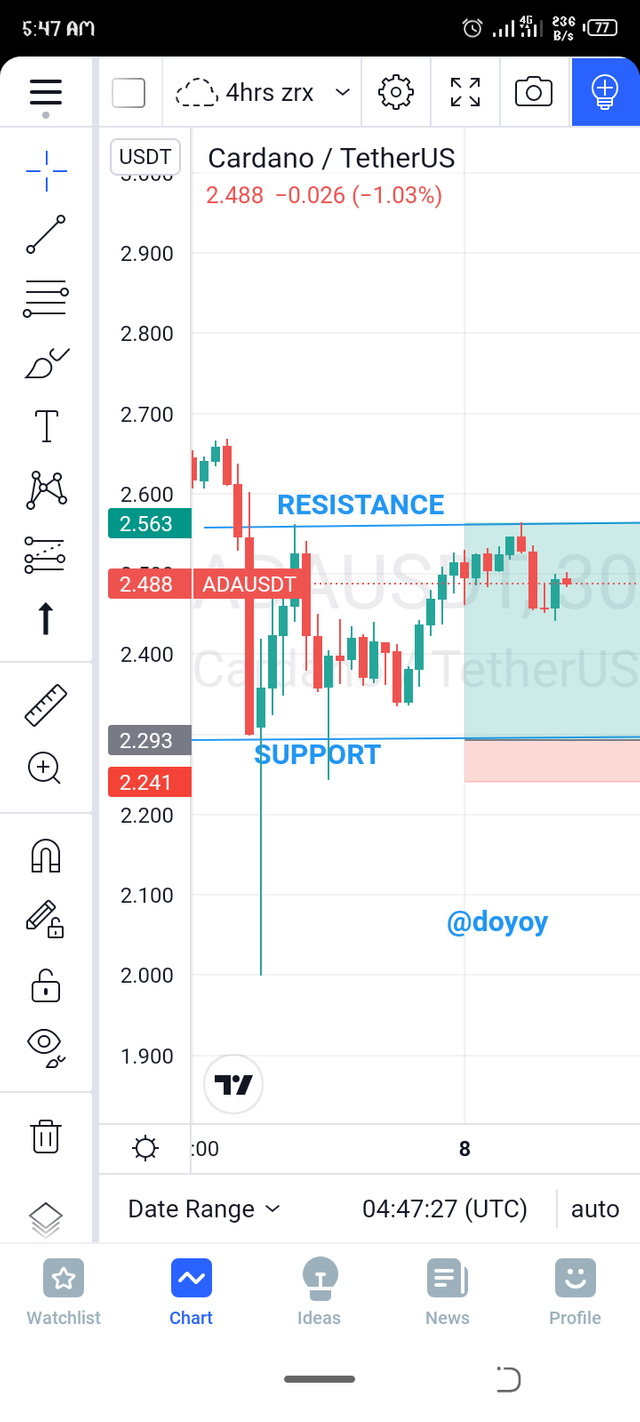
After the resistance and support line has been drawn we can then trade the asset based on the level drawn. This is a 30 mins chart for ADAUSDT and we are trying to go.long with the levels drawn.
There are two ways to go into this trade this is either waiting for the price to fall back to the support level and enter the trade or we set a limit order at the support price and set our stop loss. I will be making use of the second option. With the use of trading view we can draw an estimate of how the long position will go.
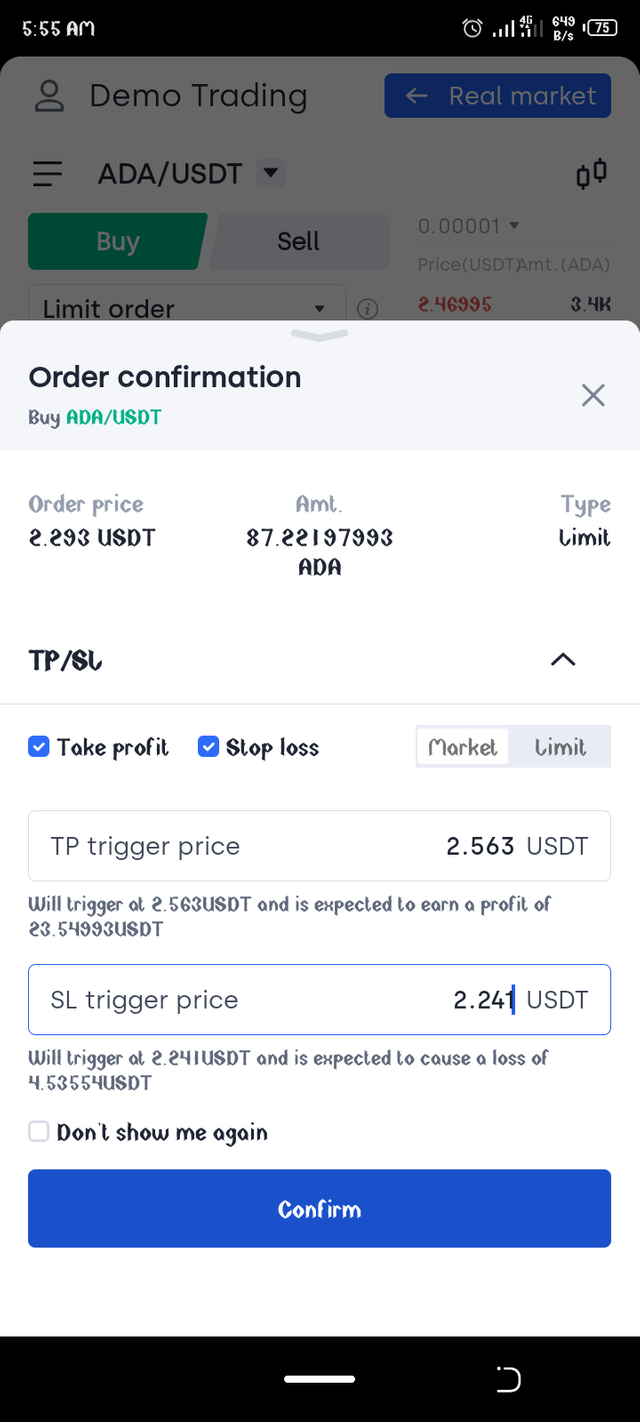
My open position is at the support level and the stop loss below the support level then my take profit is set at the resistance level. After this has been marked out on the chart we then move to the trading platform and input what we have to trade.
As shown in the screenshot above the details has been input in a limit order and as seen above the risk / reward ratio I used is 1:5 which means I will be risking $4 to get $23.
Also this can also be done in reversal for a short position.
Where a trader either waits for the price to reject at the resistance level and set that spot as his entry price and set the support level as the take profit point. This is how to make.use of a support and resistance level in a trade.
USING THE GAP FOR A TRADE
This is a break away gap and as explained we know this means there will be a continuation in the direction of the price. So to use this in trading we set our stop loss at the gap level. We can as well also wait for the price of the asset to retest at the level before entering the trade. This gives us a confirmation of the trade and reduces the risk of a fake out.
In conclusion both the support level and the gap are good technical analysis indicators that can help traders to get profits while trading and it's best using both together whenever trading.
