In order to make profit in crypto trading, it is necessary that one has a kind of plan or strategy to guide his or her actions. A good trading strategy Is the foundation or backbone of a successful trade. There are various strategies and technical indicators used for technical analysis before carrying out a trade and today , we will be Discussing about the Volume Weighted average Price (VWAP) indicator.
What is the VWAP indicator?
The VWAP indicators is one of many technical analytic tool used in crypto trading. Primarily, this indicator is used to track market trends and price using the volume fluctuations of the coin in question.
This indicator helps to detect the price of a coin at particular points in time by moving towards the direction of the price of the coin ; whether bearish or bullish. One feature that makes this indicator very special is the fact that it gives the same signal irrespective of the time frame being used or viewed .
The MA indicator and the VWAP share some similarities in that the indicators are plotted by a single line and passes through the candlesticks. Also , the VWAP indicator gives similar signal as the MA and the signal is interpreted in similar ways ; when the VWAP line crosses the price action and goes bellow it, we buy or enter into the market but we sell or exit when the VWAP line crosses the price action and goes above it. One major difference between the VWAP indicator and the moving Average( MA) is the way the VWAP is calculated.
The parameter needed to calculate the VWAP are :
Price of coin traded over a timeframe (P)
The coin volume traded (V)
Number of candlesticks per timeframe (N)
Combining ning the above parameters, VWAP = [P+V]/N
So to calculate the VWAP, We sum up the price of coin traded over a given timeframe and the volume of the coin traded and that sum is divided by the Number of candlestick of that same timeframe.
APPLYING ANSTRATEGY USING THE VWAP INDICATOR (SHOWING TWO INPUTS)
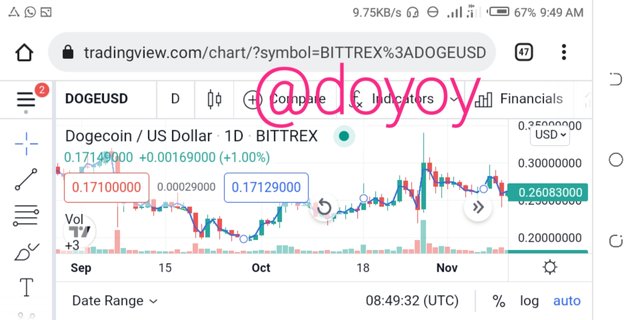
Before implementing any strategy, it is important that one firsts know to set up the the VWAP indicator on a chart. The steps to set up the VWAP indicator in a chart are discussed below:
- Log on to tradingview.com and launch the advanced chart of any coin air of your choice.
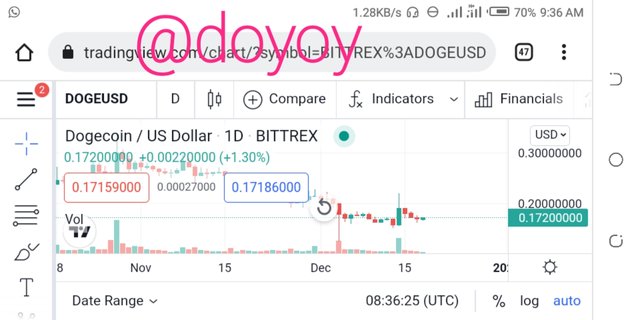
- Click on the FX indicator icon on the top of the chart
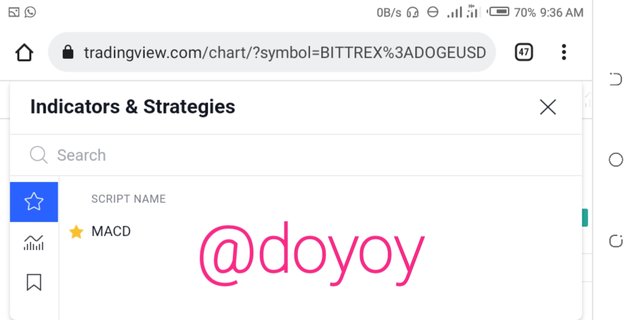
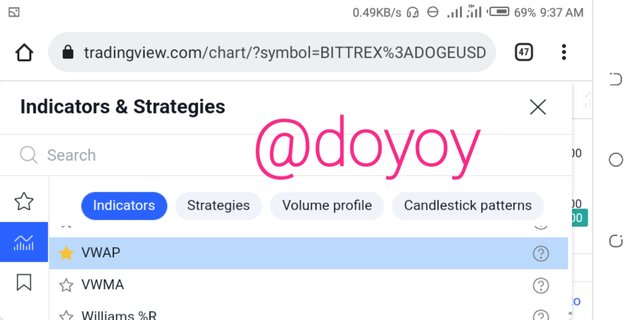
- Select 'built in ' and scroll to select the VWAP indicator.
- Go back to the chart and click on settings on the 'not very visible' VWAP indicator and uncheck the top and bottom lines.
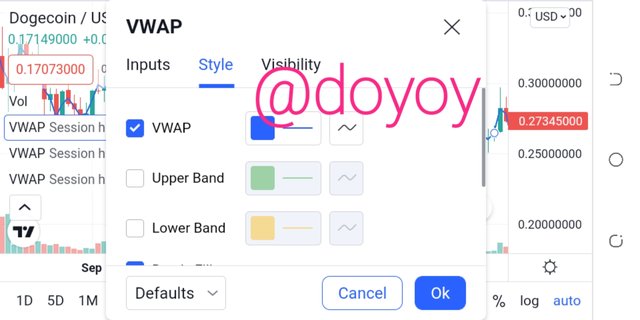
- Your V2AP indicator is now configured.
IMPLEMENTING THE STRATEGY WITH THE VWAP INDICATOR
After adding the indicator on the chart as explained above, the next step will be to implement a trading strategy using the VWAP indicator.
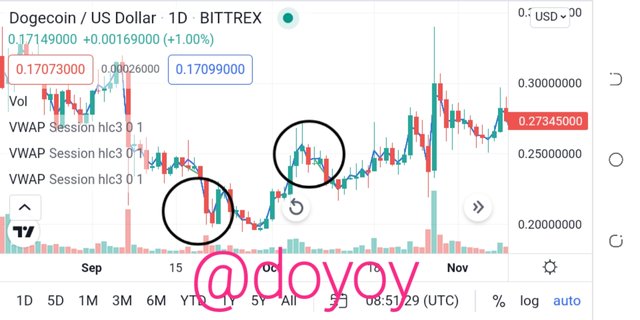
BULLISH AND BEARISH BREAK OF THE VWAP INDICATOR
Before trading using the VWAP indicator, we must wait for the current trend to be concluded. If the Break of the price action is after a bullish trend, then be place a sell order but if the break happens after a bearish trend, then we place a buy order. We need to endure that the VWAP I dictator breaks in the direction of the coin price before trading.
RETRACEMENT USING THE FIBONACCI RETRACEMENT TOOL
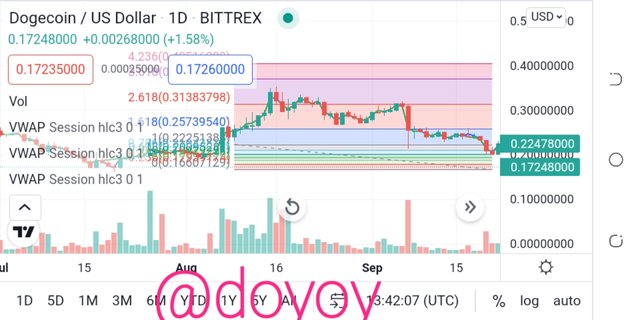
It is important that one know the momentum of the market or coin price at every given point from previously completed trends and analyse when a trend reversal is expected based on previous market behaviour. So the Fibonacci retracement helps the trader to adequately measure the market and the various support and resistance levels.
When the VWAP line breaks the price action, we should then consider the retracement using the Fibonacci retracement tool. We set our limits at 50% and 61.8% as the lines are closer to the price chart column .
Trade Management combining the VWAP and Fibonacci retracement
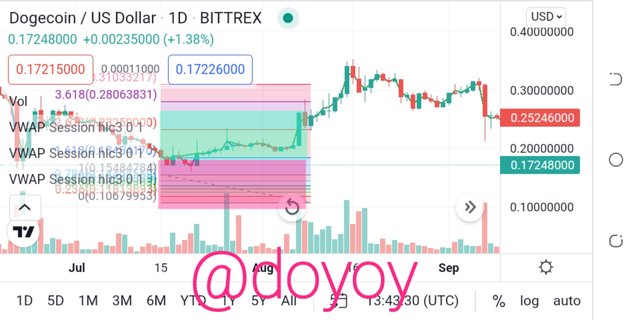
If the price of the coin in question; dogecoin is within 50% and 61.8%, for maximizing profit and minimizing losses, the stop loss should be set at the 61.8% mark and the take profit should be one and half times the set top loss.
TRADE ENTRY AND EXIT CONDITION TO IMPLEMENT THE STRATEGY WITH THE VWAP INDICATOR
Bellow are some conditions or criteria to consider when applying the VWAP strategy :
You enter the market when the structure is broken in either direction; bearish or bullish and when the trend reverses , you exit the market .
Also when the price is in the 50% and 61.8% range we can buy but when the price falls out of this range , then we should look out to exit our positions . Stop loss should always be set at the 61.8% mark and the take profit should be one and a half times the stop loss value .
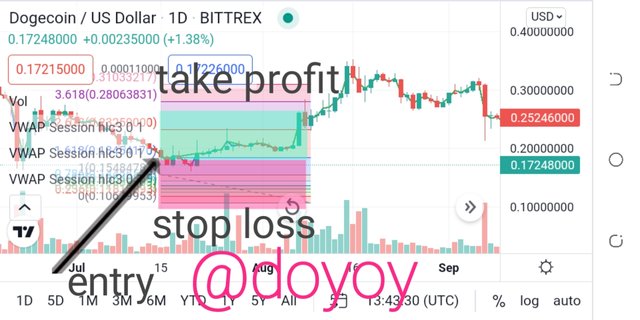
Make two trade entries ;a bearish and bullish one , using the VWAP trade strategy
Buy Order : before placing a buy Order , I ensure that the VWAP INDICATOR breaks the candle structure .
I also ensure that the price of the coin was within the 50% and 61.8% retracement levels and lastly I made sure my take profit price was one and a half times the stop loss.
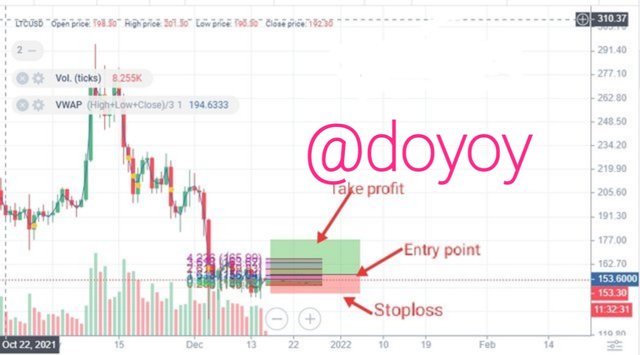
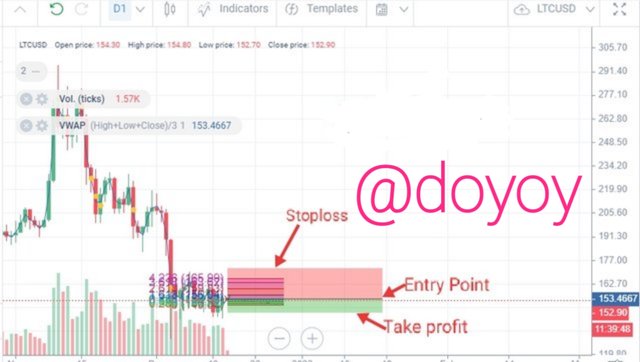
Sell order : Before placing th sell order , I ensure that the VWAP line is taken into consideration and sell just as the price breaks from the 50% and 61.8% range .
Conclusion
From my research in the course of writing this piece , I can say a trade strategy using the VWAP INDICATOR us a very efficient one as this indicator is very easy to analyse and the Combination with the Fibonacci retracement makes it even better and increases the chances of making profit by reducing the risk.