EMA BREAKOUT STRATEGY
Before engaging in any cryptocurrency trading , it is important that a trader has some kind of strategy or plan that will guide their trading activity like entering and exiting a market. Although the cryptocurrency space is very volatile , there is a certain degree of mastery that reduces the risks associated with it .
Before we go deep into the strategy proper , let us take a look at what the EMA is.
THE EMA
The EMA is a technical indicator and is an acronym for Exponential Moving Average . although this indicator is a lagging indicator , it is very helpful in telling the direction of the market at a particular time . the efficacy of this indicator is dependent on the time frame taken in to consideration , for instance , a EMA100 tends to give less false signals compared to an EMA of lower time frame like EMA 50. This indicator gives precedence to more recent trade date , hence its wide range of application.
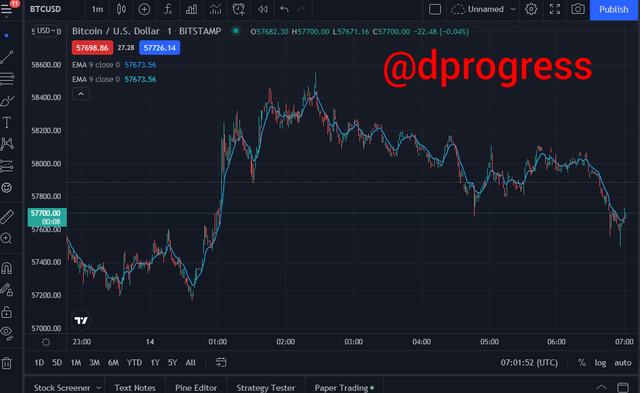
THE EMA STRATEGY: EMA100
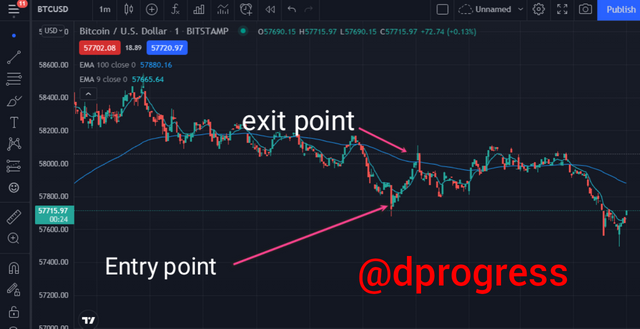
I will be making reference to this chart as I progress.
The 100 periods EMA was used in the above illustration and we can see that the EMA signal can be very beneficial in knowing the trend of the market and also how strong the trend is . How this affects our trade is that it aids in detecting a good point of entry ; which is when price is below the EMA signal line , and also a point of exit ; a point that price is above EMA signal line . one needs to set a stop loss at price equivalent to the previous low to avoid unpredicted loss.
Trend line
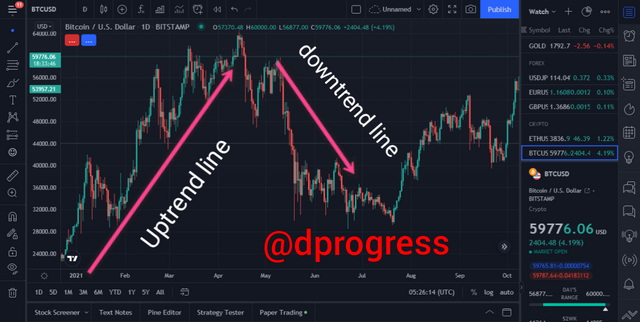
Trendline is a line drawn by a trader that connects the top and bottom candles of a chart to some extent desired by the trader . In the chart above , the trendline is going to be tweaked a little bit to complement the EMA in the above chart . When the trendline in the above chart is bearish and the EMA is bullish , at that particular point of convergence is a good entry point . Same thing holds when the price action is bullish and the EMA is bearish , it is important that the trader sets a resistance just above that point and sells his or her positions before a trend reversal occurs .
STEP BY STEP EXPLANATION ON IMPLEMENTING EMA + BREAKOUT STRATEGY
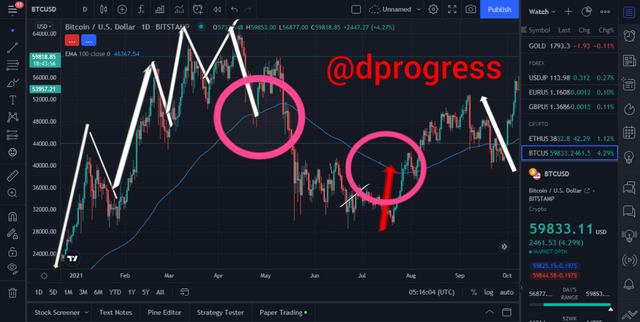
- Set up the EMA to 100 periods and as shown in the chart above , if the price action goes above the EMA line, then we are to look out for a point of exiting the market , consequently , if the price action falls below the EMA signal line , then that is an indication that we should start looking out for an entry point because a trend reversal is imminent.
- The impulses and the trend reversals are, most often than not, of close or equal magnitude so once the price action is above the EMA signal, one should begin to look out for the wave models and relate it to known models and wait see a model like the double top and bottom or the elliot wave before finally entering the market . Same thing can be said about the bearish trend also.
- The next and last step I would recommend is to draw a trendline that is against the main trend of the market ; like a retracement, and whenever the drawn trendline is bearish and confluences with the rising EMA signal, then that is a good point of entry into the market. Also when the reverse occurs; that is the drawn trend line is bullish and the EMA signal is falling and these events coincide, then that is good point of exiting the market.
ENTRY and EXIT Criteria
For every point that the bearish trendline converges with the upward signal of the EMA , that is a good point of entry. So I can enter a market at that point .
If the trendline drawn shows a bullish trend and it correlates to thee downward signal of the EMA , that is an indication that one should exit the market .
One should look for an entry point whenever the price action is above the EMA signal line. This is a very effective concept because the trade details of the market has been accumulated for 100 periods , EMA100. Also, the point of exit or support line should be somewhere below where the price action falls below the EMA signal line.
A demo trade showing the bearish and bullish EMA breakout strategy
BEARISH
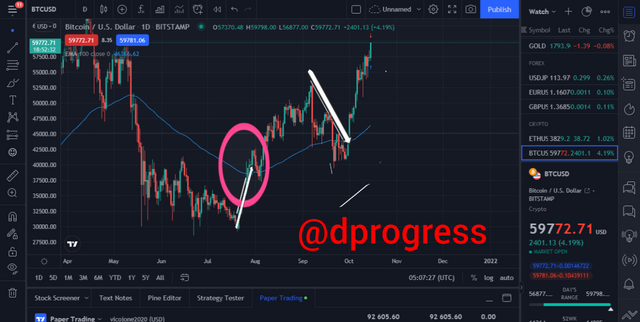
From the chart below, we can see that the once a downward EMA signal coincides with the bullish trend line, then a bearish trend is Imminet and one should look out for an exit point
BULLISH
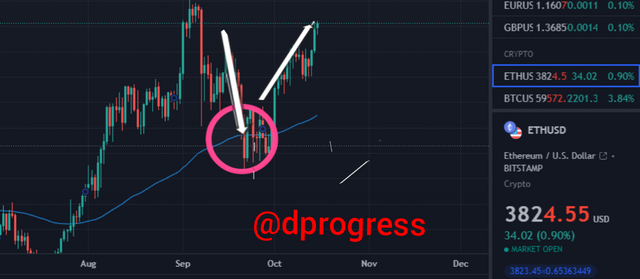
From the chart below, we can see that the once an upward EMA signal coincided with the bearish trend line, then a bullish trend is close by and one should look out for a point of entry into the market .
Conclusion
Although cryptocurrency trading is risky and volatile , it is possible to apply some strategy that will aid the trader in getting the most out of this volatile market and one of those strategy is the EMA Breakout strategy , the baseline of this strategy is that the price action and the EMA when combined gives some sort of predictability as was illustrated in the article.
@tipu curate
Downvoting a post can decrease pending rewards and make it less visible. Common reasons:
Submit
Upvoted 👌 (Mana: 4/7) Get profit votes with @tipU :)
Downvoting a post can decrease pending rewards and make it less visible. Common reasons:
Submit