Assalam-o-Alaikum! |
|---|
Hello friends! I'm @drcypto1 from #pakistan and I warmly welcome all of you to my post. I hope that you all will be fine and will be enjoying your lives. Today I'm going to participate in Steemit Crypto Academy contest in SteemitCryptoAcademy The topic is "Mastering Steem Market Volatility Using Bollinger Bands". Let's start the topic;

Explain the Components of Bollinger Bands |
|---|
Bollinger bands are the population technical analysis tools used to measure the market volatility and to identify the oversold or overbought conditions. Bollinger bands are the main tools used to find the trading signals within the market. These bands consist of three main components; the middle line which is also known as simple moving average (SMA) and two standard deviation bands located upper and below of the SMA. These two bands contract and expand according to price volatility within the market thus give us information about the behavior of the market.
Components of Bollinger bands and their roles:
As I mentioned above that in Bollinger bands there are three components. The middle line which is SMA is used to indicate the average price over a fixed period. The SMA allows the smooth fluctuations in the market while telling the overall trend of the price in the market. Upper and lower bands located the upper and lower side of SMA contract and expand according to market fluctuations telling us whether the market in overbought or oversold conditions. These bands tells us standard deviation that exists from SMA, trader can make a profitable actions while looking an eye on these bands.
Bollinger bands components:
There are three components of Bollinger bands which have been explained below:
1. Middle band (simple moving average):
Middle band or middle line is typically a 20-days simple moving average (SMA) of the assets price within the market. This middle band serves as base line for other two bands. The SMA smooth out the price fluctuations and tells us the overall price movement in the . market.
2. Upper band:
The upper band typically tells us about the resistance level of the price in market. It is calculated commonly by adding any certain number of standard deviation (the number commonly taken is the set of 2) in middle line. This band represents the overbought conditions in the market. The formula is written as
3. Lower band:
Lower band indicates the support level for a specific coin in the market. It is calculated as subtracting the same number of standard deviation from middle line. Lower band tells us the overbought condition of the token in . market. The formula is written as
Bollinger bands are very effective tool used to indicate the market trend. These bands are versatile and can be combined with other indicators for more comprehensive trading strategies.
Analyzing Market Conditions with Bollinger Bands |
|---|
In steem/usdt chart given below this is an evidence that market has different volatilities over a period of time. Currently the steem is trading at the price of 0.1622. In the very first chart, after seeing the data of market volatility we can analyze that market will show an uptrend until it reaches it's resistance level.
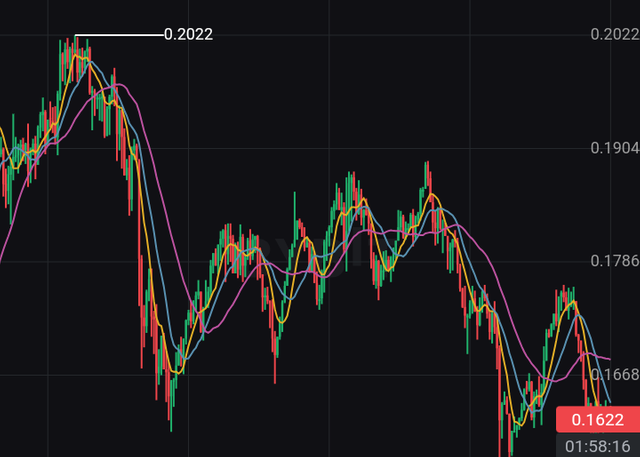
The narrow bands indicates low volatility and we see that steem was trading between 0.22 in middle of this year. On relying the previous data of steem it is aiming it will gain high potential with a week.
Beside this looking the chart steem we can see that steem price is between 0.1469 to 0.1775 mean the peak support level is at 0.1469 and peak resistance level at 0.1775. From previous some days steem is trading between this range. Seeing it's support and resistance levels, it shows that steem is very sensitive to market trend nowadays.
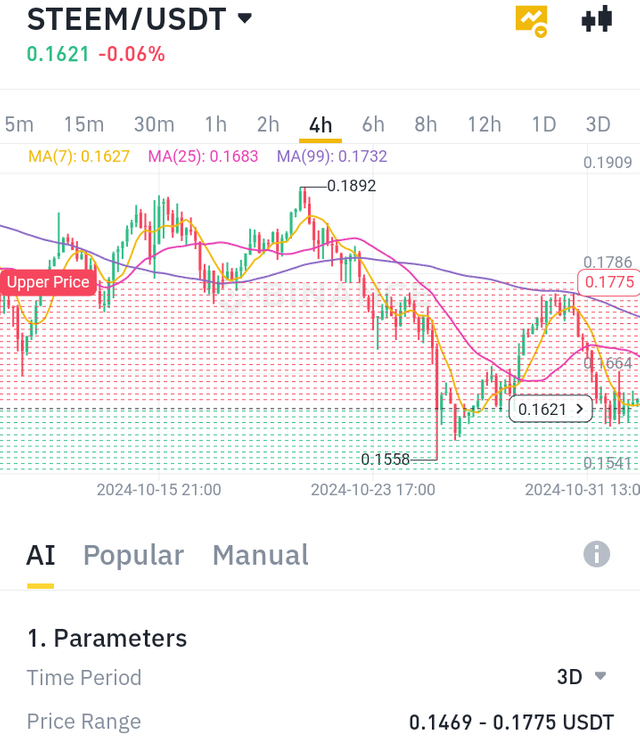
Now for for getting depth analysis we can combine the relative strength index with Bollinger bands. When the buying pressure increased (reached above 70 RSI), it decreased to low trend. When steem trade between 30 to 70, it shows normal fluctuations in the market.
Moving forward if steem breaks the current resistance level which is 0.1928 (at upper band). It will show high potential of uptrend in it's price may be increased upto 0.35$ until the end of this year.
Is market in oversold or overbought condition?
According to charts given up, the market slightly neutral nowadays as well as slightly oversold according to RSI. The current RSI is 43.5 which shows it is neutral. Typically the RSI above 70 shows steem is in overbought condition and will show downtrend. And RSI below 30 shows oversold condition and market will be in uptrend soon. But between 40 to 70 RSI market is considered as neutral, mean is not showing high potential gain or loss.
Identifying Volatility Patterns with Bollinger Bands |
|---|
Bollinger bands are very effective tools which tells us about the potential of market volatility. They consist of three bands:
1. Middle band: This is the typically simple moving average of the price in the market.
2. Upper band: This band is usually the sum of standard deviation in middle band (standard deviation usually taken 2)
3. Lower band: This is the substraction of standard deviation (usually taken 2) from the middle band.
The space between upper and lower bands tells us the market condition. When these bands are far to each other it means market is in high volatility and when these bands are close, it indicate the low volatility of the market.
How Bollinger bands indicates market volatility:
1. Expansion of the band:
When the Bollinger bands are widen, they indicate the high volatility in the market. This is usually happens when there's strong movement of price either upward of downward direction. According to an expansion, it is suggested that with significant price movement in one direction, there's strong potential breakout in market volatility.
2. Contraction of bands:
When Bollinger bands are closer to each other, they indicate the less volatility in the market. Usually, this happens when price is going to stabilize or moving sideways. This contraction of bands shows indicate that market is becoming ready for big price movement as it build up pressure.
Real example from steem/usdt chart:
Let's look at historical data from steem/usdt chart that how Bollinger bands work in real situation.
• Period of contraction:
From September 8 to September 11 2024 the price of steem was relatively stable fluctuating between 0.1698$ to 0.1741$. During this period the Bollinger bands were narrow indicate the less market volatility. These contraction of bands is very essential and traders look this contraction after this contraction market is getting ready for breakout either in lower or upper direction. And we see that after that breakout steem price increase upto 0.21$ till the mid of October.
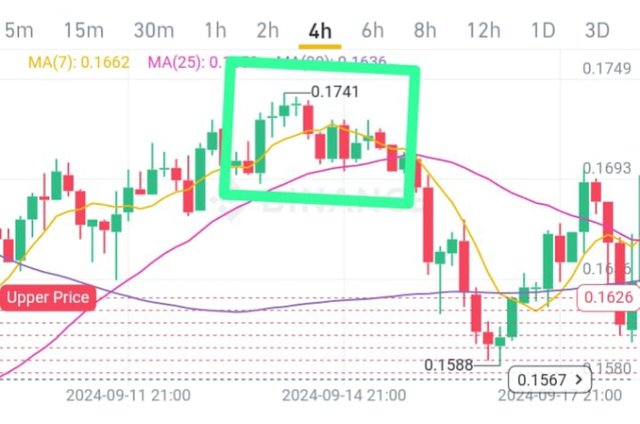
• Subsequent expansion of bands:
And than I discussed above in the last week of September the price of steem jumped and reached at 0.21$ in October. This was the results of breakout after the contraction of Bollinger bands. And when the price rises these bands expanded significantly, indicating the high volatility of the market. This expansion showed the strong buying pressure in the market indicating solid uptrend of steem price.
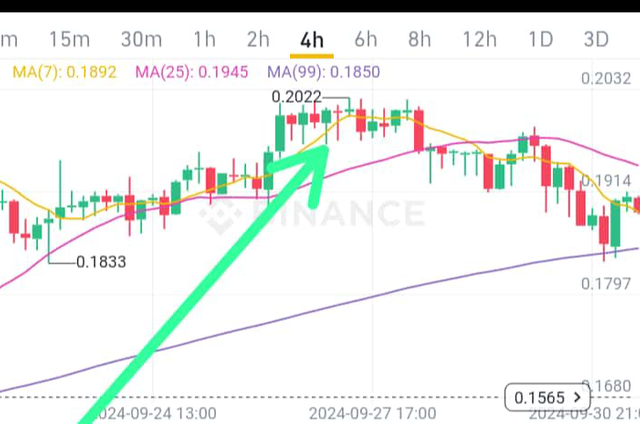
Why this matters?
Understanding the contraction and expansion of Bollinger bands is very important as it helps traders to take useful decisions for trading. For example if these bands are in contracting phase this means that it is the time to enter a trade. Because it is very near to happening of potential gain after this contraction. If these bands are expanded than it is the time to take profits because after this market can fluctuate and can be in downtrend soon.
Developing a Trading Strategy with Bollinger Bands |
|---|
As we have discussed above that the contraction and expansion of Bollinger bands tells the market volatility. I will develop my trade by looking an eye on these bands. My trading strategy will be:
My strategy details:
For making a trade of steem token I will see the historical data of steem/usdt chart focusing on that how can I enter or exit my trade with interaction to Bollinger bands.
1. View of Bollinger bands:
Before starting my trade I will calculate the simple moving average (SMA) for last 20 days of the steem token. Than relate the SMA with upper and lower bands using standard deviation. I will use hypothetical values (which I have mentioned in first section) for calculating my data:
Let's suppose
• The 20 day SMA of steem token is about 0.1829.
• The upper band could be around 0.1940 (0.1829+ 2×0.0045)
• The lower band might be 0.1715 (0.1829 - 2×0.0045)
2. Entry point:
I will enter my trade when;
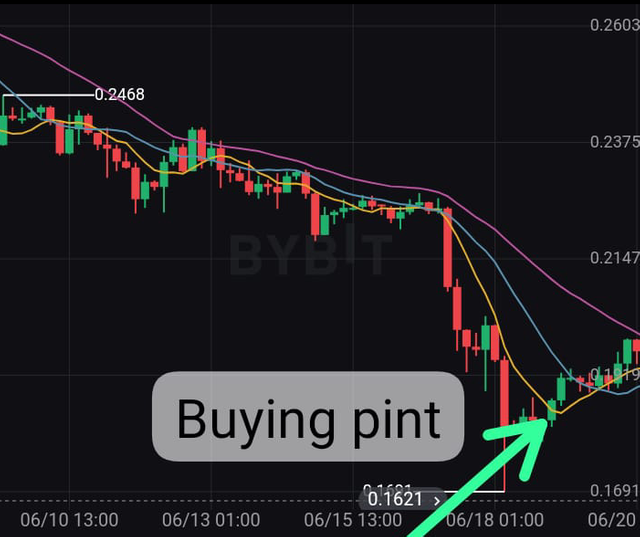
• Price touches the lower bnad, this is the signal that the specific has been oversold and now it's the time of entering a trade. For example on 27/10/2024 the price of steem was about 0.1688 which was close to lower band. According to my strategy this would be the buying stage for me as price may be bounce upward towards middle band.
3. Exit point:
I will exit my trade when;
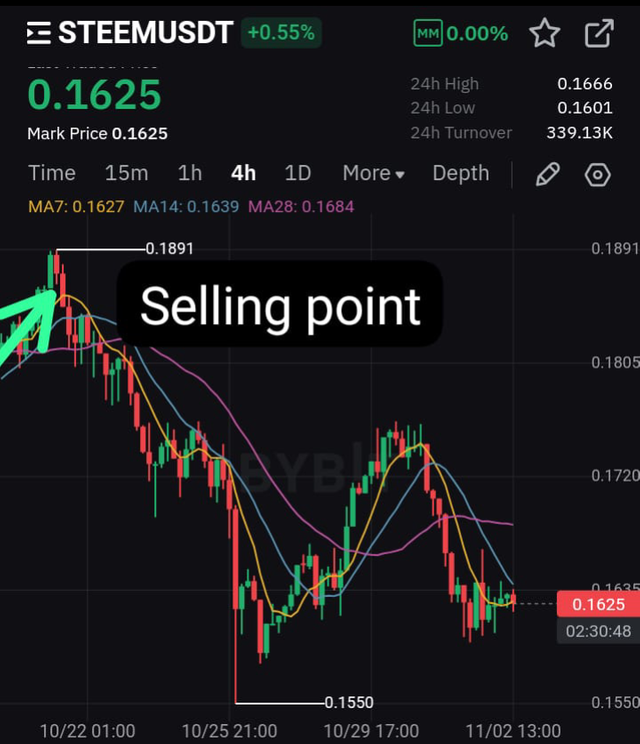
• The price touches to upper band. For example when the price reaches to about 0.19 I will close my trade and will take my profit because according to my strategy this will the end point at upper band and price may fluctuate towards downward from this point. At the upper band, this is the indication that token has been overbought that's why I will close my trade and take my profit.
An example from steem/usdt chart using recent data:
Now I give an example from steem/usdt chart using recent data that how mu strategy will work:
• on 10/27/2024 the price of steem was 0.1688$. It is near the lower band according to my strategic plan and near this price, it will the pint of buying this token for me. Look chart given above
• on 10/30/2024 if the price of steem increases upto 0.1920$ than it the exit potn for me. If I had bought this coin on 27/10 now I will sell these tokens and gain my profit. Look the chart below:
Additional strategies:
Beside this I will took an eye on main two turning points of the market which is
Trading volume: I will attention to trading volume of steem token. If the token is trading with high volume with touching the lower band I will buy this token and if it is trading with low volume while touching upper band, it will the selling point for me.
Stop loss: For managing my risk I will set the stop loss price which I can bear from my overall portfolio. Might be at 0.1655$, I will set stop loss so that trade automatically stop when the market goes against to my strategies.
Predicting Price Movements with Bollinger Bands |
|---|
In order to predict the price movements of steem/usdt chart using Bollinger bands we look at the probable price volatility and it's expectations of price swings in the market. Let's make a prediction:
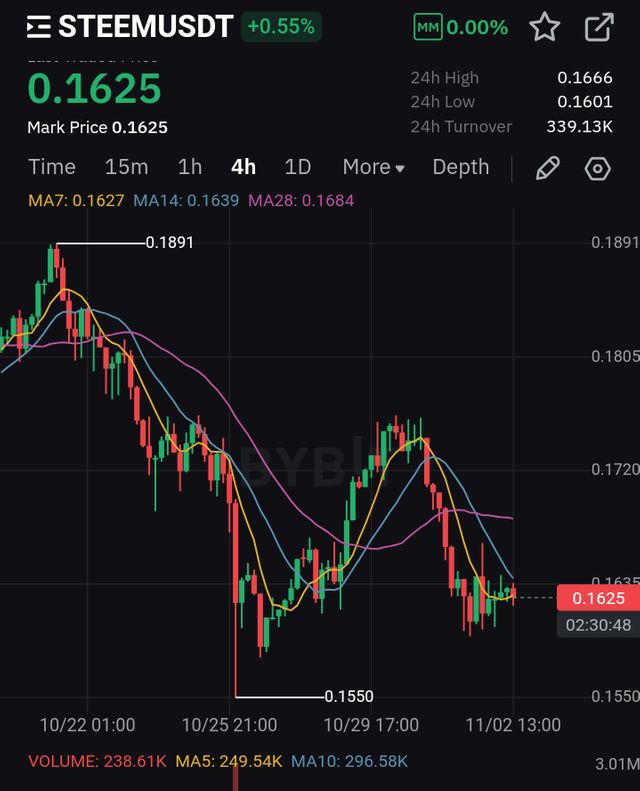
Current price: The current price of steem is 0.1628 with 0.68% increase. Looking four hours chart of steem/usdt, steem go 0.1666 all time high and 0.1605 all time low with trading volume of 348.5k in the market. The market trend is showing that steem price is in downtrend now and when it will reache at it's support level which is 0.1605, it will show bullish trend.
1. Middle band as moving average:
Middle band play role of simple moving average in the market. If the price of steem in steem/usdt chart goes upto 0.1762 as shown in above chart, than it can be the first resistance level for steem price. But if the price increase upward from this first resistance level and hold above the resistance level, this is the indication of upward trend towards the upper band.
2. Resistance level:
If the upper band stands at 0.1891, if the price moves towards this level, in this situation it may face resistance. The strong buy pressure of steem token indicates the bullish trend above the upper band in the market but on the other hand if fails breaks may lead the the market towards downtrend or bearish continuation.
3. Volatility insights:
Bollinger bands are closed to each and tightened lately which indicates that market show low volatility. The results may be interpreted as market will move in a great potential either in down or upward direction. Traders can look this movement for high potential gain or breakdown in the market.
In summary the current price of steem is 0.1628, support level is at 0.1605 (lower band) and when the price reaches to 0.1763 which is first resistance level (at middle band) it faces some resistance. But if the market shows uptrend movement and reached it's peak resistance which 0.1891 (at upper band) it will show breakout in movement. As bands are tightened, that's why market will show a potential gain or loss in it's volatility.