Hello friends how are you doing, i am good. Today I am here to participate in another challenge and try to explain it up to my best knowledge hence the topic is Steemit Crypto Academy Contest / S15W4 - Death Cross Vs Golden Cross.
[source](edited in canva)
Question 1: Explain in your own words, what is the golden crossing and what is the crossing of death?
To fully understand the death cross or golden cross we must have basic knowledge of moving average so moving average is actually to measure the price of an investment during a specific period.
First I will describe the death cross this name starts when the SMA 50 Day moving average crosses below the level of long term moving average 200 day moving average this is called death cross. This is actually the selling signal for the traders.It is a bullish trend for investors.
Two moving averages are used one is the 50 day MA which means SMA, the other one is a 200 Day MA which is a long term moving average.
It has three stages
When SMA crosses under the Long term moving average.
Second stage is vise versa of that of stage one.
Third stage is price are falling and indication of downtrend.Means bullish starts to change into bearish trend.
Golden Cross
When SMA 50 day moving Average crosses Above the long term moving average 200 day moving average.Usually it is considered Better indicator for technical analysis.
Three stages
SMA is under the Long term moving average.
Second stage is vise versa of first one.
Third stage when SMA goes and crosses above the long term moving average.It Means prices are going to raise.
This is a bullish signal for traders.
Question 2 Use the BTC/USDT pair to show the golden crossover and the crossover of death, in tradingview. Also use the STEEM/USDT pair to show the golden cross and the death cross. Screenshots are required
Golden cross Use of BTC/USDT
So, now I am going to explain by the use of BTC USDT pair to show you golden cross over as well as the death crossover I am using the trading view app and I have already login in this app and then firstly I will show the golden crossover through BTC USDT pair.
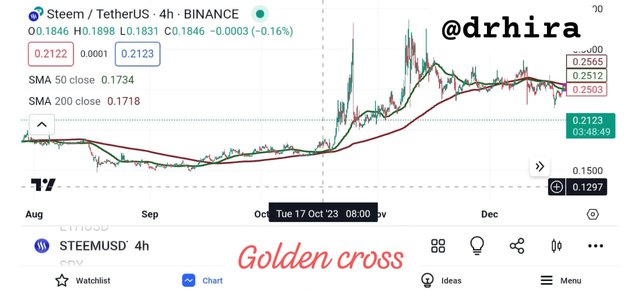
So here I am going to show the golden cross over which occurs on Tuesday 17th of October 2023. I am trying to show you that the short term moving average crossing upward to the 200 day.
And upward on the green box you can see the price how it is increasing.So this was one example of Golden cross.
Death Cross over by the use of BTC/USDT
Now I am showing you the death crossover by using the BTC USDT pair
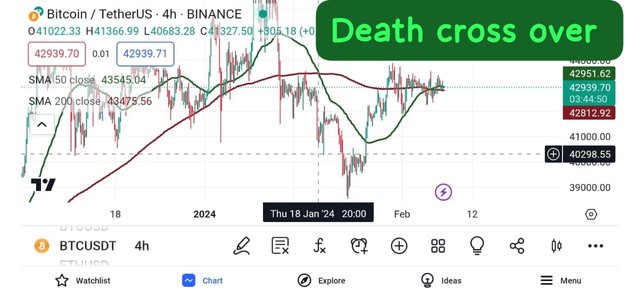
So here I am trying to show you clearly death cross over occurs on Thursday January 2024.
In this example you can see 50 day short term moving average crossing the 200 day in the negative deflection or downtrend.This is indication for prices falling.
Golden cross by the use of Steem/USDT
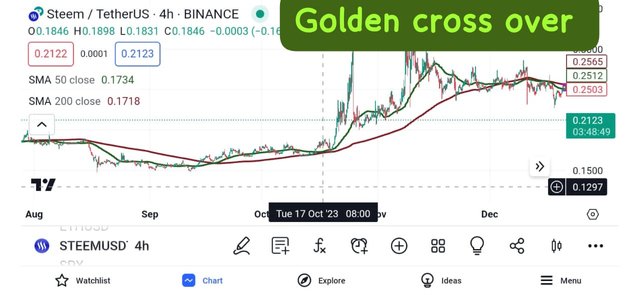
So I am trying to show you golden cross over by the use of steem / USDT and you can see the golden cross over which is happening on 17th of October 2023. And here I am trying to show you that the 50 day short term moving average which has crossed the 200 day in UP trends so what does it mean it means that the prices will going up.
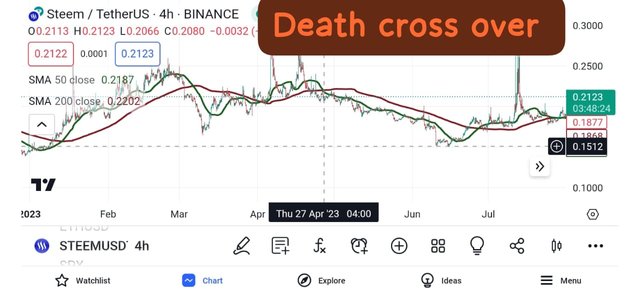
Death Cross over by the use of Steem/USDT
Death cross over which occurs on the 27 April 2023 I am trying to show you the 50 Day short term moving average crossing the 200 day in downtrend and this is strong indication for selling.i hope this is clear from the charts.
Question 3: What is the difference between the golden crossover and the death crossover?
| Heading | Golden cross over | Death Cross over |
|---|---|---|
| Meaning | SMA cross above Long term MA | SMA cross below long term moving average |
| Market | prices going up | prices falling |
| Traders point | bullish trends means support level | bearish trend means resistance level |
| Investment time | buy signal indication | sell signal indication. |
Question 4: In addition to these two chartist patterns, what other indicator would you add to make the technical analysis more effective at the moment of making a decision.
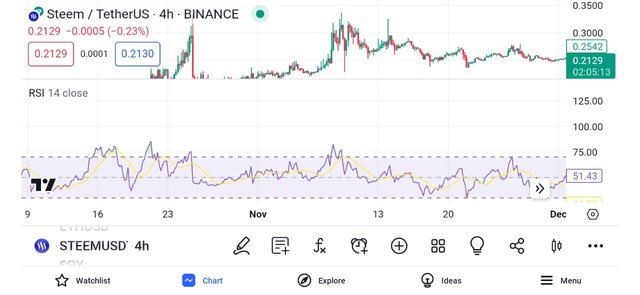
So one of the another indicator which is used for the death cross and Golden cross is relative strength index.
This is used to see the closing price of any market if you are doing trading so this is very good indicator for the investors this is actually we can called a momentum oscillator means measure basically the velocity as well as the rate of price which is going up a down in the market.
The scale of RSI is used from zero to 100 and it is measure mainly on 14 day. high is considered to be 70 and lowest is considered to be 30.
RSI is a indicator for telling the investors whether the assets is over sold or overbought.
Its all about my today's post.
I would like to invite my friends @jannat12, @suboohi and @ashkhan to take part in the challenge.
Upvoted. Thank You for sending some of your rewards to @null. It will make Steem stronger.
Downvoting a post can decrease pending rewards and make it less visible. Common reasons:
Submit
Your post is always well updated and the prost presentation is so well and I must say you have better understanding of this topic that's the reason you have given the answer so well and through the precise in simple language which is easy to understand for all of us and the last question you have answer so well whether the use of RSI index and the chart make your understanding more clear for all of us and I must say your article is easy to understand for all of us best of luck
Downvoting a post can decrease pending rewards and make it less visible. Common reasons:
Submit
Greetings friend,
Your post is always on point and up to date. The way you present the information is top-notch, and it's clear that you have a deep understanding of the topic. Your answers are precise and explained in simple language that everyone can understand. Your explanation of the use of the RSI index and the chart really helped clarify things for all of us. I have to say, your article is easily understandable for everyone. Best of luck to you.
Downvoting a post can decrease pending rewards and make it less visible. Common reasons:
Submit
Dear friend.
Great to see you participate in this contest. It has been a pleasure reading through your post.
I appreciate your explanation what death cross and golden cross is. Your usage of the btc chart and steem/usdt chart to explain the two chart patterns was lovely.
The differences you highlighted about the two of them is well taken and understood.
Your choice of RSI as an indicator to be used in conjunction with golden cross and death cross is fantastic. It tell us when an asset is either overbought or oversold.
Thank you for this insightful writeup.
Downvoting a post can decrease pending rewards and make it less visible. Common reasons:
Submit
Anda sepertinya memahami dengan baik materi ini, penjelasan anda mudah dimengerti. Tapi kami berharap anda dapat menunjukkan bagaimana peluang yang tepat mengambil bagian investasi dengan menggunakan RSI
Downvoting a post can decrease pending rewards and make it less visible. Common reasons:
Submit
La utilización de la media móvil cruzada es muy fácil de aplicar, identificar e interpretar. Siendo un modelo matemático que se adapta a los períodos que el usuario desea, lo hace muy versátil.
Resulta interesante combinarlo con el indicador RSI en el que podemos tener una visual del corto plazo y darnos una idea del impulso o fuerza que sigue la dirección de la tendencia. Esto eleva nuestro análisis con un mayor conocimiento que nos ayudará a tomar una mejor decisión.
Gracias por compartir,
¡Saludos y bendiciones!
Downvoting a post can decrease pending rewards and make it less visible. Common reasons:
Submit
Your post gives detailed information about technical analysis. You have explained clearly about "Golden Cross" and "Death Cross" and presented your answers in simple language. Your post will make it easier for users to understand. Best wishes for your prosperity.
Downvoting a post can decrease pending rewards and make it less visible. Common reasons:
Submit