Glad to acquire new trading related knowledge via Cryptoacademy. Today I am writing homework task for professor @fredquantum which is about TRIPLE EXPONENTIAL MOVING AVERAGE

What is your understanding of Triple Exponential Moving Average (TEMA)?
Before we come to specifics of triple exponential moving average (TEMA) , let's have a brief recap of moving averages. we have differente types of moving averages like simple moving average , exponential moving average and weighted moving average. In general, moving averages are trend following technical indicators with the well-known limitation of lag in providing signals. Technical analysts have tried various methods to eliminate the lag like combination of different types of moving averages, use of multiple moving average of same type, crossover of moving averages.
Triple exponential moving average (TEMA) is a one more attempt to eliminate the lag that was developed in 1994. To begin with, it was used for stocks and commodities and was later adopted by cryptos. It is worth mentioning that the name TEMA is actually confusing because it is not the combination of three different moving averages as it seems. It is a magic play of single exponential moving average that is tripled to filter out the lag .
The take home message of TEMA , as for my understanding is concerned is to know its uses as :
TEMA helps in filtering out the lag.
Identification of dynamic support and resistance.
Identification of direction of trend.
Spotting of trend reversal.
Generating entry and exit signals.
How is TEMA calculated? Add TEMA to the crypto chart and explain its settings. (Screenshots required).
TEMA Calculation
As mentioned earlier, TEMA is not combination of three different exponential moving averages but single moving average that is subjected to different mathematical algorithms. You will get a clear Insight when I will mention method of calculation. The formulla for TEMA is as:
TEMA = (3 × EMA1) - (3 × EMA2) + EMA3
Where;
EMA1 = Exponential moving average
EMA2 = EMA of EMA1
EMA3 = EMA of EMA2
So EMA 2 and EMA 3 are not sepeare Or different period EMAs. But EMA 2 is EMA of EMA 1 and EMA 3 is EMA of EMA 2. So, the period is same for all three EMAs.
I'll apply the indicator to the chart on tradingview platform and than change settings according to our requirements :
Select any trading pair. Chart of the pair will load.
Click on indicators from the top menu. In my case, i have Indicators option at bottom of the chart.
Next we type "Triple EMA" in the search box provided and select same Indicator from the suggestions.
Go back to your chart and you will find indicator loaded to the chart.
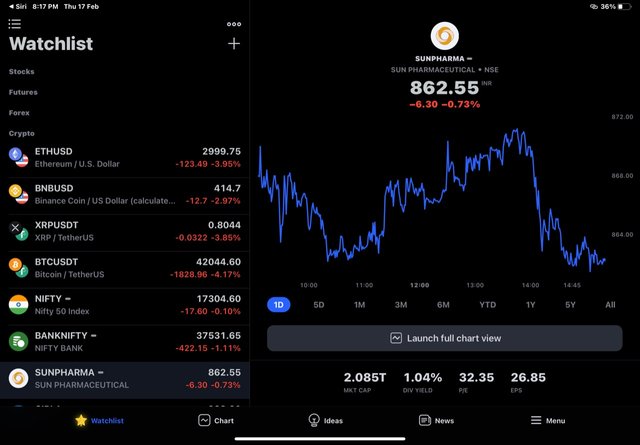
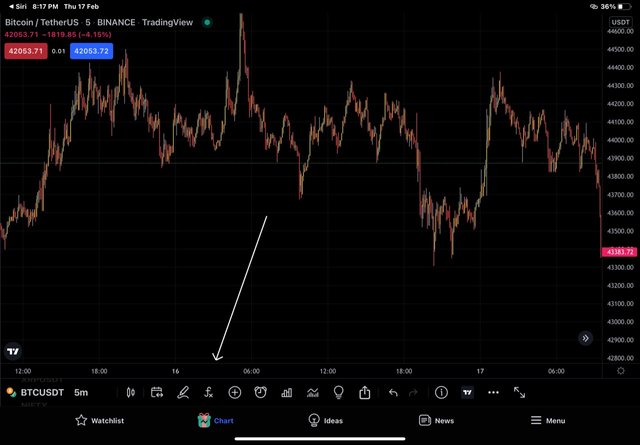
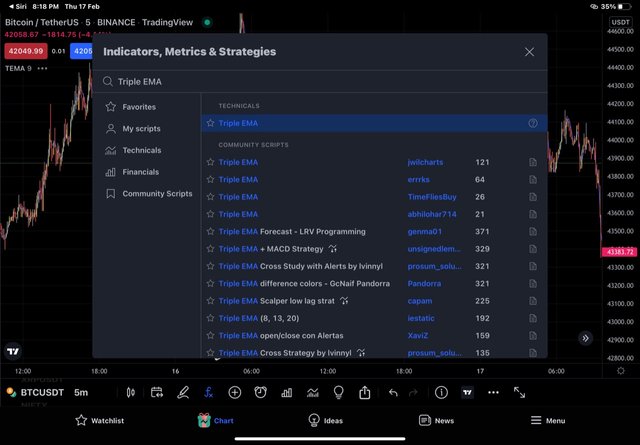
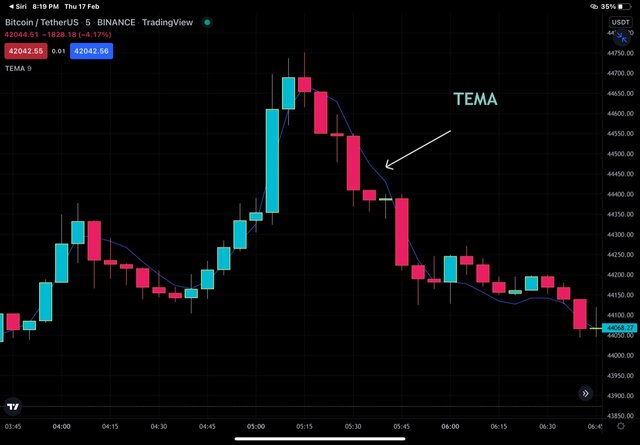
Configurations of the Alligator Indicator.
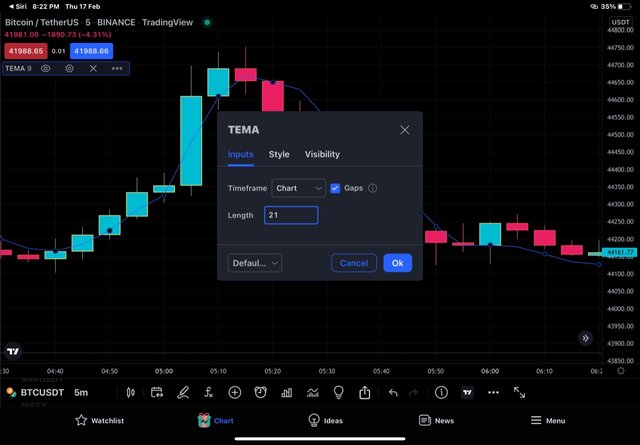
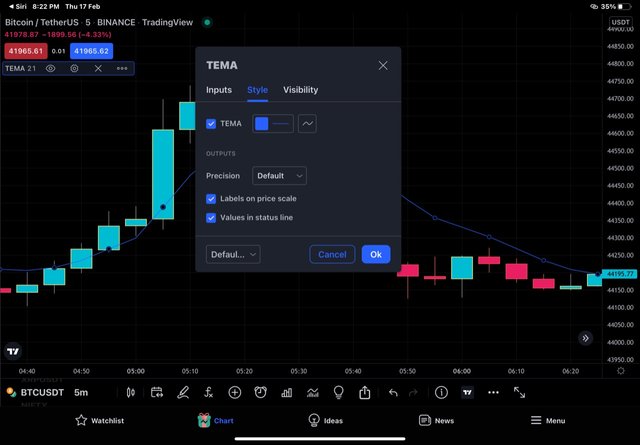
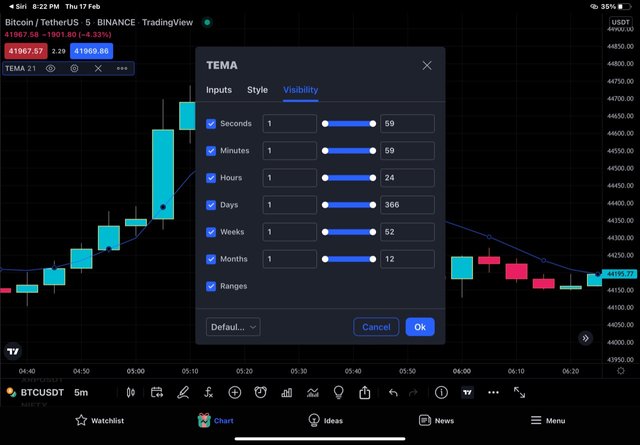
Double click on Indicator and chart settings will load.
in input settings , we will customise input settings as per our trading style. We will choose length as 21 periods and timeframe same as that of chart.
I'll keep Style and Visibility settinga as it is.
Compare TEMA with other Moving Averages. You can use one or two Moving Averages for in-depth comparison with TEMA.
TEMA vs EMA
As mentioned in the introduction of the TEMA that, it was developed to mitigate the lag seen with traditional moving average. I will make use of of same period ( say 50) EMA and TEMA for drawing better comparison.
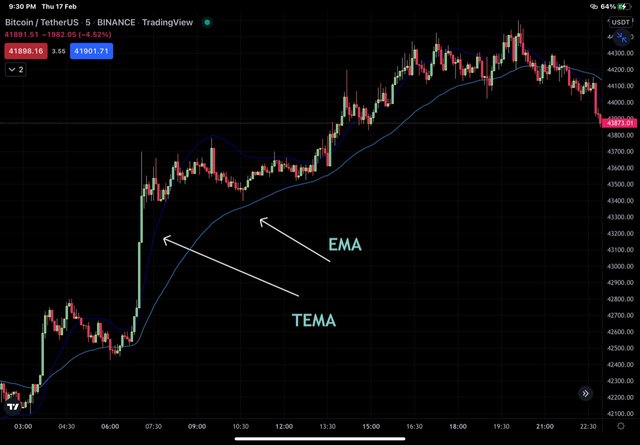
TEMA AND EMA on BTC/USDT chart in uptrend
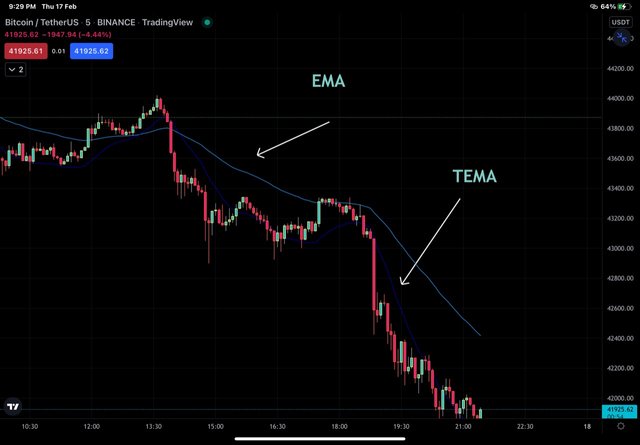
TEMA, EMA ON BTC/USDT CHART IN DOWNTREND
In the chart above , we can see that triple exponential moving average follows price more closely then exponential moving average of same period. We can see that during downtrend both of them act as dynamic resistance lines but triple exponential moving average lies more close to the price which indicates that it's more sensitive to fluctuation in the price and that's the reason for filtering out the delay. Same holds true for their movement during uptrend they act as support during uptrend but triple exponential moving average is more responsive than EMA of same period. Therefore the signals generated on the basis of TEMA are more reliable then EMA.
TEMA vs EMA and SMA.
Having compared TEMA and EMA over same period, we have seen the difference in their working. Now, let's ade another indicator and that's simple moving average (SMA) of same period (say 50) to the chart and find out the difference.
We know that, SMA is based on simple arithmetic mean of prices over specified period of time while as EMA gives more weighttage to recent price. So EMA is better than SMA in filtering out the lag. We have already seen in the discussion above that, TEMA is better than EMA in filtering out the leg. So from the theoretical discussion we can infer that, TEMA is better than EMA which is better than SMA in filtering out the lag. So least lag is seen with TEMA and most with SMA.
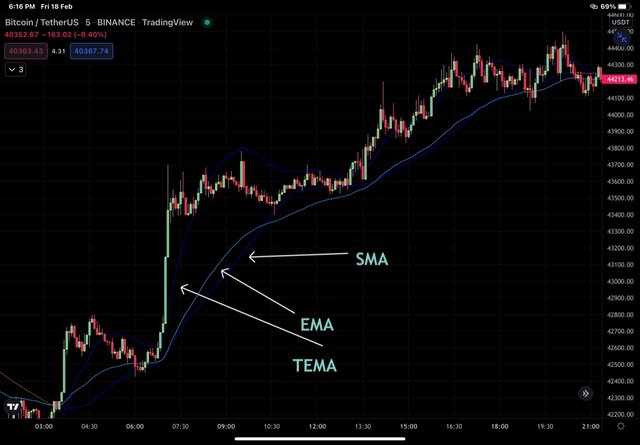
TEMA, EMA and SMA applied together
In the charts above, we can see that TEMA is closer to price then EMA and simple main averages (SMA) is farthest of all the three . So we can conclude that TEMA filters out the signals better and acts as better dynamic support and resistance and provides more appropriate signals then EMA and SMA.
Explain the Trend Identification/Confirmation in both bearish and bullish trends with TEMA (Use separate charts). Explain Support & Resistance with TEMA (On separate charts). (Screenshots required).
Trend identification
We know that moving averages are trend following indicatora and so is TEMA. For trend identification, we will have to look at direction of price and TEMA.
When price of an asset is moving up, we call it bullish market or trend. TEMA is also projected upwards in bullish trend.
When price of an asset is moving down, we call it bearish market or trend. TEMA is also projected downwards in bearish trend.
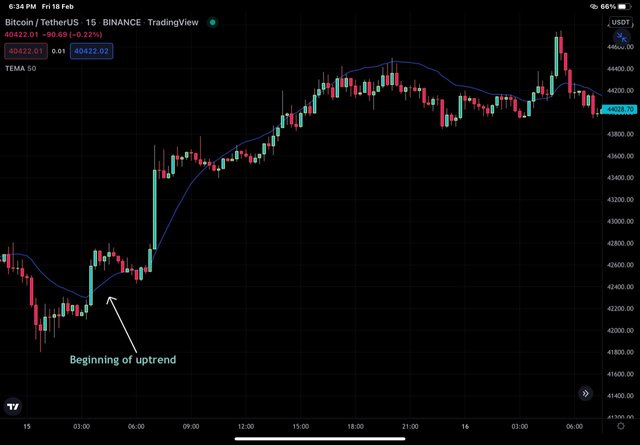
From the BTC/USDT chart above, we can see that the downtrend paused and transitioned in uptrend as seen by price moving below the TEMA toy crossover of line above TEMA. We can see the bull run thereafter.
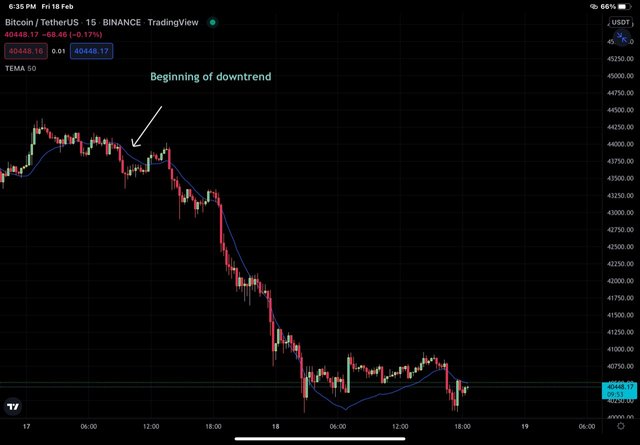
From the BTC/USDT chart above, we can see that the uptrend paused and transitioned in downtrend as seen by price moving above the TEMA toy crossover of line below qTEMA. We can see the bear run thereafter.
Support and Resistance
TEMA acts aa dynamic support and resistance line for price of an asset. Change in orientation of TEMA marks begining of new trend.
During bullishh market TEMA acts as dynamic support as it continues to be floating under the price line and price keeps on bouncing from it. When TEMA changes it's direction and crosses price line to act as resistance, it marks the beginning of new trend.
During bearish market TEMA acts as dynamic resistance as it continues to be floating above the price line and price keeps on bouncing down from it. When TEMA changes its direction and crosses price line to act as support , it marks the beginning of new trend.
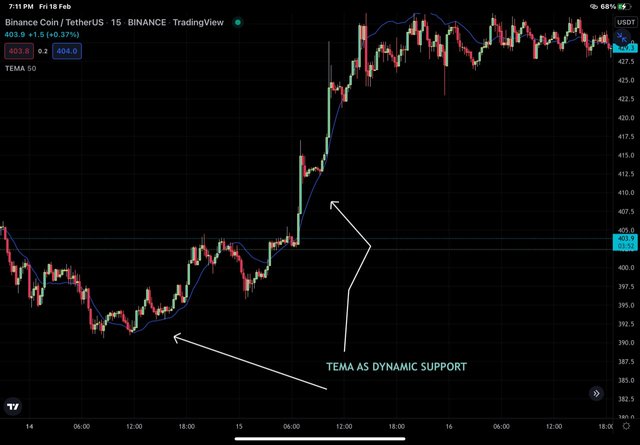
in the BNB/USDT chart above, TEMA 50 is closely placed below price and price is bouncing from it. So it acts as dynamic support.
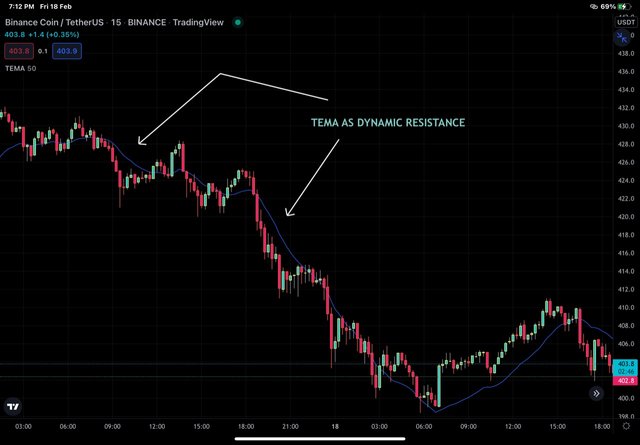
in the BNB/USDT chart above, TEMA 50 is closely placed above price and price is bouncing from it. So it acts as dynamic resistance.
Explain the combination of two TEMAs at different periods and several signals that can be extracted from it. Note: Use another period combination other than the one used in the lecture, explain your choice of the period. (Screenshots required).
I'll be combining two TEMAs of different periods to look for validation of signals. For this task, I'll use TEMA 20 and TEMA 100. Short period TEMA is used to take positions after its crossover. Long period TEMA validates reversal after reverse Crossover.
When TEMA 20 crosses TEMA 100 from below upwards it indicates the forthcoming bullish trend and therefore is a signal for taking buy position.
When TEMA 20 crosses TEMA 100 from above downwards , it reflects the forthcoming variation and therefore is a signal to short the market.
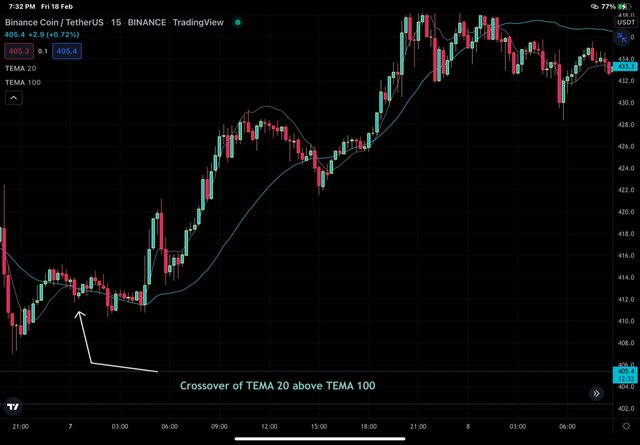
in the BNB/USDT chart above, crossover of TEMA 20 above TEMA 100 is followed by a bullish rally of price.
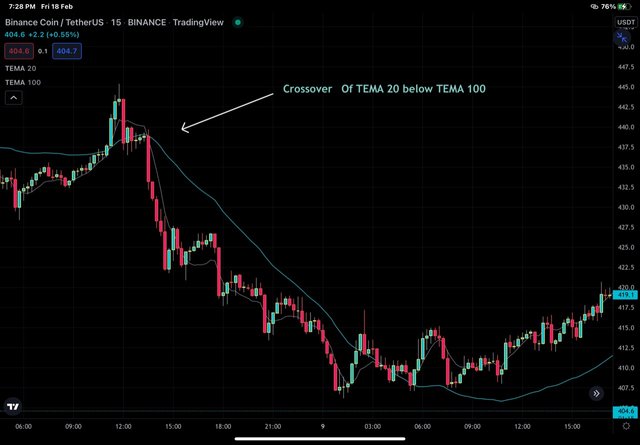
in the BNB/USDT chart above, crossover of TEMA 20 below TEMA 100 is followed by a bearish rally of price.
What are the Trade Entry and Exit criteria using TEMA? Explain with Charts. (Screenshots required).
Entry/Exit Trade Criteria with TEMA for buy position
I'll continue with the above mentioned TEMAs to spot entry/exit criterias.
Add TEMA 20 and TEMA 100 on the Chart.
Look for crossover of TEMA 20 above TEMA 100 .
Open buy position after at least two candlesticks confirmation above TEMA 20.
To exit the trade, place stoploss below the low of the candle before crossover. Take profil is set such that TP/SL is 1:1or 1: 2
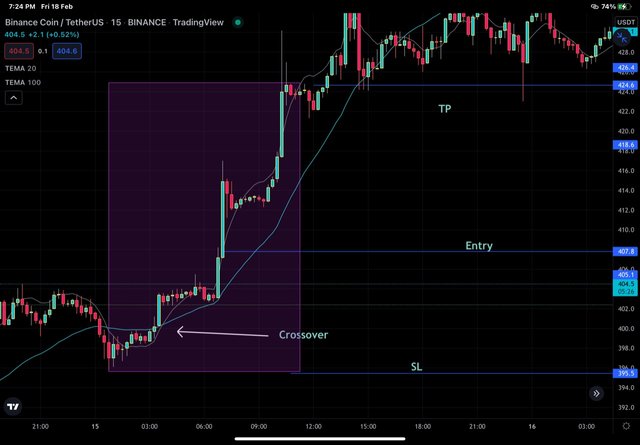
in the BNB/USDT chart above, entry is placed after crossover and retest of TEMA 100 . A strong bullish candle trading above TEMA 20 has been choosen to enter. SL is placed just below the TEMA 100 and swing low before begining of new trend. TP is placed such that SL/TP is > 1:2.
Trade Entry/Exit Criteria for a Sell Position using 2 TEMAs
Add TEMA 20 and TEMA 100 on the Chart.
Look for crossover of TEMA 20 below TEMA 100 .
Open sell position after at least two candlesticks confirmation below TEMA 20.
To exit the trade, place stoploss above the high of the candle before crossover. Take profil is set such that TP/SL is 1:1 or 1: 2
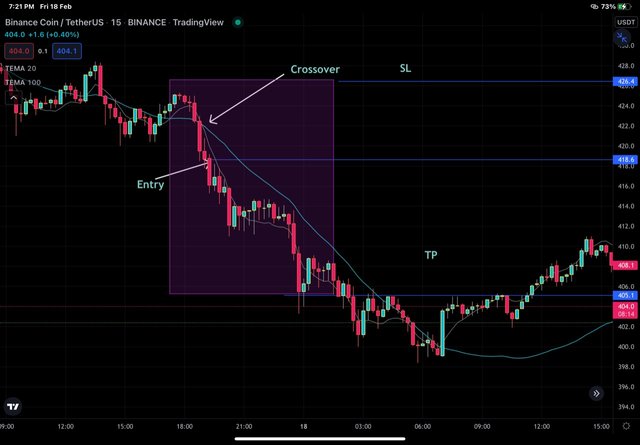
in the BNB/USDT chart above, entry is placed after crossover at second red candle . A strong bearish candle trading below TEMA 20 has been choosen to enter. SL is placed just above
the TEMA 100 and swing hugh before begining of down trend. TO is placed such that SL/TP IE > 1:2.
Use an indicator of choice in addition with crossovers between two TEMAs to place at least one demo trade and a real margin trade on an exchange (as little as $1 would do). Ideally, buy and sell positions (Apply proper trade management). Use only 5 - 15 mins time frame. (Screenshots required).
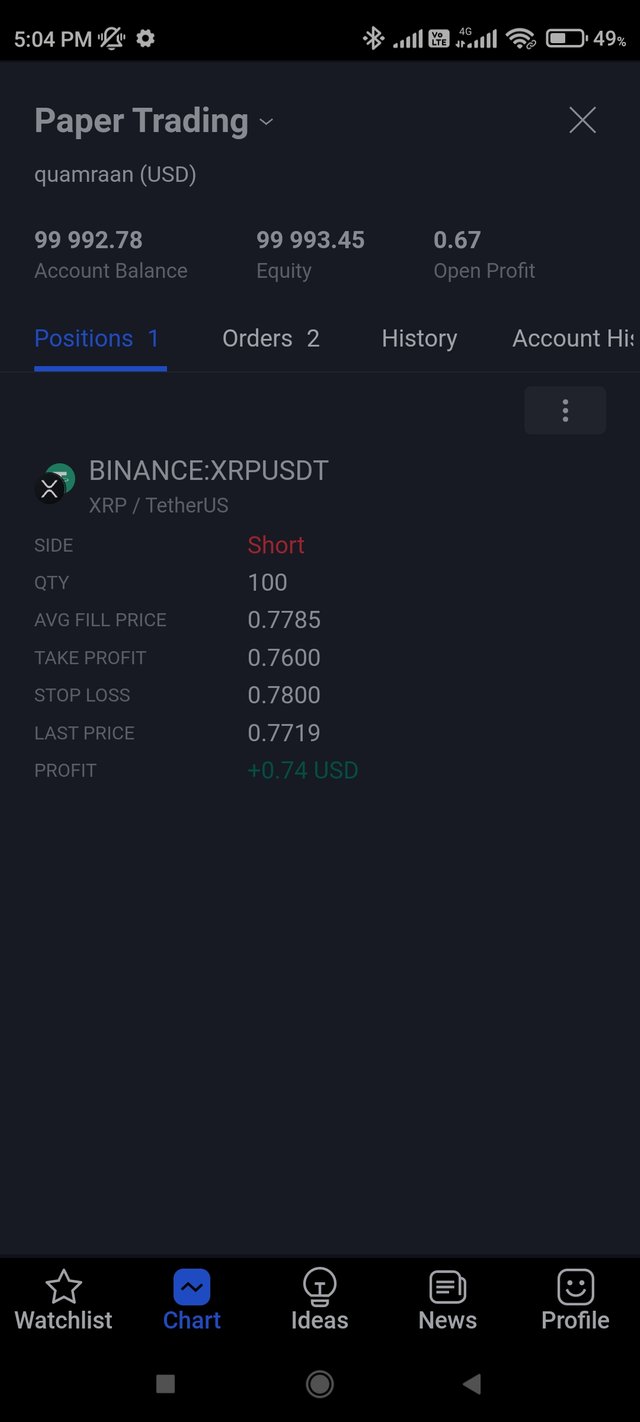
I'll be using average directional index (ARX) along wi5h crossover of TEMAs (20 and 100) to place both Demo trade and real margin trade.
Demo sell trade
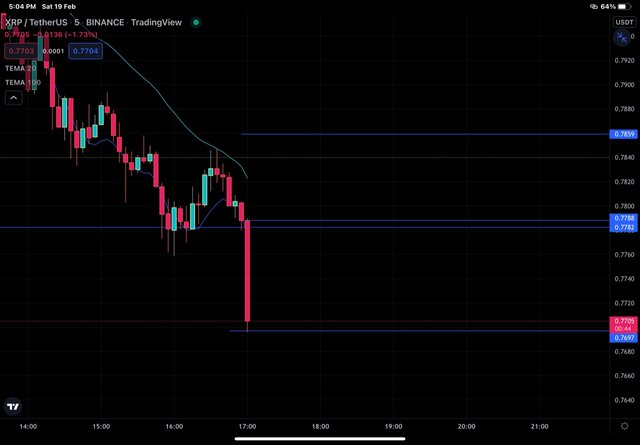
In the XRP/USDT chart above, bearish crossover has taken place between TEMA 20 and TEMA 100. I have placed sell trade after retesting of TEMA 100 at XRP Price of 0.77 USDT and SL at 0.785 USDT and TP at 0.7697.
SL was placed above TEMA 100 and TP was placed such that SL/TP is 1:1 .
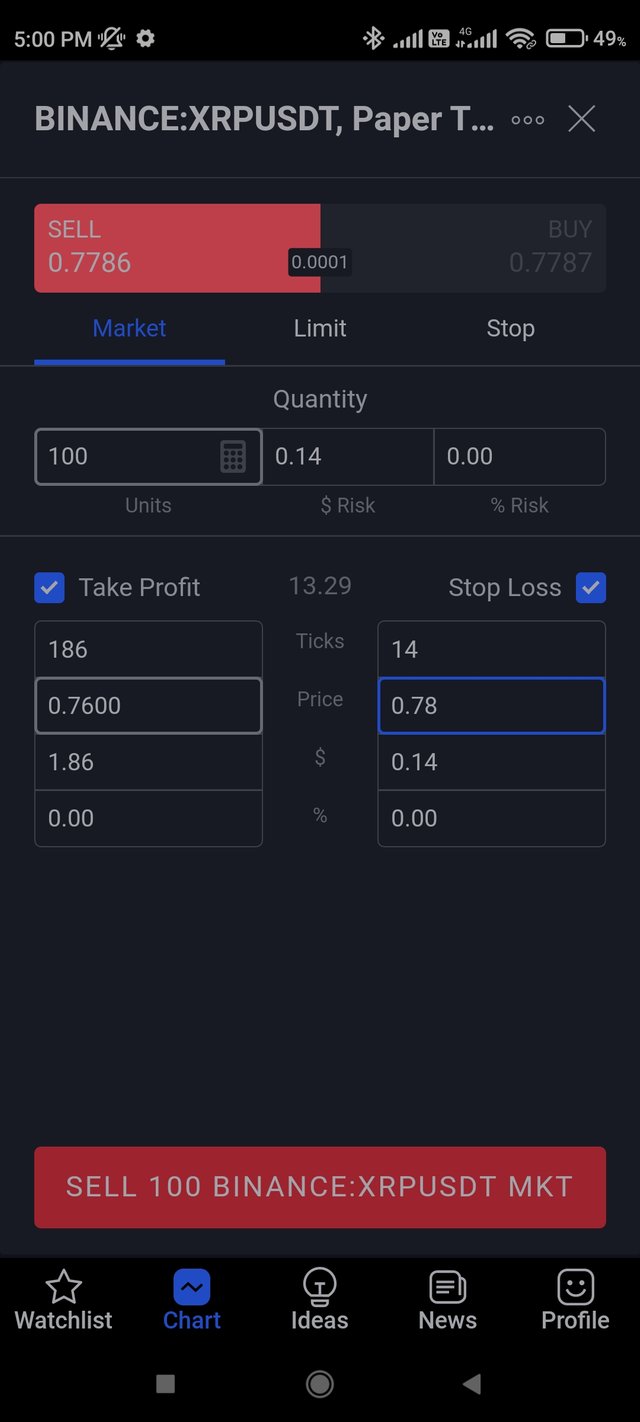
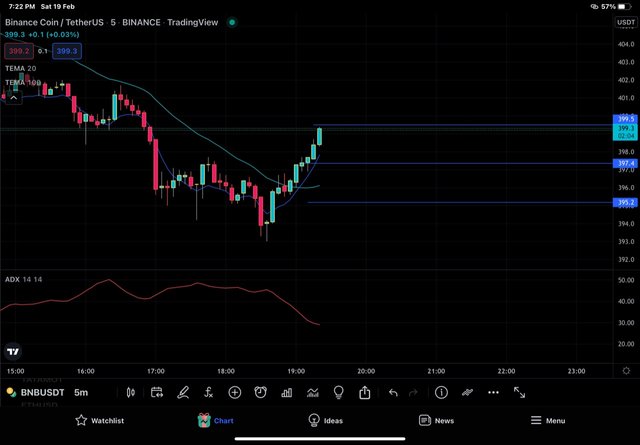
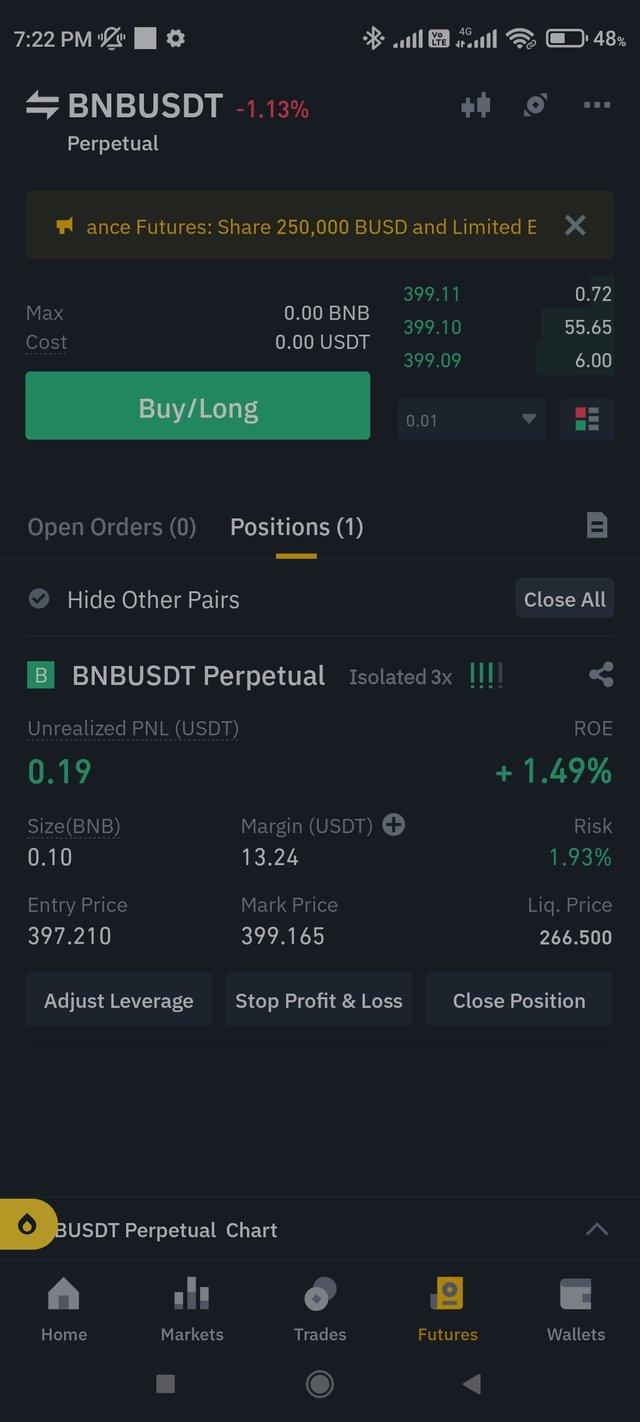
Margin Buy trade.
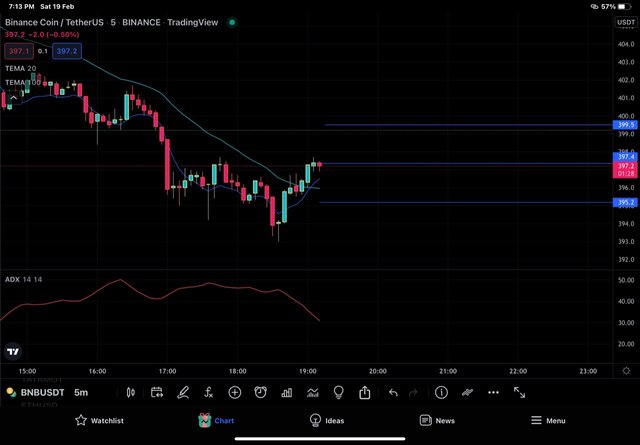
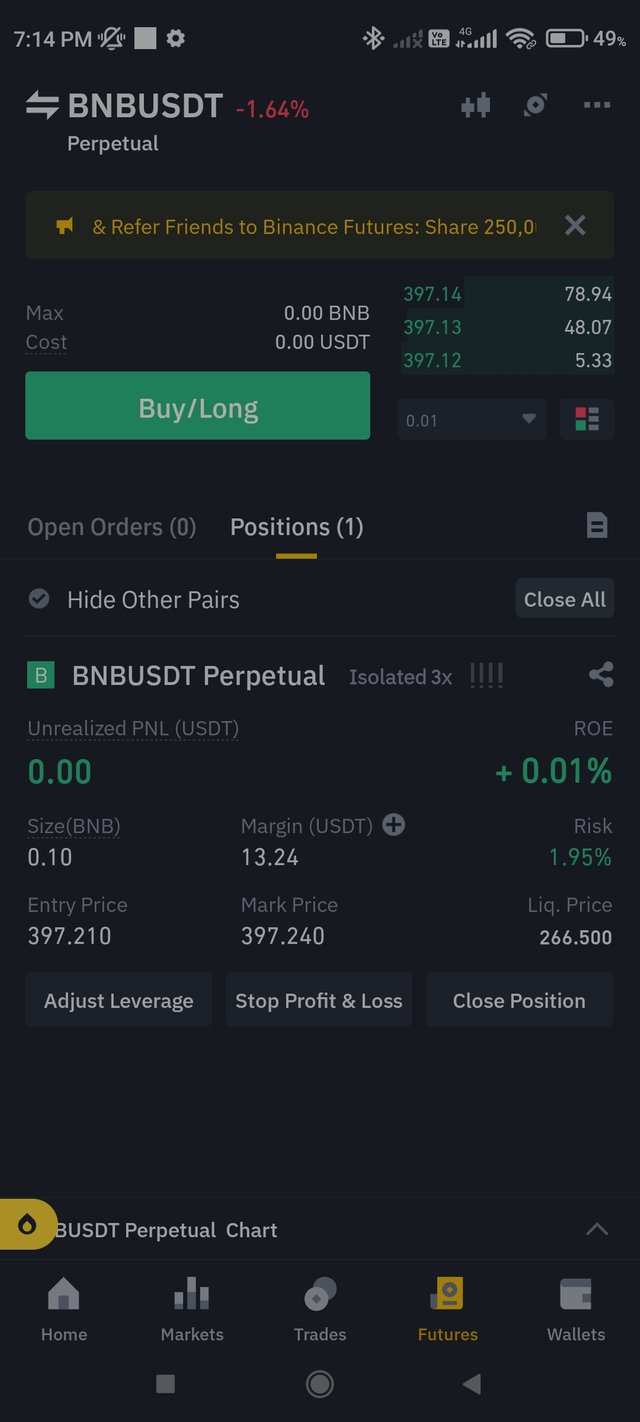
In the BNB/USDT Chart above, i have placed trade after bullish crossover ( TEMA 20 above TEMA 100) at BNB price of 297.21 USDT and SL is placed just below crossover atBNB price of 395.2 USDT and TP is set such that 397.4 USDT making it SL/Tap of 1:1.
What are the advantages and disadvantages of TEMA?
We know that no indicator is absolute, every indicator has some pros and cons and same holds true for TEMAs too.
Advantagea of TEMA.
TEMA is more sensitive to price changes and therefore filters out the lag better than traditional moving averages.
TEMA acts as dynamic support and resistance to the price.
Signals generated on the basis of TEMA are more reliable than EMA and SMA.
Signals like entry and reversal are easier to spot on the basis of angulation of TEMA.
Use of multiple TEMAs of different periods generate signals on the basis of crossovers.
Disadvantagea of TEMA.
TEMA works well in trending markets only where as it is not good indicator in choppy or sideways market.
Being sensitive to price changes, TEMA is less reliable in volatile markets because there are no clear signals or frequent buy/ sell signals are generated.
Shorter period TEMAs generate frequent and false signals as compared to longer period TEMAs.
Conclusion
TEMA is a modified form of EMA to tackle lag that is seen with EMA or SMA. It is EMA of EMAs and acts as dynamic support and resistance. Use of crossover of TEMAs has been shown to generate valid buy and sell signal.
