Hello and welcome to my blog. I hope you are all doing well and enjoying this new season of steemit cryptoacademy with wonderful themes that are floated every week. For this week, I choose to write task about Golden and Death cross as demanded. Let's begin without dodging
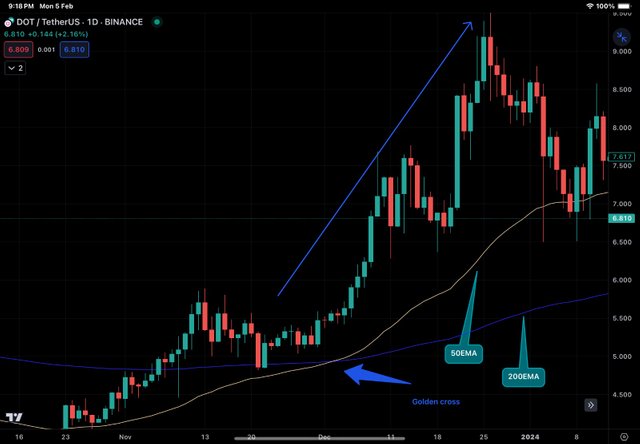
Golden cross
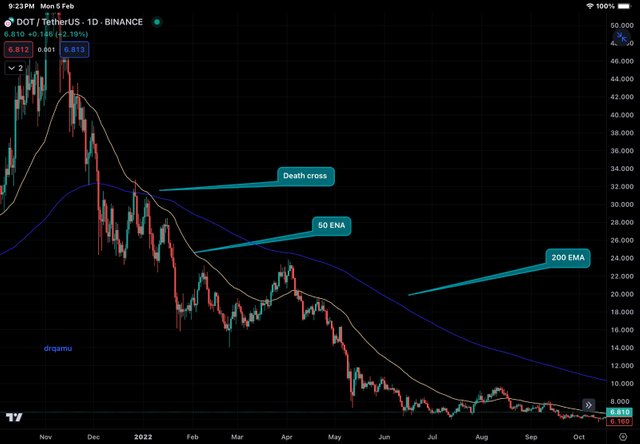
Death cross

1. Explain in your own words, what is the golden crossing and what is the crossing of death?

Golden cross and death cross refer to the crossover between two moving averages and have predictive importance in the market. As the name implies, Golden cross predicts forth coming bullish trend in the market while death cross predicts forthcoming market crash.
Two moving averages, one of shorter period and another of longer period, are used for the formation of Golden cross and death cross. Golden cross is formed when the moving average of shorter period crosses the moving average of longer period from below upwards s. On the contrary, death cross is formed when the moving average of shorter period crosses the moving average of longer period from above downwards.
Shorter period moving average shows recent and quick change in the price of an asset under consideration, and it moves close to the price chart. On the contrary, longer period moving average shows farther change in the price action and is located away from the price chart.

Golden cross

Death cross
The two most commonly used moving averages are 50 periods and 200 periods. For example, on a daily time frame, 50 periods refer to 50 days moving average and 200 periods refer to 200 days moving average. So the period of the moving average chosen depends upon the time frame that we use to visualise a Price chart.
Let's presume the use of 50 days and 200 days moving average for understanding Golden cross and death cross. Golden cross is formed when 50 days moving average crosses 200 days moving average from blow upwards. On the contrary, death cross is formed when a 50 days moving average crosses 200 moving average from above downwards.
Golden crossover and death crossover help traders in taking different positions in the market or squaring off from the market. It is, however, important to mention that none of the indicators is absolutely perfect in predicting the trend in the market; therefore, traders must never compromise with the risk reward management principles.
It is also important to know that one must not rely on a single indicator for taking any position in the market. The use of multiple indicators increases the chances of taking a successful trade. Therefore, crossovers must be used along with other indicators to increase their predictive potential.

2.- Use the BTC/USDT pair to show the golden crossover and the crossover of death, in tradingview. Also use the STEEM/USDT pair to show the golden cross and the death cross. Screenshots are required.

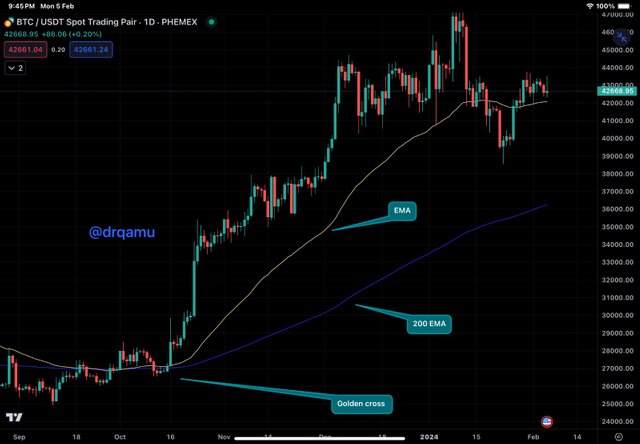
BTC/USDT GOLDEN CROSSOVER
In the BTC/USDT chart above, I have shown Golden crossover as can be seen by crossover of short period moving average over long period moving average. We can see the increase in the price of BTC after the crossover.
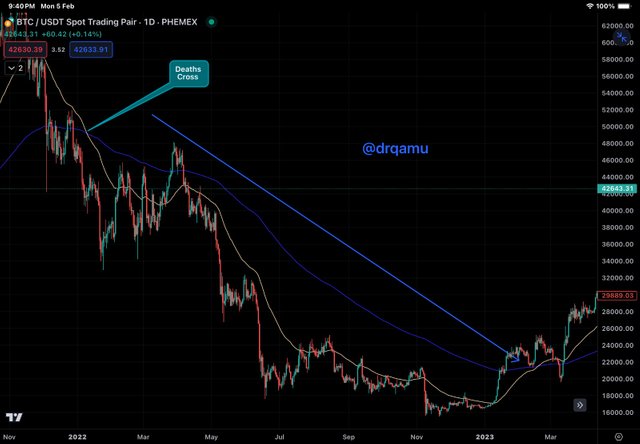
BTC/USDT Death CROSS
In the BTC/USDT chart above, I have shown death crossover as can be seen by the abobe downwards movement of small period moving average over long period moving average. Further we can see the decrease in the price of BTC thereafter.
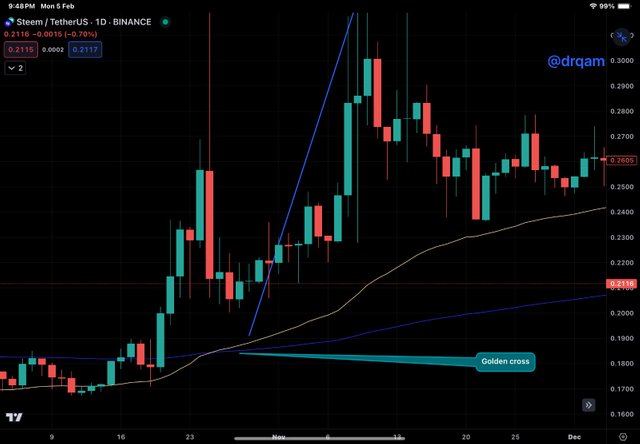
STEEM/USDT GOLDEN CROSSOVER
In the STEEM/USDT chart above, Golden crossover between two moving averages is followed by an increase in the price of STEEM.
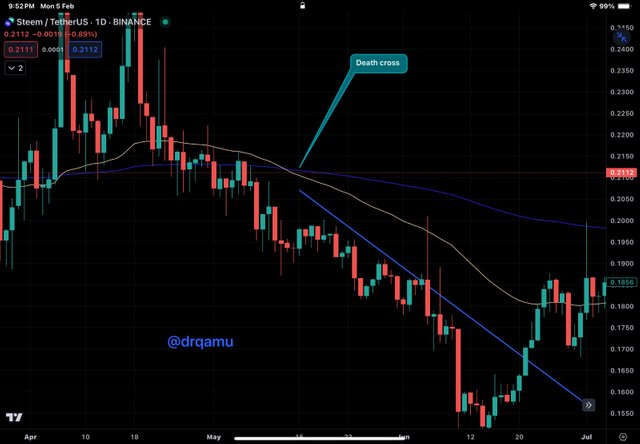
STEEM/USDT Death CROSS
In the STEEM/USDT chart above, we can see that the death cross was followed by crash in the price of STEEM.

3.- What is the difference between the golden crossover and the death crossover?

A golden cross is formed when a moving average of a shorter period crosses the moving average of a longer period from below upwards. On the contrary, the death cross is formed when the moving average of a shorter period crosses the moving average of a longer period from above downwards.
Golden cross predicts the forthcoming bullish trend in the market while death cross predicts the forthcoming bearish trend in the market.
Golden cross up ho is used by traders to make long positions in the market or to exit the shot positions, while death cross is used by traders to take short positions in the market or exit the long positions in the market.

4.- In addition to these two chartist patterns, what other indicator would you add to make the technical analysis more effective at the moment of taking a decision.

Having mentioned earlier that no indicator is absolutely perfect in predicting the trend in the market and therefore, it is not the sane practice to dependent on single indicator for taking any position in the market.
Use of multiple indicators increases the chance of taking a successful trade because multiple confirmations are achieved through the use of multiple indicators. There is no golden rule in choosing the second indicator to be used with these chart patterns, and therefore, it depends on the experience and comfort of a trader to use any particular indicator that suits their interest and strategy for trade execution.
I prefer to use the Relative Strength Index (RSI) along with golden and death cross. However, as for my experience is concerned, I do not take trades on the basis of either of these. I use these indicators to be doubly sure about the signal that they give and for the execution of trade, I use price action.
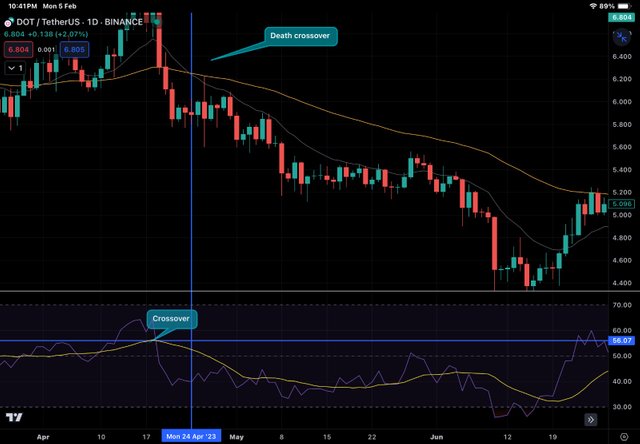
DOT/USDT Death cross and RSI
In DOT/USDT chart above, a death cross on chart is followed by similar cross on RSI. We can see that cross on RSI has occured before it took place on overlapping indicator on price chart. So the RSI signal is confirmed by death cross. So we got a double conformation to execute a trade.
Thank you, friend!


I'm @steem.history, who is steem witness.
Thank you for witnessvoting for me.
please click it!
(Go to https://steemit.com/~witnesses and type fbslo at the bottom of the page)
The weight is reduced because of the lack of Voting Power. If you vote for me as a witness, you can get my little vote.
Downvoting a post can decrease pending rewards and make it less visible. Common reasons:
Submit
TEAM 5
Congratulations! Your comment has been upvoted through steemcurator08.Downvoting a post can decrease pending rewards and make it less visible. Common reasons:
Submit
Thank you but where's the upvote @josepha
Downvoting a post can decrease pending rewards and make it less visible. Common reasons:
Submit
Greetings friend,
Your explanation of the death cross and golden cross was on point as you did a great job explaining these concepts. Everything about the explanation was made easier when you showed the BTC/USDT chart and explained where these crosses happen, clearly showing the golden cross and the death cross. You also used the STEEM/USDT chart to explain these patterns.
You also shared the differences between the death cross and golden cross patterns, which is awesome. You also talked about adding the RSI indicator to confirm market entry and exit. This is indeed a very smart move as I would do the same.
Overall, you've shown a strong understanding of the topic at hand and put in a lot of effort to answer all the questions. Well done, I wish you all the best.
Downvoting a post can decrease pending rewards and make it less visible. Common reasons:
Submit
I am pleased to read that you have gone through every section of my post and made engaging comment. Thank you for being there.
Downvoting a post can decrease pending rewards and make it less visible. Common reasons:
Submit
Saludos cordiales estimado amigo drqamu, buena participación, has dado muy buenas respuestas propias a cada pregunta planteada, manejas muy bien el tema de las señales chartistas, en este caso el cruce dorado y el cruce de la muerte.
Bendiciones.
Downvoting a post can decrease pending rewards and make it less visible. Common reasons:
Submit
Thank you for your insights on my work .
Downvoting a post can decrease pending rewards and make it less visible. Common reasons:
Submit
Dear @drqamu
It has been a pleasure reading through
your post after a long time
° you have clearly explained what death cross and golden cross is to my satisfaction. Your usage of the btc chart to explain the two chart patterns was awesome.
° you also mentioned the 3 differences between the two chart patterns which is laudable.
° Your choice of RSI as an indicator to be used in conjunction with golden cross and death cross is fantastic even though both are lagging indicators.
Overall. I read your post with great delight.
Wishing the best in this engagement.
Downvoting a post can decrease pending rewards and make it less visible. Common reasons:
Submit
Thank you for your valuable feedback.
Downvoting a post can decrease pending rewards and make it less visible. Common reasons:
Submit
Greetings
My dear friend how nicely you gave given a detailed description of death cross and golden cross. Irs really informative for us.
You have given a detailed overview of BTC/ USDT and try to explain very good how the death cross and golden cross occurred.
You have told us in brief what is difference between death cross and golden cross.
In general you have give a brief knowledge i wish you success.
Downvoting a post can decrease pending rewards and make it less visible. Common reasons:
Submit
Nice to read your remarks about various sections of my post. Thank you .
Downvoting a post can decrease pending rewards and make it less visible. Common reasons:
Submit
Es interesante el uso de las medias móviles para intentar predecir la tendencia de precios de un activo, suena genial pero es matemática pura.
Estas medias no son proyecciones sino producto del cálculo con precios ocurridos reales, pero que delinean el comportamiento que definen la trayectoria.
Los estudiosos de las tendencias basadas en medias móviles simples han logrado obtener una excelente combinación de las media móvil a corto plazo de 50 días cruzándola con la media móvil a largo plazo de 200 días.
Aunque este método es muy utilizado por los traders a largo plazo, no es infalible y el análisis deben combinarse con otros indicadores que corroboren la tendencia o aclaren otros aspectos.
Escogiste el RSI adicionalmente para completar tu análisis, estoy de acuerdo que es un indicador adecuado.
Gracias por compartir, te deseo mucho éxito y suerte en el desafío.
Downvoting a post can decrease pending rewards and make it less visible. Common reasons:
Submit
¡Gracias por tu respuesta! Siempre es valioso intercambiar ideas sobre estrategias de análisis técnico.
Downvoting a post can decrease pending rewards and make it less visible. Common reasons:
Submit