Hello and welcome to my blog . I hope you are all doing well and enjoying this season of engagement challange. Today we are going to discuss a basic topic of technical analysis which is about chart patterns .


What is chartist analysis? And the importance of chart patterns.

Chart analysis is a technique of technical analysis in which a chartist observes the movement of prices and compares the current price with that of similar price movements in the past to predict future movements. Patterns are certain specific and conspicuous figures formed in charts (candlesticks) that help traders understand ongoing trends and predict the likelihood of market trends in the near future. In simpler terms, chart patterns are different shapes made by the movement of prices in a market, anticipated to be repeated in the future and behave in the same manner as they did in the past. Let me give examples of different chart patterns like head and shoulders, inverse head and shoulders, cup and handle pattern, double bottom, double top, ascending triangle, descending triangle, symmetrical triangle, etc.
Different patterns - discussed later
The importance of studying chart patterns is that one can materialize these patterns for capital gain. These chart patterns have a definite psychology behind them, and one can easily understand the sentiment of the market by looking at these patterns and can take timely action to maximize gains and minimize losses.
In the case of an anticipated crash in the market, one can easily liquidate long positions and also enter short positions. Exiting long positions can prevent loss, and entering short positions can yield profit if the pattern goes in the right direction.

What is the shoulder-head-shoulder pattern? Show screenshots using the BTC/USDT pair. You can use another cryptocurrency pair if you wish.

The shoulder-head-shoulder pattern is a reversal pattern that indicates a forthcoming crash in the market. The pattern comprises left shoulder, head, right shoulder, and a neckline. The left shoulder is formed by an upward rally of prices, whose rising strength is broken, and prices dip to take support from the neckline, then rise again to form the head. The top of the head is above the top of the left shoulder, but prices don't keep moving and retrace their path back to take support from the neckline and form the right shoulder. The low point of the left shoulder is almost level with the right shoulder but below the peak of the head. When the price retreats from the left shoulder, it fails to maintain support at the neckline but breaks the neckline. The break of the neckline signals a significant crash.
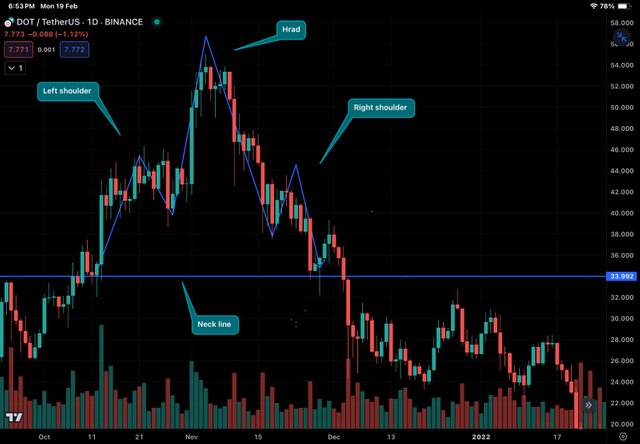
DOT/USDT head and shoulder pattern
Let's take an example of DOT/USDT and try to understand the head and shoulder pattern. We can see that an upward rally in prices met slight resistance near the left shoulder, took support from the neckline, made another higher high to form the head, retraced its path to take support from the neckline again, and then the price moved up again to form the right shoulder. After that, it retraced its path, broke the neckline, and then kept sinking thereafter.

Explain the formation of the inverse head and shoulders pattern. Show screenshots of a cryptocurrency pair that displays this pattern.

The inverse head and shoulders pattern is another reversal chart pattern formed by left shoulder, head, right shoulder, and a neckline, indicating a trend reversal from bearish to bullish. The psychology behind the inverse head and shoulders pattern is that the neckline, which bears attempt to push down, couldn't act as a stabilizing resistance after being tested by the left shoulder and head. Still, it is finally broken by the right shoulder to continue a bullish rally.
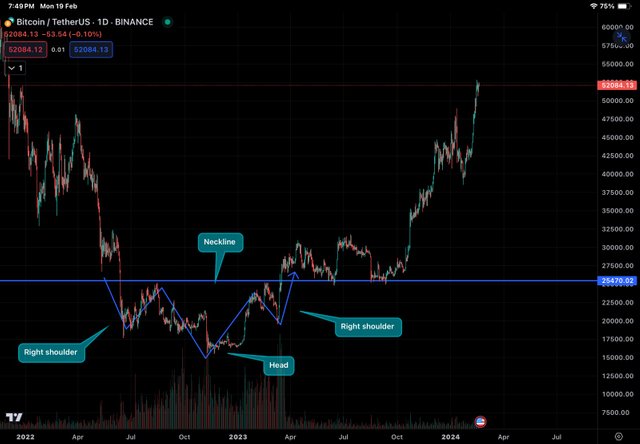
BTC/USDT - inverse head and shoulder pattern
In the BTC/USDT chart above, we can see how the price has beautifully respected the inverse head and shoulders pattern. After the break of the neckline by the right shoulder, the neckline, which was acting as a resistance for the pattern, has acted as support for the price, and the price has skyrocketed thereafter.

For the technical analysis of Steem, would you use chart patterns? Explain your answer.

The knowledge of technical analysis is universal and can be applied to all trading pairs, be it Steem, Bitcoin, or any other cryptocurrency. It's important to mention that these price patterns and technical analysis, in general, are applicable not only to cryptocurrencies but also to the stock market as well. Therefore, it should come as no surprise that we can use these chart patterns in Steem as well. Let's take an example.
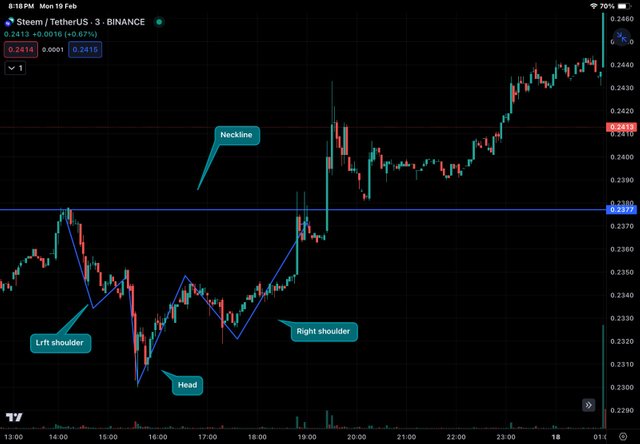
In the chart above, I have shown an inverse head and shoulders pattern in Steem and how the price has respected the pattern. It's not only about the ability to chart patterns that can be observed in Steem, but other patterns can also be seen. Let me cite a few examples.
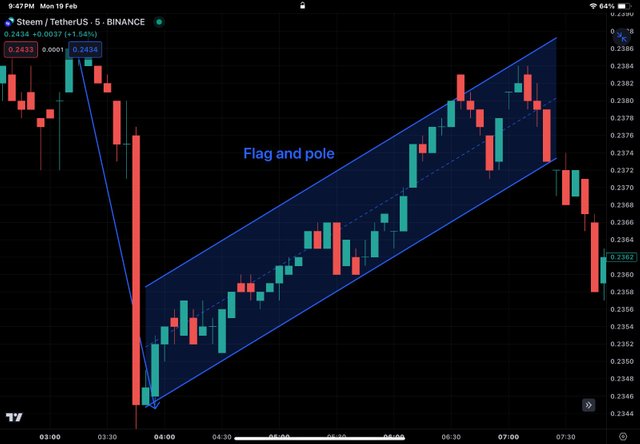
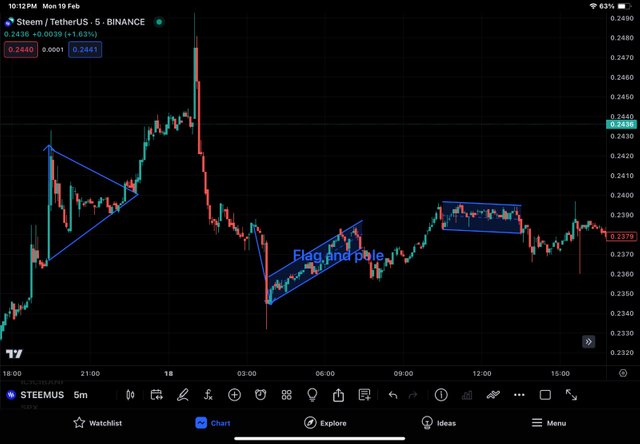
Above is an example of the flag and pole pattern shown by Steem, where the breakdown of the lower border of the flag is followed by a significant drop in the price of Steem.
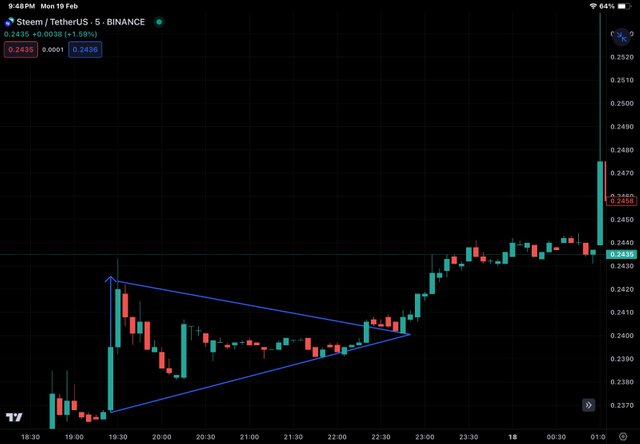
Look at the symmetrical triangle pattern above; we can visualize that the breakup of the upper border of the triangle is followed by a significant increase in the price of Steem.

Confusion

Chart patterns or an integral part of technical analysis. These are defnkte structures formed by price movement and convey bulk of predictive information that is materliased by chartists to maximise the gain and or minimise the losses.
Thank you, friend!


I'm @steem.history, who is steem witness.
Thank you for witnessvoting for me.
please click it!
(Go to https://steemit.com/~witnesses and type fbslo at the bottom of the page)
The weight is reduced because of the lack of Voting Power. If you vote for me as a witness, you can get my little vote.
Downvoting a post can decrease pending rewards and make it less visible. Common reasons:
Submit
hey great explanation of chartist analysis and the importance of chart patterns The examples provided such as head and shoulders, inverse head and shoulders and various other chart patterns, offer a comprehensive understanding of how traders can anticipate market movements. The DOT/USDT head and shoulder pattern example is particularly insightful showcasing the reversal dynamics in action. Looking forward to more insights on different patterns..
Downvoting a post can decrease pending rewards and make it less visible. Common reasons:
Submit
Pleased to hear that you find it great . Thank you for standing by.
Downvoting a post can decrease pending rewards and make it less visible. Common reasons:
Submit
Impressive analysis on chart patterns! Your post is educational and engaging, with clear examples that make complex concepts easy to grasp. Well done
Downvoting a post can decrease pending rewards and make it less visible. Common reasons:
Submit
Nice to hear that you found it simple to understand. Thank you .
Downvoting a post can decrease pending rewards and make it less visible. Common reasons:
Submit
Your explanation helps to understand the importance of the chart pattern. You have explained the various patterns clearly and helped in understanding it through examples. Your post is educational and interesting, and you present the topic very simply.
Downvoting a post can decrease pending rewards and make it less visible. Common reasons:
Submit
So nice to hear that . Thank you .
Downvoting a post can decrease pending rewards and make it less visible. Common reasons:
Submit
Your kost welcome dear brother 💕
Downvoting a post can decrease pending rewards and make it less visible. Common reasons:
Submit
Downvoting a post can decrease pending rewards and make it less visible. Common reasons:
Submit
Not voted yet .
Downvoting a post can decrease pending rewards and make it less visible. Common reasons:
Submit
Greetings friend,
Your explanation of chartist analysis and the importance of chart patterns was absolutely amazing. I loved how you provided examples of different patterns like the head and shoulders, inverse head and shoulders, and more. It really helped me understand how traders can anticipate market movements. The example you shared of the DOT/USDT head and shoulder pattern was particularly insightful. It showcased the reversal dynamics in such a clear and practical way. I'm genuinely excited to learn more from you about different patterns and gain further insights. Your expertise in this area is truly impressive. Keep up the fantastic work, my friend.
Downvoting a post can decrease pending rewards and make it less visible. Common reasons:
Submit
It is pleasing to see that you have highlighted and reflected on various sections of my post . Thanks
Downvoting a post can decrease pending rewards and make it less visible. Common reasons:
Submit
Hello friend it's so lovely going through such high quality article especially from someone like you with so much experience and skills when it comes to crypto analysis and crypto academy courses I must say such high quality what keeps Steemit alive and active .I must say I'm pleased with your work thanks for sharing
Also try to comment on my entry too https://steemit.com/hive-108451/@starrchris/steemit-crypto-academy-contest-s15w6-chartist-analysis
Downvoting a post can decrease pending rewards and make it less visible. Common reasons:
Submit
Nice to hear that .
Downvoting a post can decrease pending rewards and make it less visible. Common reasons:
Submit
You are very correct in this definition. It makes it easy for a a layman to understand.
Such dedication to reading of charts helps a trader to know more about the current situation in the market.
You also mentioned and showed other chart patterns like the triangle, falling wedge or bearish flag. These are good too and can be used efficiently by traders.
In all you have done justice to this contest. Wishing you the best in this contest.
Downvoting a post can decrease pending rewards and make it less visible. Common reasons:
Submit
I am pleased to read your remarks on various sections of my post . Thank you .
Downvoting a post can decrease pending rewards and make it less visible. Common reasons:
Submit
Thank you for providing a comprehensive overview of chartist analysis and its significance in predicting market trends. Your detailed explanations and examples of chart patterns such as the head and shoulders and inverse head and shoulders enhance understanding. The inclusion of screenshots from cryptocurrency pairs like DOT/USDT and BTC/USDT further illustrates these patterns in real-market scenarios. Your application of technical analysis to Steem incorporating patterns like inverse head and shoulders flag and pole and symmetrical triangles demonstrates a practical approach. Best of luck
Downvoting a post can decrease pending rewards and make it less visible. Common reasons:
Submit
Thank you for your valuable feedback.
Downvoting a post can decrease pending rewards and make it less visible. Common reasons:
Submit