Hi steemians, today I will be making my entry on the assignment task 10 by Prof @reminiscence01 on the topic Candlestick patterns and in lieu of that, I will attending to the following questions:
EXPLAIN THE JAPANESE CANDLESTICK CHART (ORIGINAL SCREENSHOT REQUIRED)
IN YOUR OWN WORDS, EXPLAIN WHY THE JAPANESE CANDLESTICK CHART IS MOST USED IN THE FINANCIAL MARKET
DESCRIBE A BULLISH AND BEARISH CANDLE. ALSO EXPLAIN ITS ANATOMY. ( ORIGINAL SCREENSHOT REQUIRED)

EXPLAIN THE JAPANESE CANDLESTICK CHART (ORIGINAL SCREENSHOT REQUIRED)
The Japanese candlestick is a term used to describe a graphical representation of an asset price movement in the market. It is called by the name Japanese Candlestick chart because it was originated and first used in Japan by a rice trader Munehisa Gonna in the year 1700.
The Japanese candlestick is one of the ancient concept in use even before the emergence of cryptocurrencies in determining the price of any asset, its opening and closing point and how the market responds to all these changes. Furthermore, this Japanese candlestick are also used to determine if the next move market will be bearish or bullish.
The Japanese candlestick has a simple structure which taking a keen look at it will provide detailed information about its technical analysis with respect to the price of an asset.
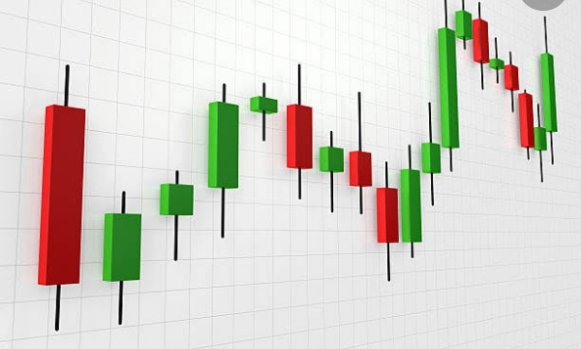
Here is what a Japanese Candlestick chart looks like.
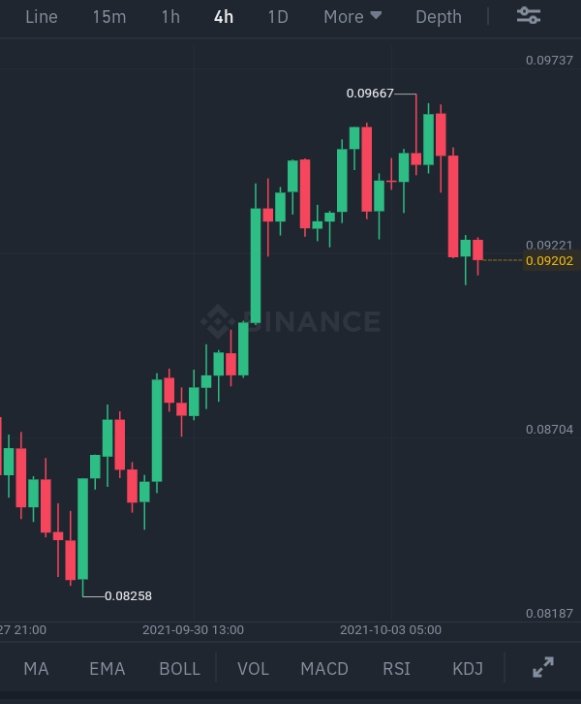
The image above, the Japanese candlestick is displayed in a green and red colour. The green candlestick is used to indicate an increase in the price of an asset while the red candlestick indicates a decline in the price of any cryptocurrency. Although these colours can be configured depending on the users choice .

IN YOUR OWN WORDS, EXPLAIN WHY THE JAPANESE CANDLESTICK CHART IS MOST USED IN THE FINANCIAL MARKET
The Japanese candlestick is the mostly used and known for trading to predict the future price of a crypto asset.
Far from that, financial institutions or markets also employ this tool in analyzing price and below are some of the reasons :
One of the major reasons why financial markets uses the Japanese candlestick is because of its simple structure and easy interpretation: By meet looking at the charts, you can easily comprehend what each of those candlesticks represents (either an uptrend or a downtrend). Also, the Japanese candlestick chart clearly indicates the price movement of an asset per time.
It provides only but reliable information hence, the Japanese candlestick chart is a fundamental tool employed in cryptocurrency trading which provides a higher percentage of success in our trading decision.
The Japanese candlestick is most used in the financial industry, because of its good summary of price fluctuations.
With the Japanese candlestick chart traders get to minimize losses and maximize profit in trading as they are clothed with the fastest clue on the best time to make investments in a particular asset.
The Japanese candlestick help traders identify when the market is moving towards the bearish or bullish end and whether such movement are strongly or otherwise by looking at the length of and colour such candlestick.
The Japanese candlestick chart make for easy identification of the four points (open, close, high and low ). For price relying on the traders specified times.

DESCRIBE A BULLISH AND BEARISH CANDLE. ALSO EXPLAIN ITS ANATOMY. ( ORIGINAL SCREENSHOT REQUIRED)
I will be describing the bullish and bearish candlestick below.
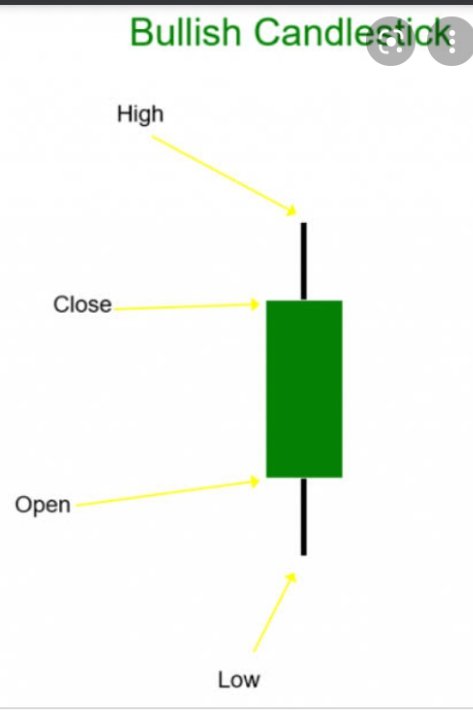
Like I said before, the bullish candle is represented by green and it indicates an increase in the price of an asset. The bullish candle is usually represented in green colour.
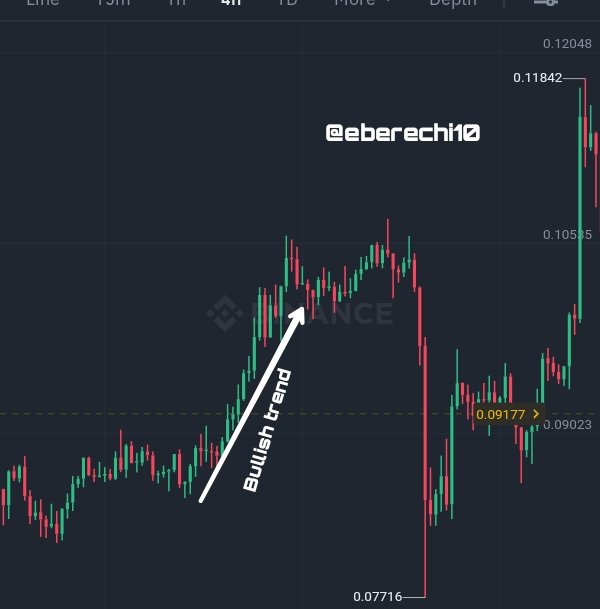
Anatomy of a bullish Japanese candlestick chart
This candlestick is usually represented in green and it an indication of price increase of an asset. Ordinarily, the anatomy of a Japanese candlestick chart is made up- Body
- open
- close
- high
- Low
The bullish candlestick indicates an opportunity for the trader to sell his crypto assets.
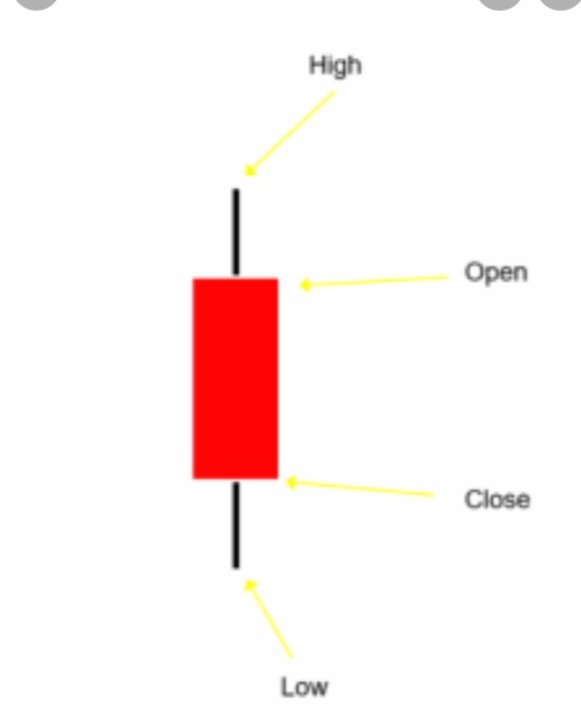
The open point is where the candlestick begins within a particular period of time in a bullish move and same for a bearish move while the closing point indicate the contrary. The highest point indicate the highest point an asset will reach in a bullish trend as well as in bearish trend within a particular period of time whereas the low point signifies the least price of an asset in a bullish and bearish move within a period of time.
Bearish candlestick chart
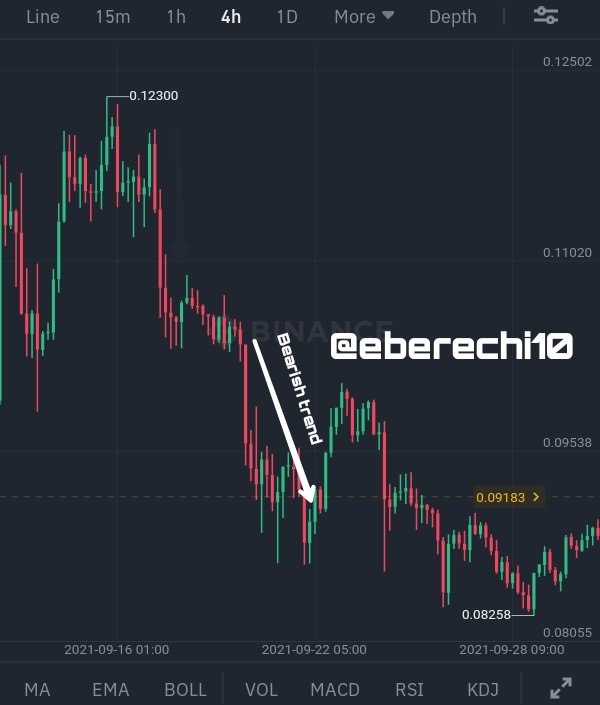
The bearish candlestick is represented with red and it indicate price decline of an asset. The bearish candle is usually red in colour and this is an opportunity to invest in an asset as the price is low when the candlestick become bearish.
Anatomy of bearish candlestick
Just like the bullish candlestick, the bearish Japanese candlestick chart is made up of the following anatomy:- Body
- High
- Low.
- close
- open.
Cc.
@reminiscence01
