
Pinterest, edited in Postermywall"
)

PRICE CHARTS
A price chart or simply called charts is a graphical representation of price that have been plotted over a period if time. A chart seeks to represent all information related to an asset for a specific period of time. Charts shows the price movement of the specific asset. Just by Looking at a Price chart, a person is able to
Identify and understand the interaction between buyers and sellers in that market. So in a sense, the price is a graphical representation of interaction between the various actors in the Market.
The price chart comprise two important component which are Price and Time. These two important component are graphical represented by the X and a Y axis. The X axis also known as the horizontal axis represents the Timeframe while the Y axis also known as the vertical axis represents Price. Technical analyst and traders use the price chart to carry out analysis and predict future price movement over time. Below is a screenshot representation of price.
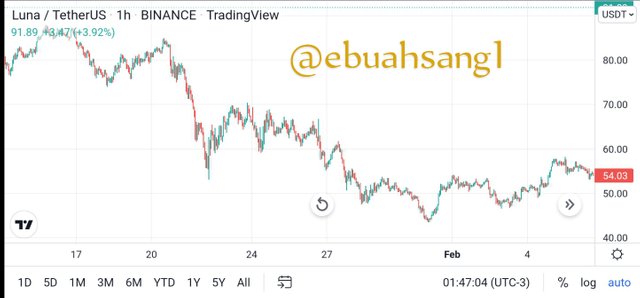
Using the information presented on the price chart above, traders are able to determine the direction of market in relation to price. Analyst can also verify the historic Information of the asset to know it's performance over time. So price chart is not only used for technical analysis but also for fundamental analysis.
CANDLESTICK
Candlestick charts is one of the oldest form of graphical representation of price. The candlestick chart pattern originated from Japanese in the 1700s by a man named Homma. Ever since the it has been used in various financial market to represent price movement. The candlestick illustrate the emotions of traders in the Market by relating price to demand and supply.
The Candlestick is made up of 6 different parts namely,
- High
- Low
- Open
- Close
- Shadow or Wig
- Body.
However, there are four Key parts that must be present in all Candlestick, High, Low, Open and Close. Each of the aforementioned parts represent a movement in price at any given point in time.
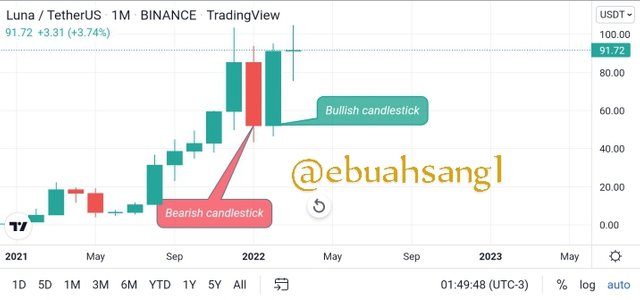
There are two main colors of candlestick, the Bullish and Bearish candlestick. The Bullish candlestick is Green(White) in color while the Bearish candlestick is Red(Black). These two candlestick are formed due to the interaction of price. A Bullish candlestick is formed when price closes above the open point while a Bearish candlestick is formed when price closes below the open point.
The shadow of the candlestick represent the total movement of price for the period.
TIMEFRAME
As we did discuss above, the two most important aspect in the financial market which are represented on a price chart is Price and Time. The Time element in the financial market is very important as it shows the how prices in the market relate to time. Timeframe has a huge effect on how financial traders analyse the market. So the price chart is arrange in accordance to different timeframe to suit different types of traders.
The price chart is therefore segmented into different timeframe like the Minutes, hourly, daily, weekly, monthly and even yearly. Take for example, the Monthly timeframe represent price information for over a month and is good for long term traders while a Daily timeframe represent price movement for a day and mostly used by intraday and Short term traders.
The chart below is an illustration of the various timeframe.
)

Support and Resistance levels are very important aspects in the financial market. It is very vital for traders who want success in Crypto trading to understand
Resistance levels
Resistance levels can be defined as that price level on a price chart where an uptrend is expected to pause and reverse to a downward trend. A resistance level is a significant area of a price chart where price is unable to go any further. For a level or an area to be called a resistance level, it means price must have tested and be rejected by this level atleast twice.
Resistance levels most likely mean an end to an uptrend or rising price as this zone forms a price ceiling for over a period of time.
The psychology behind the formation of Resistance level in the market is that Sellers overpower buyers. So at this level, more sellers come in to stop and beat down rising prices. The resistance zone is usually considered by traders as a Take Profit zone. So when price reaches this area they sell their holdings on the asset thereby causing price to pause and start falling.
So the Resistance zone is plotted by connecting two or more price zone that have successfully rejected prices.
There are several types of resistance, the Horizontal resistance which connects price at the same point by drawing a vertical line, the Sloping resistance which can be found on a downtrend market and connect's two or more lower highs and the dynamic resistance which connects dynamic point of resistance with the help of a Moving Average.
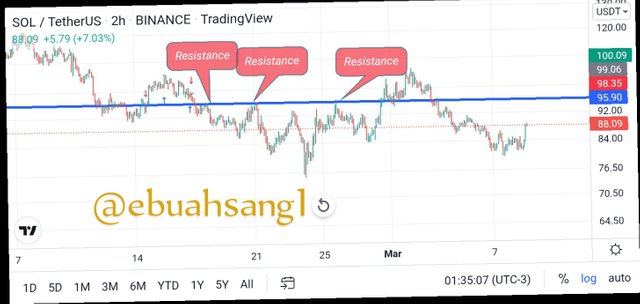
Looking at the chart above, we can s resistance levels has been identified by connecting two or more areas where price has been rejected.
Support level
Contrary to the resistance level is the support level. The support level is mostly found at the bottom of a Downtrend.
The support zone or area is a price point on a chart where falling prices are expected to pause and reverse to an uptrend. A support level is a significant level where price is unable to cross below and so at this level, price is expected to bounce back to an uptrend. The support level acts as a signal for Long position as a trend reversal is expected.
The psychology behind the formation of the Support is that at this level, the market experience the influx of new buyers who come in to stop prices from falling any further. Buyers consider this area to be favorable for a buy entry and so at this level, there are more buyers in the market than sellers.
Just like the Resistance zone, the support zone has 3 main types. The horizontal Support zone which links different price areas on a chart by drawing a horizontal line. Secondly is the Sloping Support which can be found in an Uptrend. The Sloping Support is identified by linking two or more higher low points on a price chart. The last is the dynamic Support which is drawn with the help of a Moving Average. The dynamic Support indicate dynamic areas of support on a price chart.
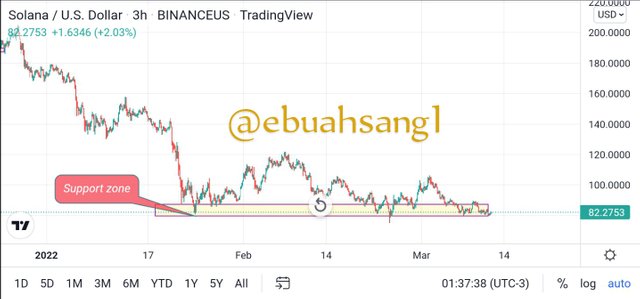
Looking at the Screenshot above, we can see that the horizontal line has been drawn to show the support level. It can be seen how price have consistently bonce of this level indicating the presence of buyers in the market.
)

Fibonacci Retracement
Fibonacci retracement Indicator is a technical tool used by trader in the Financial market to identify reversals points on a price chart. The Fibonacci retracement stems from the Fibonacci sequence that was developed by Leonardo Bonacci an Italian mathematician. The Fibonacci sequence starts from 0 one 1. The next number is gotten by adding the previous two numbers to form the next. These sequence can then be broken up into a series of percentages which is very vital in forming support and resistance level on a chart.
Each level is then associated to a percentage which then shows how much of move price as retraced. In crypto trading, the most important Fibonacci percentage are 23.6%, 38.2%, 61.8% and 78.6%. Using this percentage, a trader can measure how far back a price has moved from one point to the other. And so this Indicator can be use by linking two different price point, the high and low point and then the Indicator will give the different levels.
The Fibonacci retracement can be used to then identify or anticipate future movement of price. In an uptrend the Fibonacci retracement is drawn by linking the lowest price point in the chart and the highest price point. The Indicator then provide several resistance and support level. Let's look at the screenshot below.
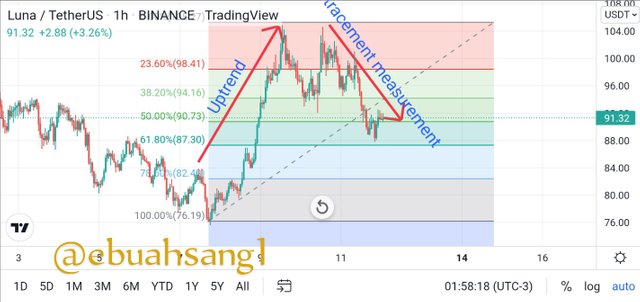
On the other hand, during a downtrend, Fibonacci retracement can be drawn from the high point to lowest point.
Round Number
Round numbers are numbers that mostly end in zeros. In simple terms round numbers comprise of number like 1400, 300, 400 etc. Financial asset traders have developed huge interest for round Number on trading.
The psychology behind the growing interest in round numbers is because it has been noticed that big investors and Crypto traders mostly used these round Number price level to place trading orders. Traders usually use this level to enter or exit the Market and so a good use of a round Number will help a trader to identify key support or resistance levels on a price chart.
So round numbers turn to be important levels of trading in the market. To illustrate let's consider the image below.
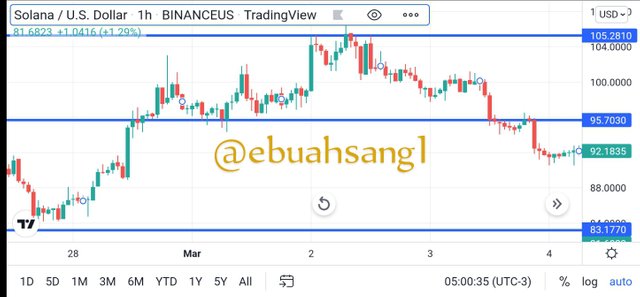
Looking at the image above, it can be observed that major support or resistance level happens at round Numbers that is 105.2810, 95.7030. This illustrate the importance of round numbers in trading.
High Volume
Another key component in the trading market is Volume. The importance of volume cannot be understated. One thing that can be said about price is that there is a direct link between the volume of an asset and the price of that asset.
The Volume of an asset shows the number of persons that are trading this asset over a given period of time. It is there important to know the volume of an asset to determine of the volatility of the asset.
High Volume therefore illustrate that there is high activities concerning the currency. High volume means that there are many people trading the currency at that particular point one time. Usually, high volume is a good signal as it indicates that there are enough market actors present in the market to push price to a desired direction. Volume is also related to Accumulation and Distribution phases on a chart. I will discuss accumulation and distribution shortly. But one thing to note is that during an accumulation period the market experience low Volume and when the distribution phase begins, the volume.
Volume is very vital in trading.
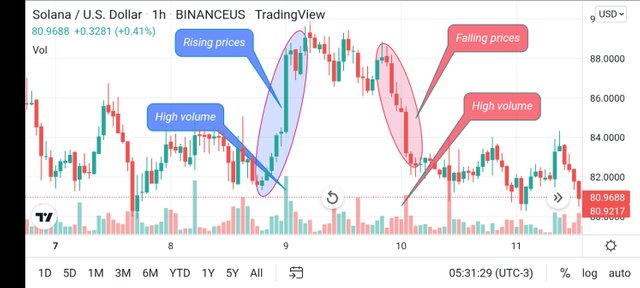
Accumulation and Distribution
The financial market has two main stage or phase in which it is. It's either in a Trend or Ranging. These two phases are also called Accumulation and Distribution.
Accumulation in normal terms refer to a collection period. In financial trading, this is a phase where by buyer or investors buy and keep assets. Usually, investors are very careful during this period not to cause sudden change in price. So the try to buy huge amounts of the currency without hiking prices.
Distribution is the direct opposite of the accumulation phase. The distribution phase is where buyers turn to sell their positions in the Market. The distribution stage is considered as an area of Sell pressure from previous Buyers. At this phase, whales in the market seek to take profits from the Accumulation of resources they had.
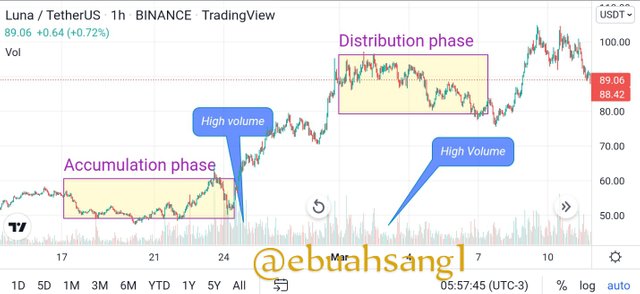
)

Support and Resistance Bounce
We have been discussing through out this week on how to identify and draw resistance and support level. We earlier stated that a Support level is that price where price is expected to bounce and return back when in a downtrend and Resistance levels is a price where rising price is expected to bounce off to reverse to a downtrend.
In simple terms, a bounce can be identified when we are able to identify an area of either Resistance or Support. At this price level there should be about 3 or 4 bounce of the line.
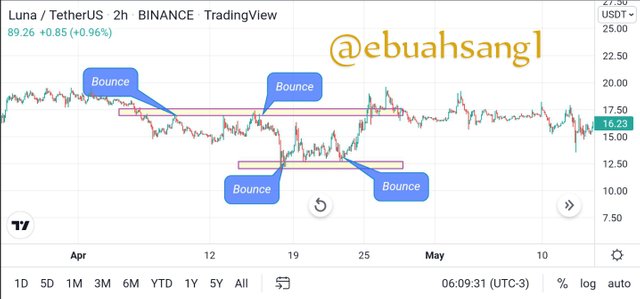
From the screenshot above we can see how price bounce of the Resistance zone several times.
Resistance and Support Breakout
Even though the Resistance and Support level are very significant and vital level to identify and trade on a price chart, this is without risk. There is huge risk a support or resistance zone might not be able to stop the movement of price any further. It is in this context that a breakout comes.
A breakout is a situation whereby price movement does not obey the Support or resistance level. That is,a breakout is said to happen when price breaks below a Support zone or above the Resistance zone. When this happens we can say there is a breakout. Breakout is always a good trading signal as most times than not, it indicates a trend continuation. There are 2 types of breakouts
- Successful breakout. This is when the breakout of the support or resistance level continuous to the direction of the breakout.
- False breakout. We will discuss the false breakout below.
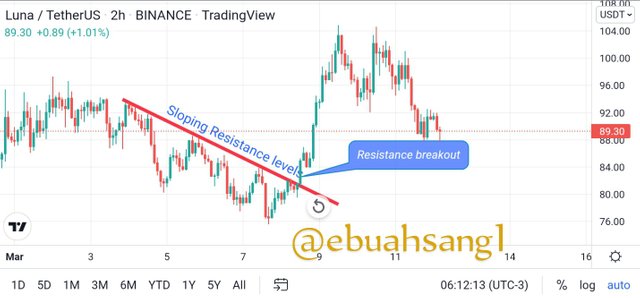
So looking at the screenshot above from trading view, we can see a successful breakout as price moves above the sloping Resistance zone to start a bullish trend.
)

As I mentioned above, there are two types of breakouts, the successful and the False. One of these two is really profitable while the other one isn't. And it's the false breakout. It is therefore very important to know the False breakout and how to identify it.
A false breakout can therefore be defined as situation when the movement of price above a Resistance level or below the support level has failed. The false breakout therefore implies that immediately after price break the level, instead of continuing it changed it direction to reverse to the opposite direction. A false breakout is usually caused by whales in the Market so as to opens positions for them thereby causing liquidity trap. Lemme use the image below to identify a false breakout.
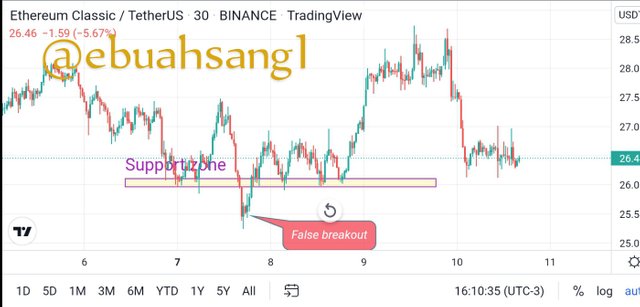
As you can see from the image above, there was a false breakout below the support level. Price which had broken the support zone immediately reverse afterward leading to a false breakout
It is therefore very important to be able to identify a false breakout. Firstly, to identify a false breakout, traders are advice to be extra careful when a breakout happens. Waiting for the formation of atleast two bullish candlestick can be a good sign that the Breakout is not fake.
Secondly, traders can use the support and resistance strategy in synergy with other technical Indicators like the Bollinger band to filter out false breakout.
)

The main driving force in any market is the ** Law of Demand and Supply**. The interaction between supply and demand is the main determinant of price in that market. So it is therefore important for a trader to be able to identify support and demand zones on a price chart to help identify trading opportunities.
So therefore trend trading while using the law of supply and demand is a strategy that combines price movement to Volume. The law of Supply and Demand states that, an increase in the price of a financial asset is cause by an increase the the demand for the asset while an decrease in the price of an asset is cause by an increase in the supply of that asset. We can see that, price directly related to Demand and Supply
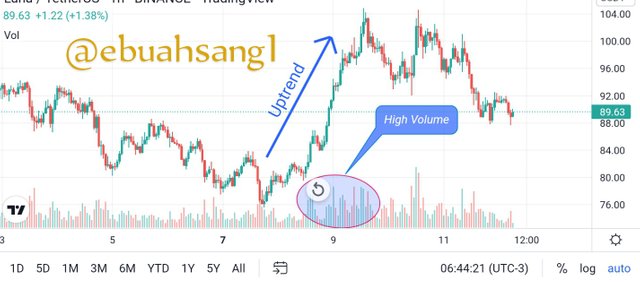
Using the trend trading by combining price and Volume, we notice that in a bullish trend when Market is consistently making higher prices, the Volume in the market is high showing that there is enough force or pressure to keep driving prices upward. Therefore, an uptrend illustrate that the Demand for the asset in the market is higher than supply for the asset and thus increasing price.
Entry and Exit trade Using Final retracement using Elliot wave(a,b,c)
In a trending market using the law of demand and supply we will look out for the ending of a current trend. This indicates that the trend is becoming exhausted and then we expect the formation of a new trend which is a good opportunity to enter a trade.
We can then draw the corrective wave a, b and c of the Elliot wave.
Using this strategy, a entry is identified when the price movement reaches and break above the point a. A horizontal line is drawn from the a point toward the right so that when price touches it, then it is a good entry point. Stop loss or take profit can then be place using a 1:2 ratio. Let's look at the illustration below.
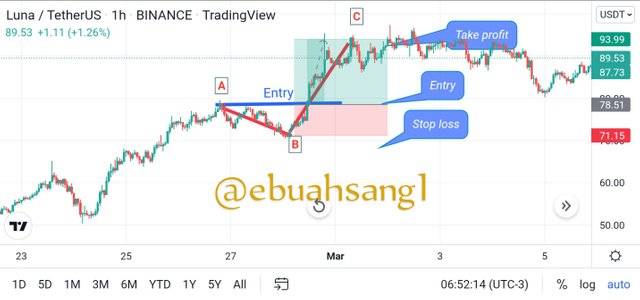
Entry and Exit using a pullback
To trade with the law of demand and supply using the pull back, the market must be in a trend. The trend is therefore supposed to relate with the Volume, that is during a downtrend, the volume is expected to be high with the formation of Bearish candlestick and low with the formation of a Bullish while in an uptrend the reverse should be true. So the volume on each trend indicates the actors in the market.
Using the pull back Strategy to trade, immediately as price crosses above the previous high point in an uptrend after a pullback, then it is a good point to enter a buy trade. We can then place a stop loss at the point of the pullback and then a take profit above the entry price. A 1:2 risk-reward ratio is advice.
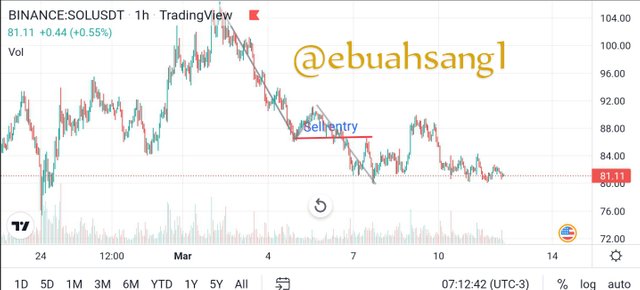
Looking at the image above,we can see that using the pullback strategy, when price reaches the previous high level, then a buy trade can be enter. So the previous high level serves as an entry point.
)

For this trade, I will be using Tradingview platform to do my Analysis and I will carry out a trade order on my verified Binance exchange account.
Buy ALGOUSDT
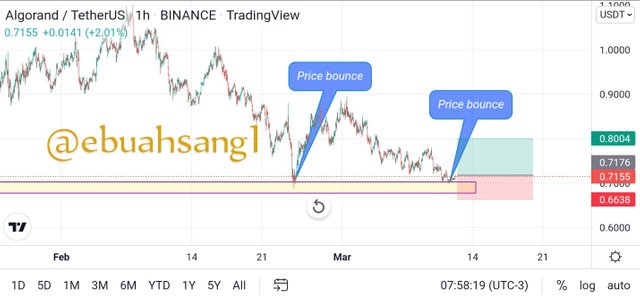
Looking at the movement of price of ALGOUSDT on Tradingview, it can be seen that the market is in a downtrend. I could identify a Support zone as price could be seen to have tested the support zone earlier. This therefore was the lowest point on the price charts in recent days and a mostly significant area to be a support level.
Also looking at the most recent price movement, it could be observed that price was using this area as a Support zone as price is seen to bounce off. For this reason I decided to open a Long position. I placed my Take profit above price at $0.8004 and my stop loss below price at $0.6638.
Then using my Binance verified account, I did a live trade with $10 USDT. Screenshots to prove this transaction can be seen below.

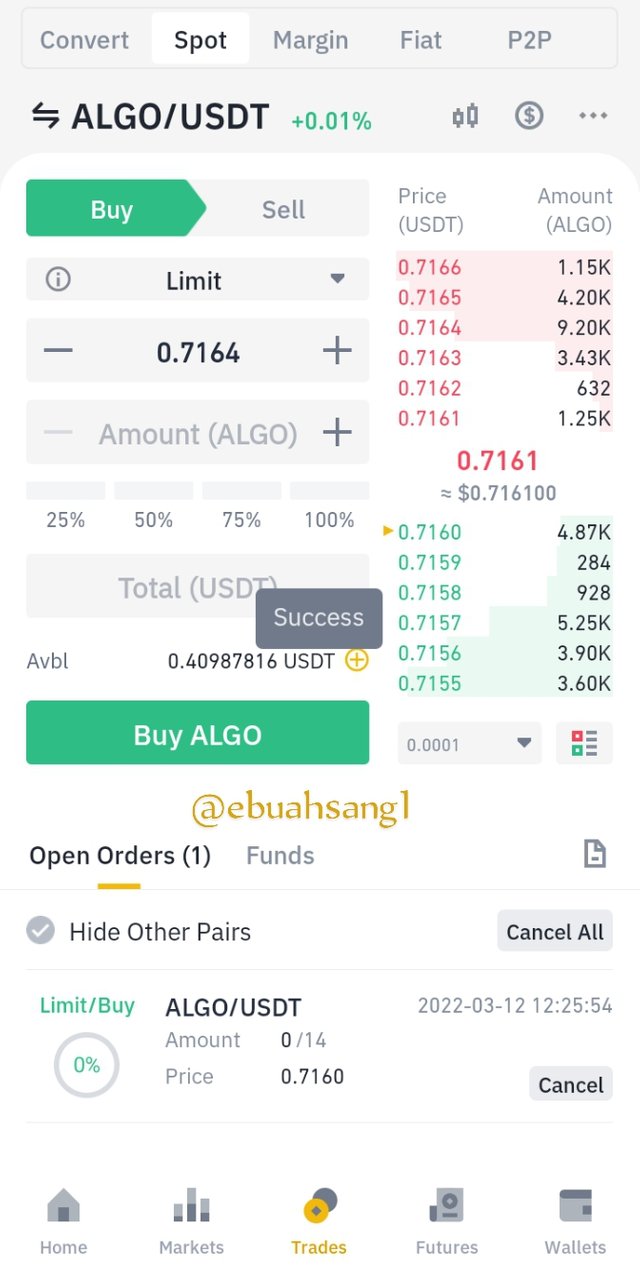
)

From the class and lectures by professor @nane15, we can see that they are various ways of trading in the crypto market. Most of the strategies and method used to analyse and place a trade were price action.
As seen above, Support and Resistance levels are very important levels for traders to note in the market. These levels provide great trading opportunities and a good understanding of it will make a trader to be successful.
I want to thank Professor @nane15. This is my first time of hearing about Round number strategy. It is really helpful strategy in to me.