My very first homework post in the intermediate course level and it is a wonderful experience.
I must say this is the first time I am hearing of the Vortex indicator and honestly I am happy being a part of your class professor. You did justice to the topic. This is my homework post.
1. In your own words explain the vortex indicator and how it is calculated.
Vortex indicator.
Discovered in January 2010 by two Swiss market technician, the Vortex indicator is a technical analysis tool that is being used all over the universe by traders to determine buy and sell position.
Drawing inspiration from the works of J. Welles Wilder, Etienne Botes and Douglas Slepman invented the Vortex indicator. The indicator consist of two oscillating lines that try to capture or identify the positive price movement as well as negative price movement in the market.
The Vortex indicator is a strong indicator of trend reversals especially at points when the lines cross each other.
As earlier mentioned, the Vortex consist of two lines, the +VI which is blue and indicates a positive movement. The -VI which is the red line and indicates negative movement in the Market.
How to calculate Vortex indicator.
There are three fundamental steps or parts in calculating Vortex.
Calculate the positive and negative movement. It's first important to establish the trend movement by measuring the distance between the high and lows of current and previous periods.
Determine the time range. Choosing a timeframe is the next step and it is dependent on situation of the market. A good time period to use is the 14 period but other useful periods include 28, 7 or 30.
Calculated the true range. The true range is calculated by subtracting the current low from the current high, then subtract the the previous close from current high as well as current low.
2. Is the vortex indicator reliable? Explain
To me, I think the Vortex indicator is a reliable indicator for traders to use in the market.
However, I think no indicator is completely reliable and that is the reason it is advisable for any indicator such as Vortex to be used in synergy with other indicators. The Vortex indicator can be used alongside indicators like Moving Average Convergence Divergence (MACD), to give a stronger reliability to the Vortex.
3. How is the vortex indicator added to a chart and what are the recommended parameters? (Screenshot required)
In other to answer this question, we will be using Tradingview to illustrate the steps and I will be using my phone so the interface display will be different from that on a PC.
First of all we visit the official website of Tradingview. We will land on the official page of Tradingview view as seen below. At the top left corner of the page, there are three lines.
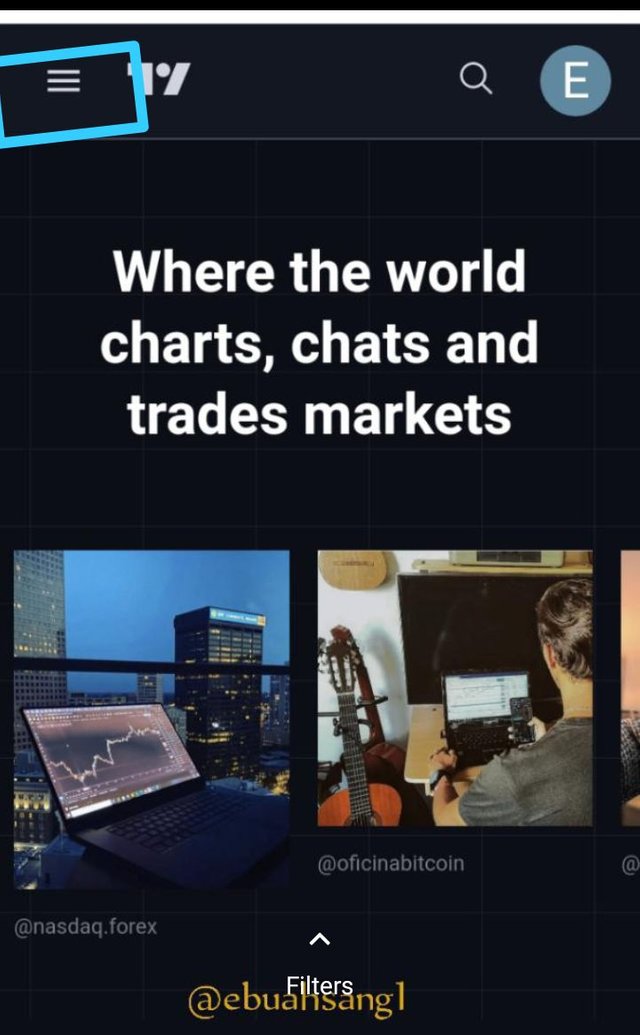
Clicking on the three lines will take us to the next page with a list of features like Chart, Trade, Markets, Screener, Community. We will select Chart.
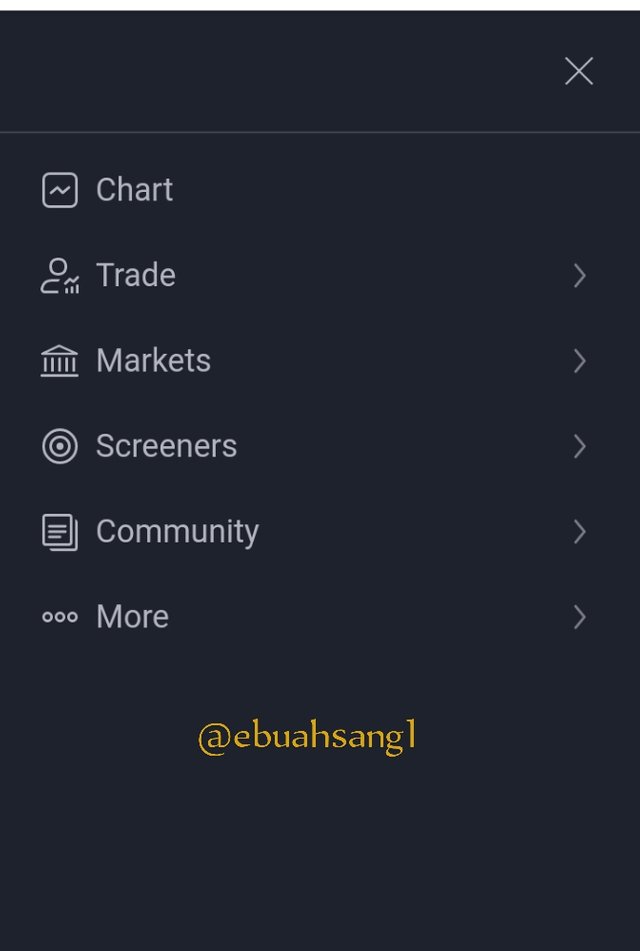
After clicking on charts, a trade will be launched. At the top center of the chart is an icon fx indicators, we will click on it. For the sake of this homework, we will be using TRX/BTC chart.
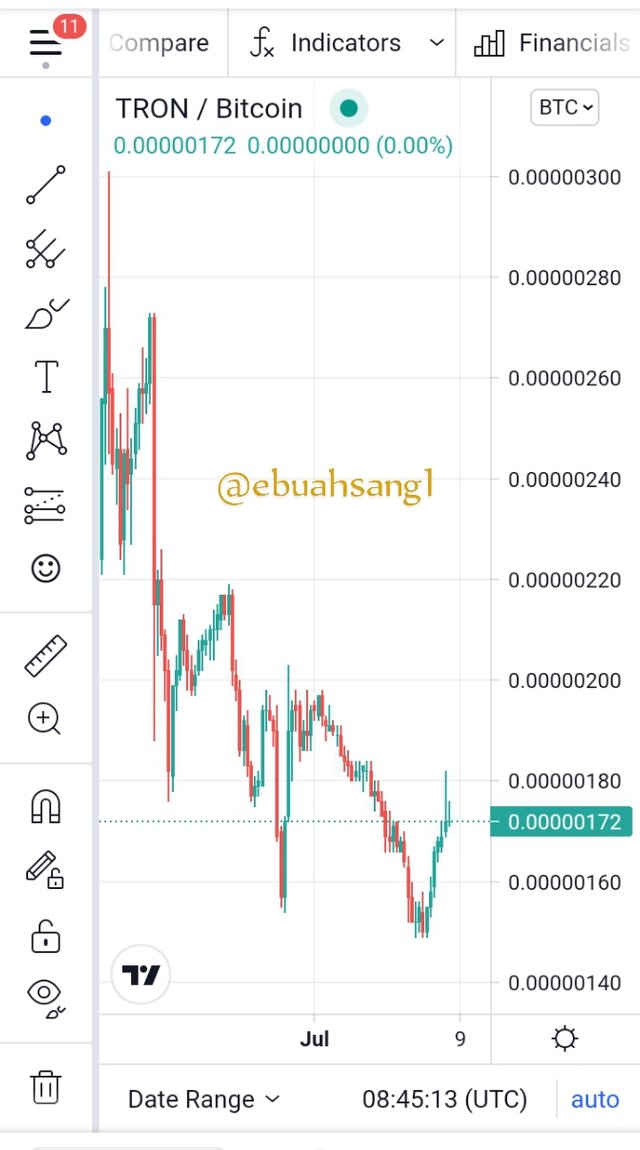
A pop up page will appear, we will choose Built in.
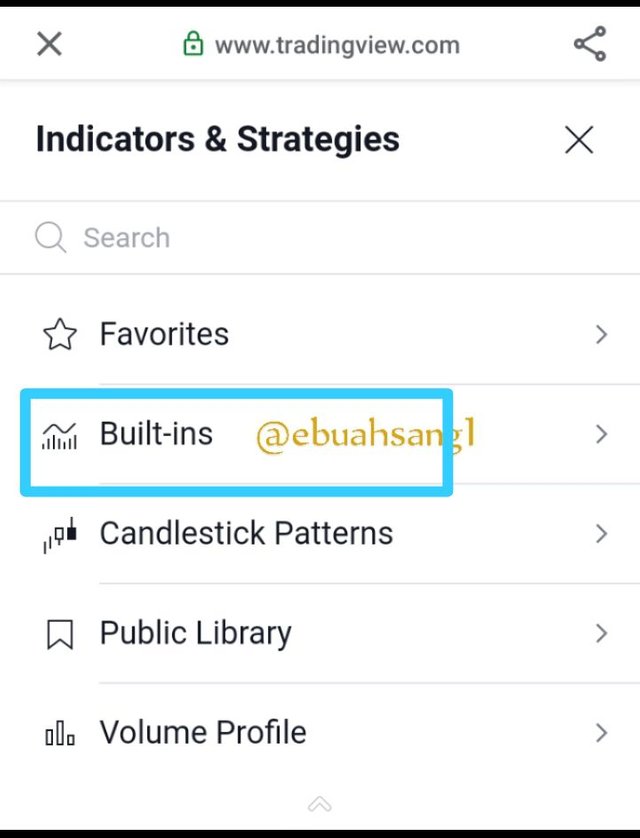
After clicking on Built-in, another pop up page will appear. On the search bar, we will type Vortex and search. Click on it to add it to the chart
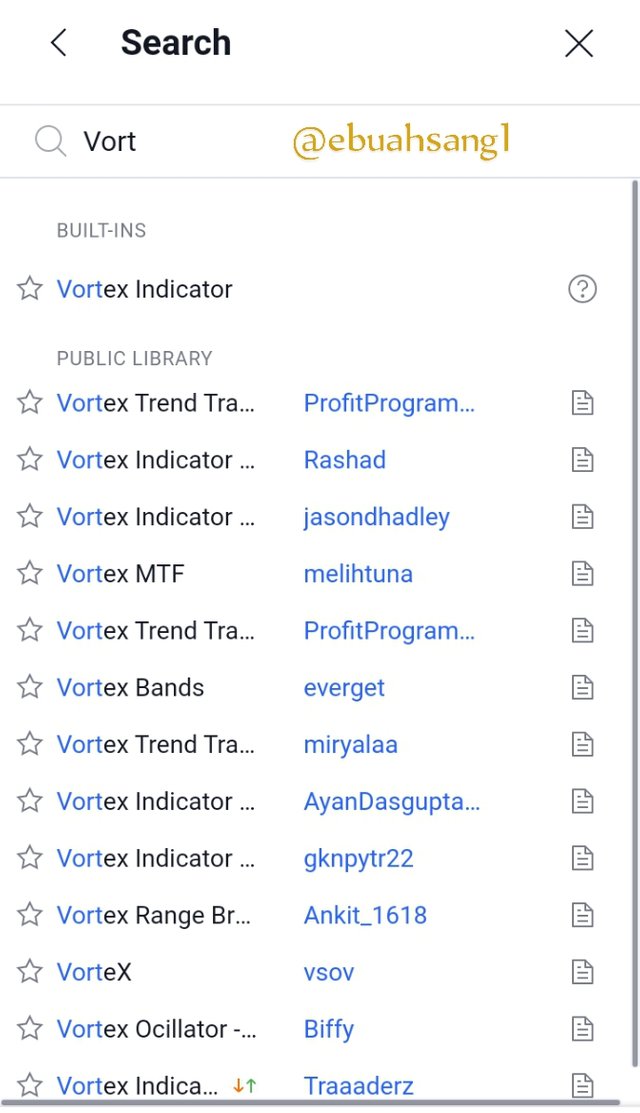
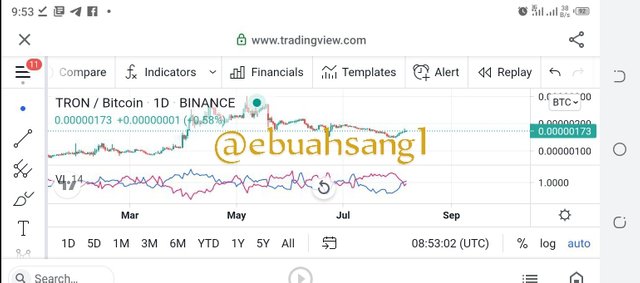
And there you have it as shown above.
Parameters of Vortex.
To add different parameters to the graph/chart, we will click on the VI on the screen.
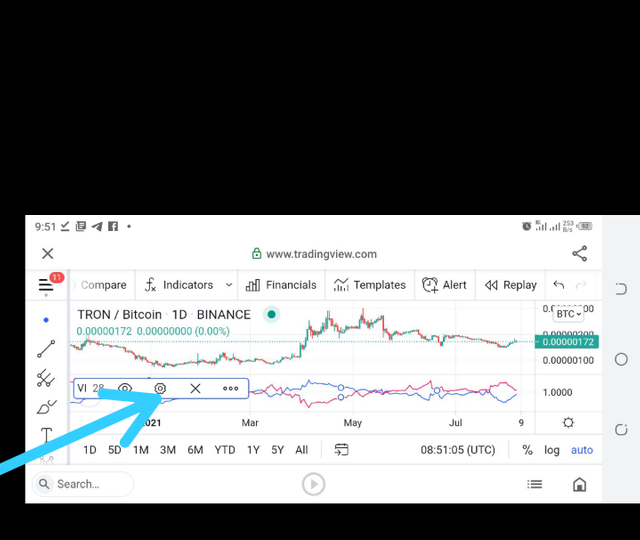
- Click on the setting Icon
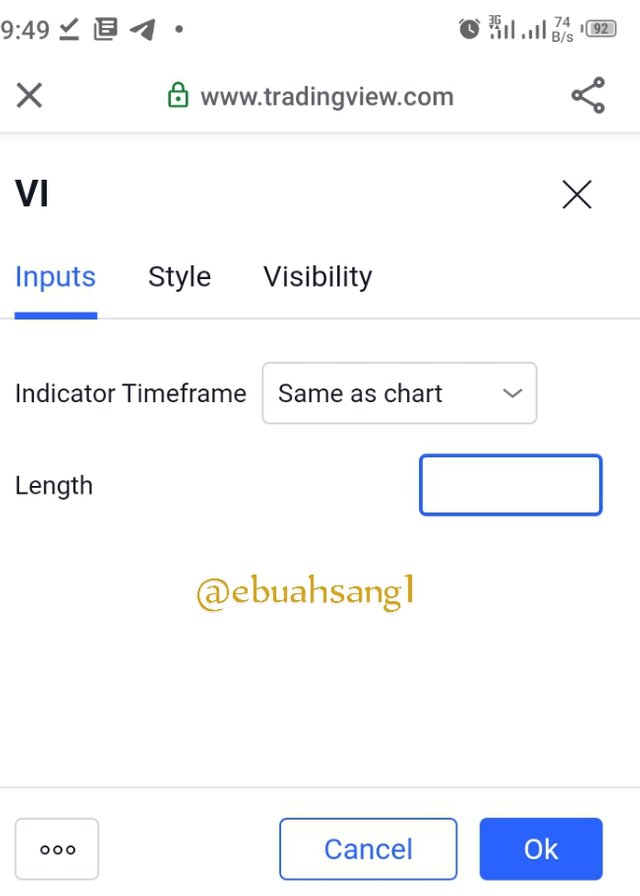
- When you click on the setting icon, a new page will appear having the following headers (see above)
- Input
- Style and
- Visibility.
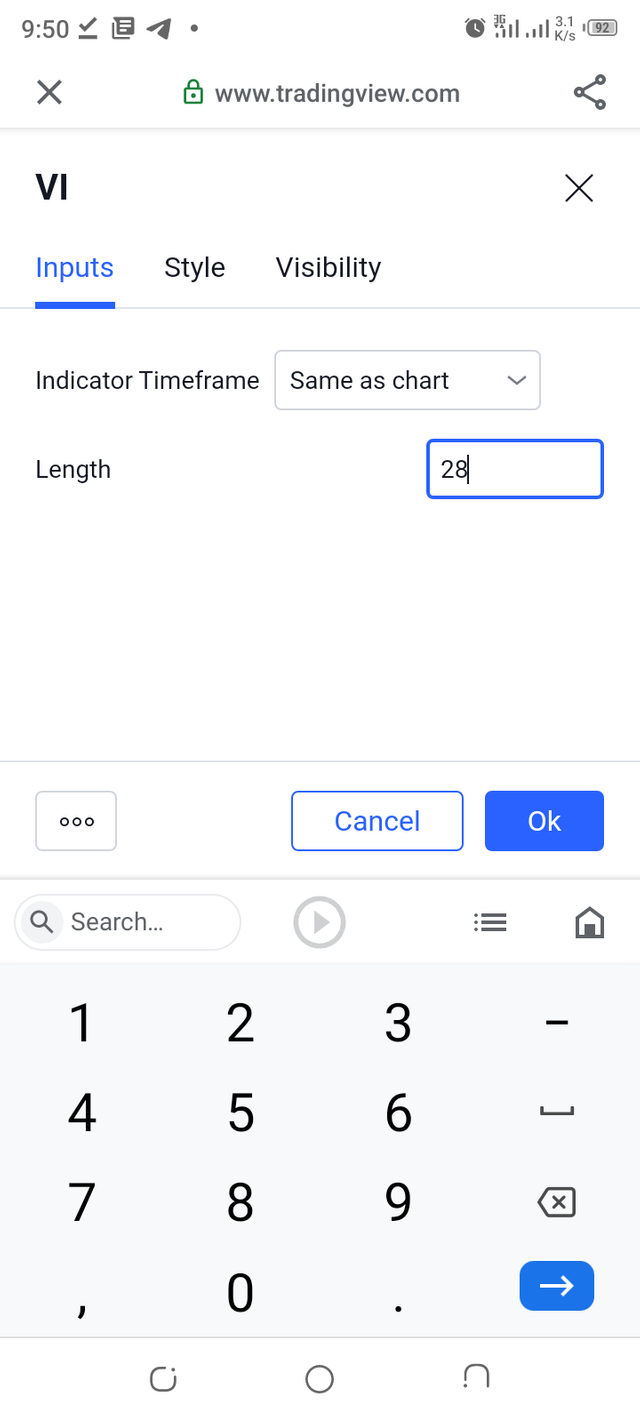
This settings allow us to vary the way we want our indicator to be. - In the input setting, we are going to change the period to 28.
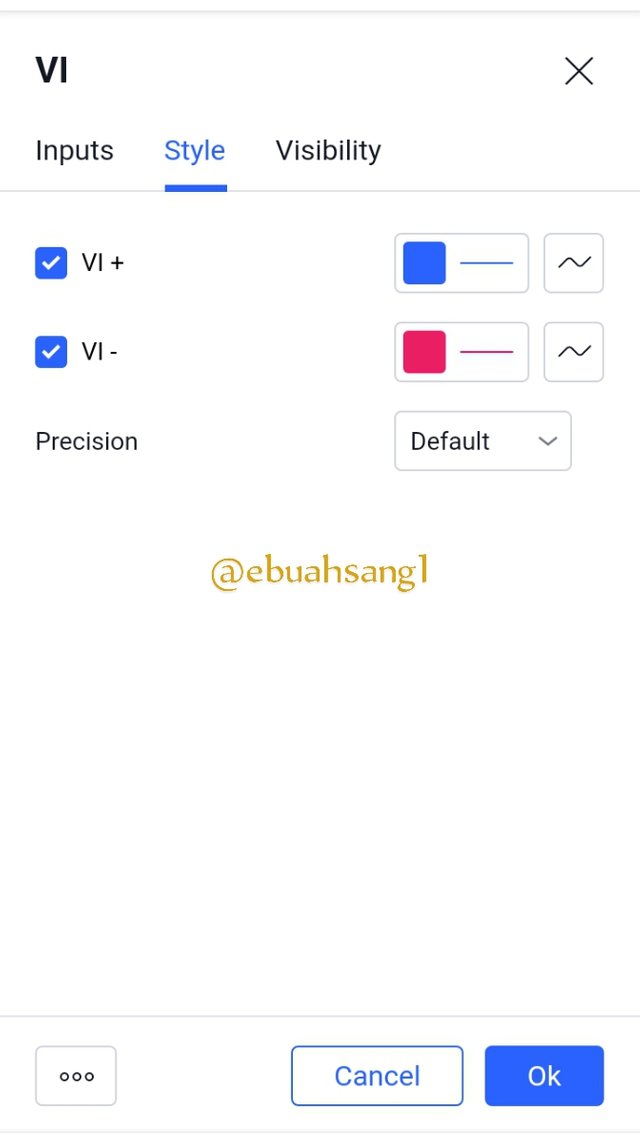
- In the Style setting, we will need to confirm that the +V is blue and -V is red.
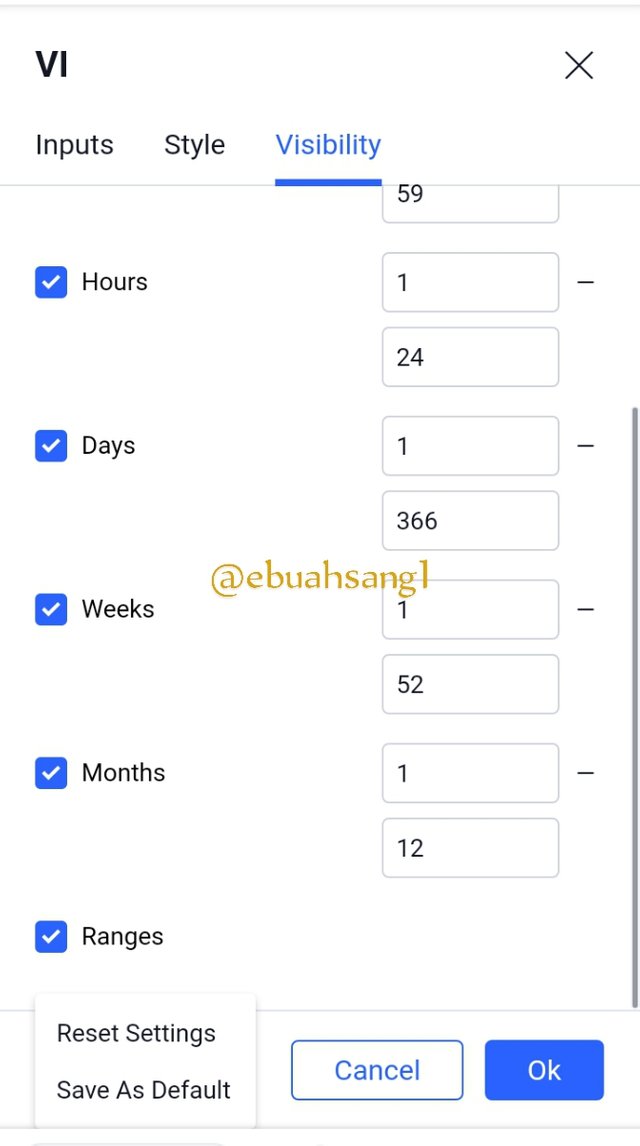
- And in the visibility setting, we are to make sure the settings is default.
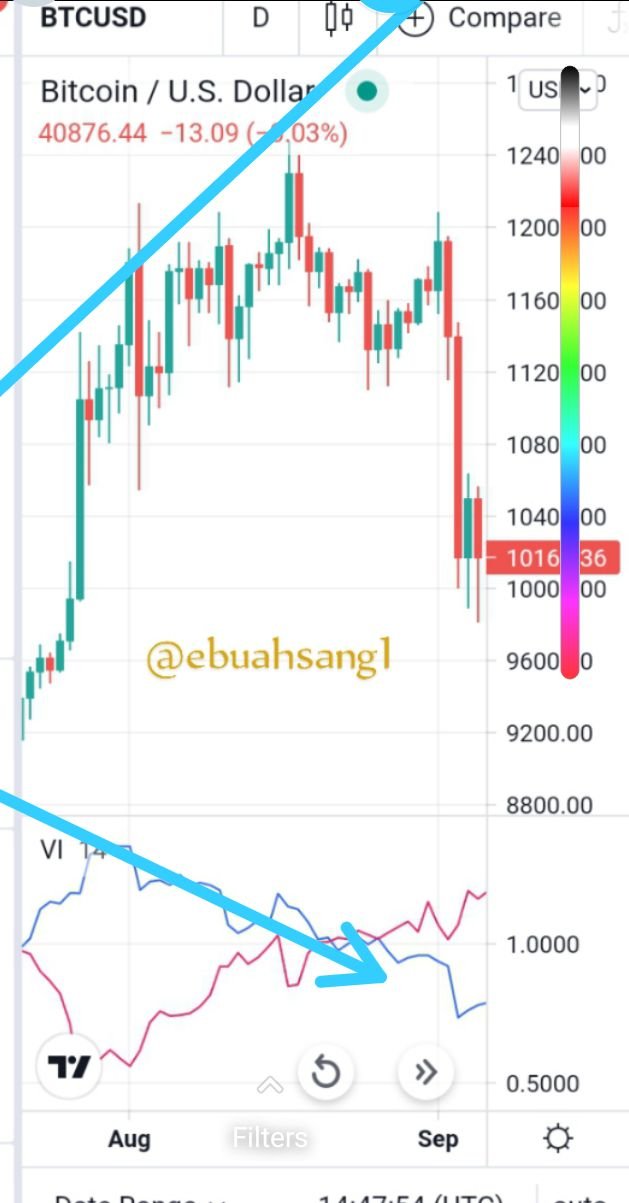
4. Explain in your own words the concept of vortex indicator divergence with examples. (Screenshot required)
Two type of divergence are common in a vortex indicator concept. The Bullish and the Bearish divergence.
Bullish divergence occurs when price movement draws a lower high while the +V blue line is experiencing a higher high. This is a strong buy signal in the market.
And a bearish divergence occurs when price movement draws a higher high while the +V trendline is experiencing a lower high. This is also a sell signal for traders in the Market.
5. Use the signals of VI to buy and sell any two cryptocurrencies. (Screenshot required)
For this Task I will be using the Tradingview demo account to buy and sell these coins, reason being I do not have an account in forex as of now since I am still learning how to trade the forex market.
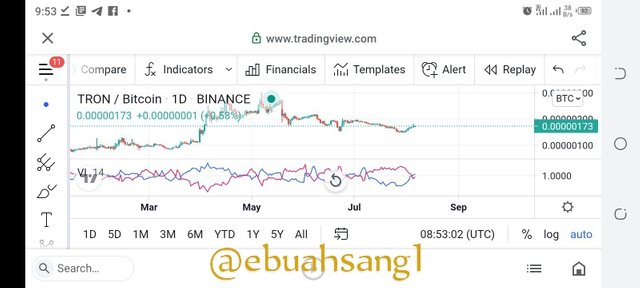
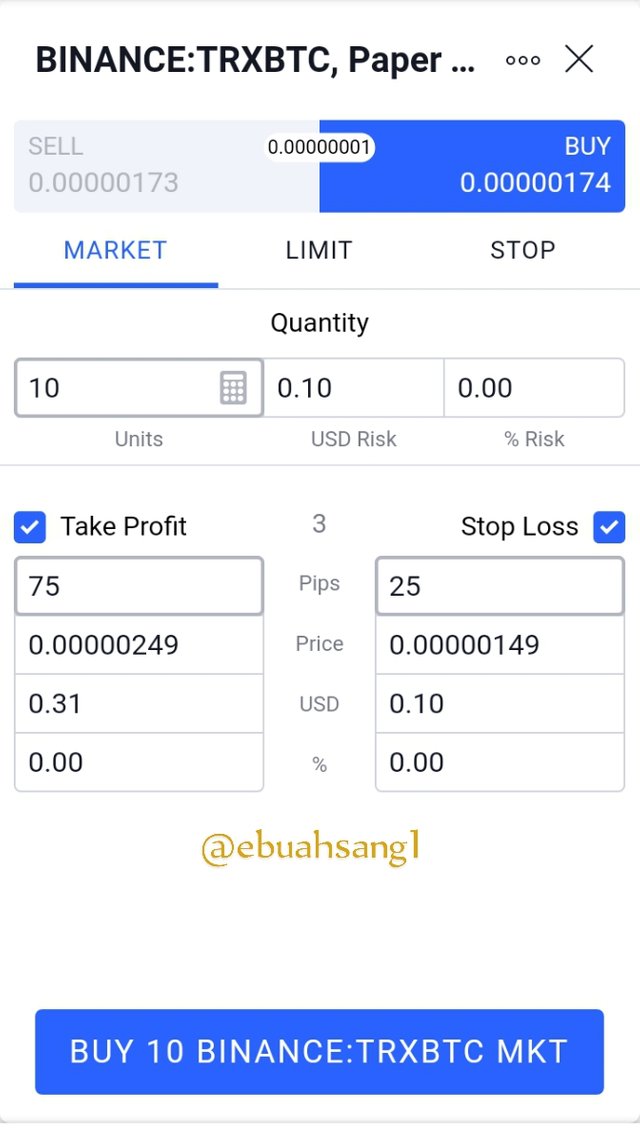
TRX/BTC
For the buying I will be buying Tron. As can be seen on the graph, the blue +VI trendline just crossed the red trendline. This is a bullish signal especially as the price movement is positive.
CAKE/BTC.
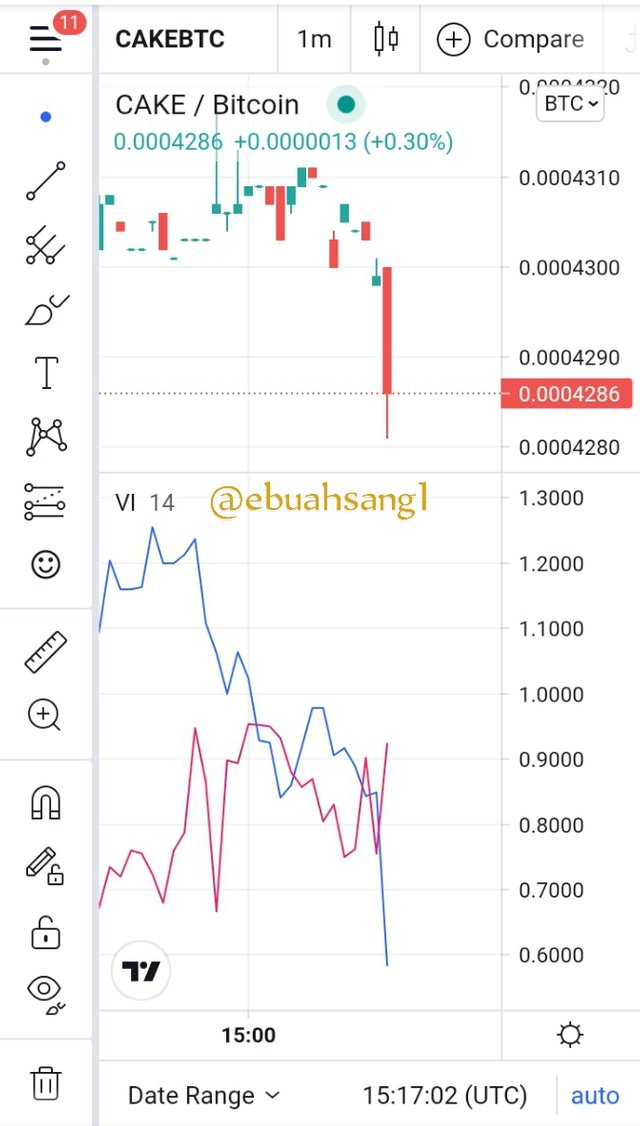
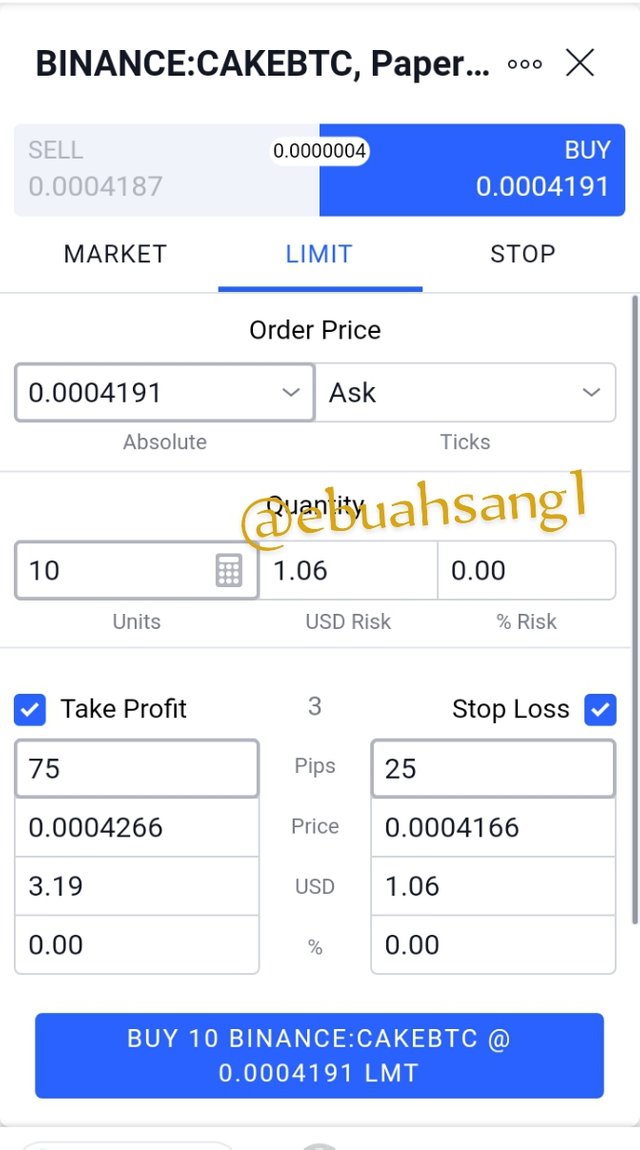
I will be selling cake. Using the Vortex indicator, the graph shows that the -VI trendline just crossed above the +VI line, indicating bearish market and a strong sell signal. So I decided to sell the coin. So I place a sell order of $10.
Conclusion.
Vortex indicator might just be 10 years old, but from the lectures I have received, and research I believe it is going to be a pretty amazing technical analysis tool.
It's has more accuracy In predicting trend reversals especially when it is used in synergy with MACD.
I do believe a detail understanding of this tool is going to help me in my trading decisions in the future. I want to especially thank prof @asaj for this beautiful lesson.
CC
professor @asaj
Good job @ebuahsang1!
Thanks for performing the above task in the sixth week of Steemit Crypto Academy Season 3. The time and effort put into this work is appreciated. Hence, you have scored 7 out of 10. Here are the details:
Remarks
You displayed a good understanding of the topic. However, task 4 could use a bit of more originality. Bitcoin isn't the only existing cryptocurrency. Quite a majority of participants have already used Bitcoin in their examples.
Downvoting a post can decrease pending rewards and make it less visible. Common reasons:
Submit
Thank you professor. I will do the corrections . Especially the Bitcoin example.
Downvoting a post can decrease pending rewards and make it less visible. Common reasons:
Submit