
)

It is common knowledge in the world of financial market trading using technical analysis that no single technical indicator is a standalone tool for trading. Every indicator no matter how good it is has it limitations and weaknesses. That is why thousands of technical indicators and methods are developed daily. The Triple Exponential Moving Average Indicator is one of such indicator that seeks to smoothen out the lagging nature of the Moving Average indicator.
Triple Exponential Moving Average denoted TEMA is a technical indicator that is being used worldwide by traders in the financial market. TEMA helps to identify trends and trading opportunities in the market by smoothing out price fluctuation in the market. TEMA tries to reduce the lag that is associated with the Exponential Moving Average (denoted EMA) by combining three(3) different EMA and subtracting the lag. Thereby reducing the fluctuation in prices that are noticed from using the EMA.
The TEMA is more responsive to recent data and price changes as it gives more weight to recent price movement. This has made the TEMA to be more suitable for short term and day traders who use it to confirm trends or spot trend reversals (changes) in the Market. So the TEMA can be used to
- Confirm Trends
- Identify changes in Trends or reversal
- Identity or provide key Support and Resistance levels
- Identify/spot Entry and/or Exit points in the Market.
The TEMA was developed by Patrick Hulloy in the early 1990s , that is 1994 to be precise after developing the DEMA. He hoped to further reduce the lagging effect that was present in the DEMA and other Moving Average indicators.
As we earlier mentioned, the TEMA is calculated by combining multiple EMA and subtracting the lagging. The formula is
Formula for Calculating TEMA
TEMA = (3 × EMA1) - (3 × EMA2) + EMA3
Where;
TEMA= Triple Exponential Moving Average
EMA= Exponential Moving Average
EMA1 = EMA of price
EMA2 = EMA of EMA1
EMA3 = EMA of EMA2
The following steps are used to calculate TEMA
- First choose the period to use
- Calculate the Exponential Moving Average for the period
- Calculate the Exponential Moving Average of the EMA1( the EMA calculated in step 2 above)
- Calculate the Exponential Moving Average of EMA2(the EMA in step 3 above)
- Put values of the various EMA calculated from steps 2 to 4 above in the TEMA formula.
Most people misinterpret the Triple Exponential Moving Average name to mean using 3 different EMA. Which is not the case here, we are to use just one EMA with a single timeframe and keep subtracting the lag.
We will use Tradingview platform to add the TEMA Indicator to a chart. We will also be using the DOTUSDT price chart.
- Step 1. Visit Tradingview platform through the official link. https://www.tradingview.com/chart/JH4xDiC3/.
At the top left corner of the screen there are 3 bars, click on it and a list will appear, choose Charts which is the first thing on the list.


- Step 2. Add the Indicator. To add the TEMA Indicator to the chart, click on the Indicator button at the top of the chart page.
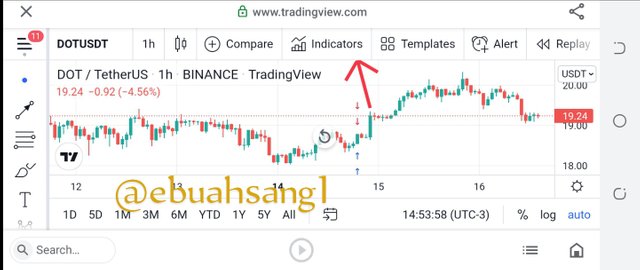
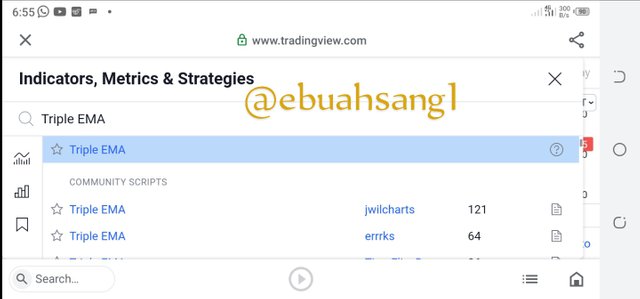
- Step 3. After clicking on Indicator, a page will pop-up. Type in the Triple Exponential Moving Average and then click on Triple EMA.
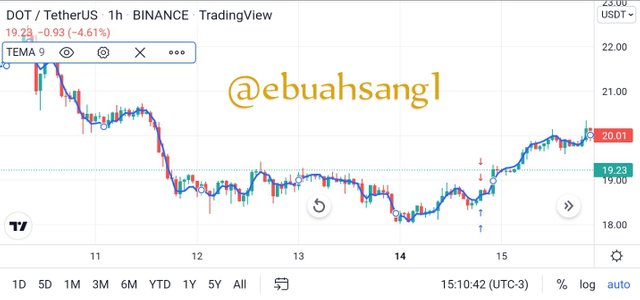
- Step 4. Tada! As can be seen from the screenshot below, TEMA has successfully been added to the chart with the default 9 period.
Settings of TEMA.
We can vary the outlook of the way TEMA appears on the chart. To do this, we can follow the steps below.
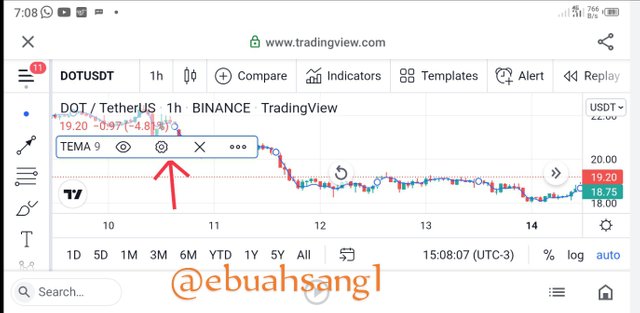
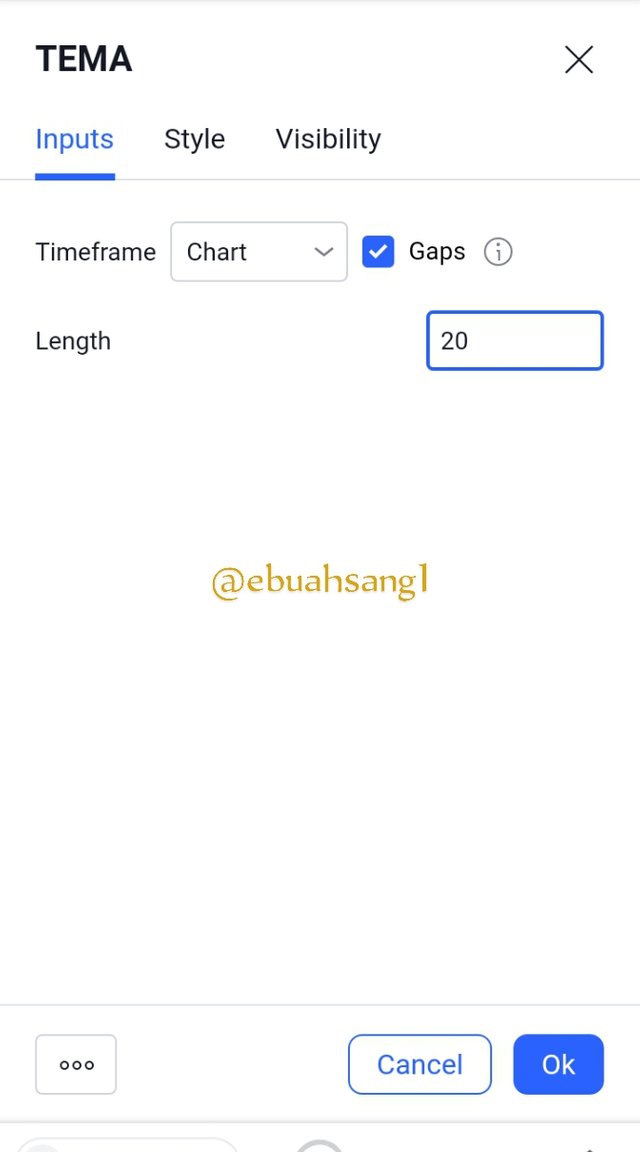
- Step 1. Click on the Setting icon on the TEMA Indicator. This will take you to the various settings of TEMA. We can change the input, visibility and style
- Step 2. Input setting. In the input setting we can change the period of the TEMA Indicator. I changed the period to 20.
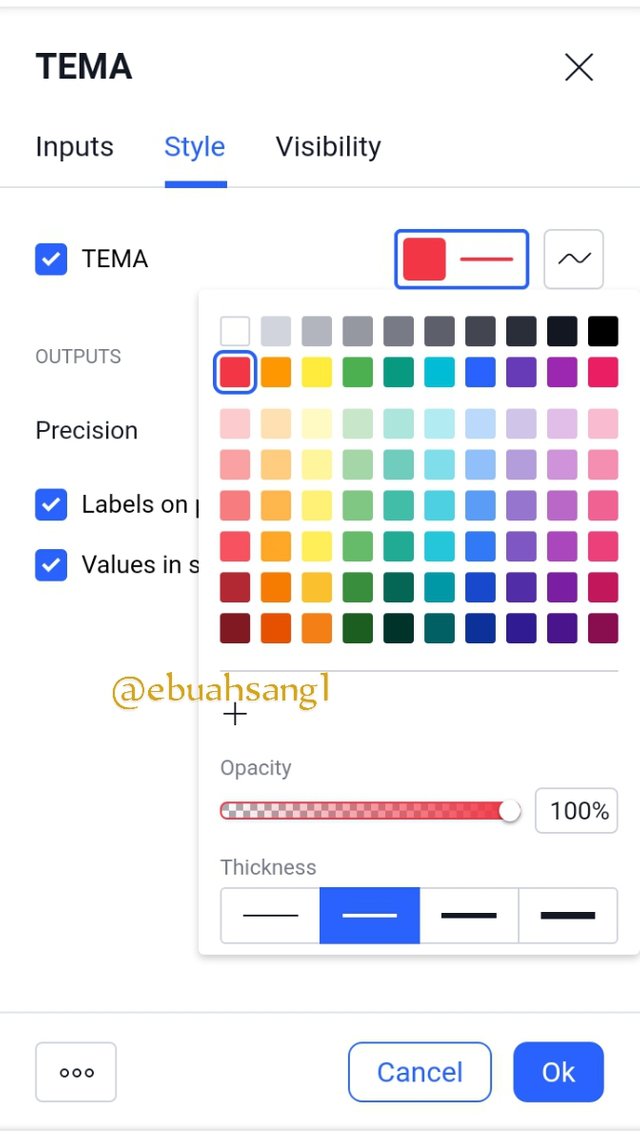
- Step 3. Style setting. The visibility refers to how we see the Indicator. We can change the color of the Indicator and the thickness. I decided to change the color to red.
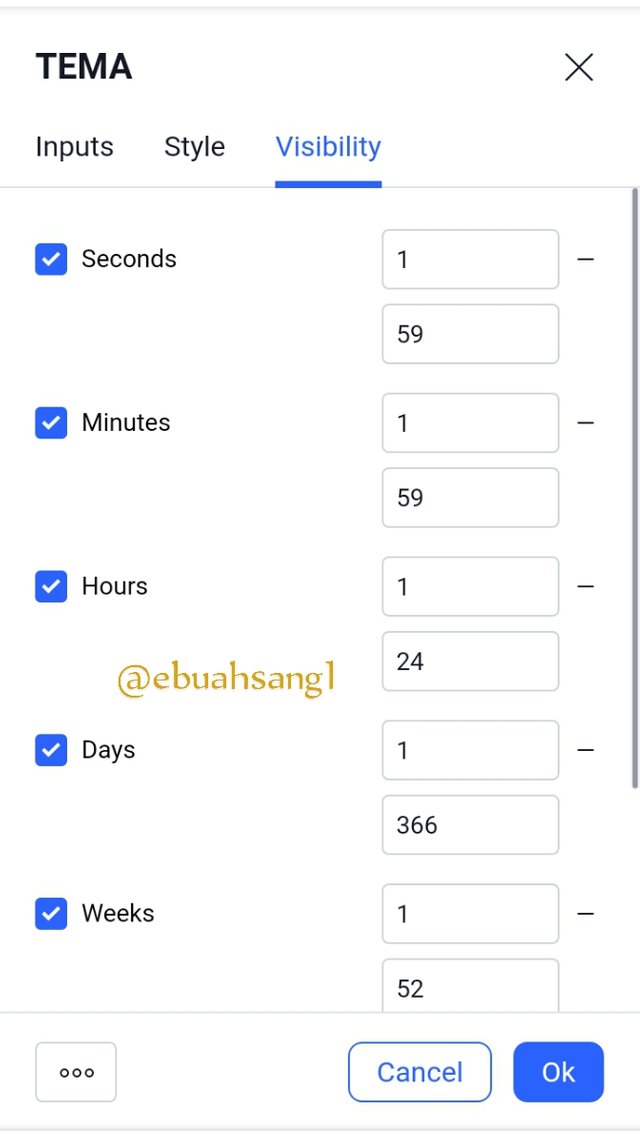
- Step 4. Visibility Setting. Here we can change the seconds, minutes, hours or time range as we deem necessary. I decided to maintain the default settings here.
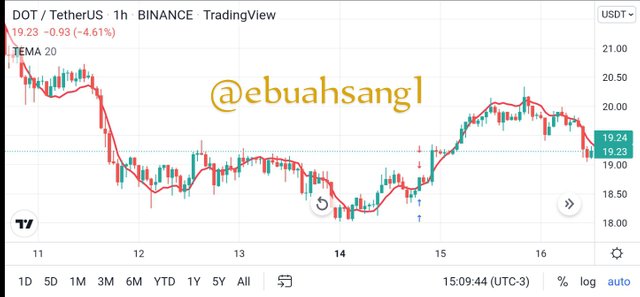
After applying the above changes, I clicked on ok and as we can see from the screenshot below, the settings have applied on the Indicator.
TEMA is just one of the types of Moving Average indicator that we have. There are several of them here. I will be using for this comparison, the Simple Moving Average and the Exponential Moving Average.
Comparing TEMA, EMA and SMA.
| TEMA | EMA | SMA |
|---|---|---|
| More responsive to price changes as compared to other Moving Average indicators | Less reactive to price changes as compared to TEMA | Not reactive to price changes as the same weight is given to price. |
| Good for scalpers and day traders who are interested in short trades | Also good for short term trades but not as good as the TEMA | Good for long term trades and traders as equal weight is given to price over a period of time |
| TEMA is more concern with recent price changes and reflects present Market situation | EMA doesn't place as much emphasis on recent Information | SMA concentrate more on Historic data of price |
| TEMA is calculated by taking multiple EMA and subtracting the lagging factor | EMA is calculated by Multiplying SMA with the Multiplier | SMA is calculated by combining data point for price movement over a period of time divided by the period. |
| TEMA acts as a Support line during Uptrend | EMA acts as a Resistance line during downtrend | SMA acts as potential resistance line during downtrend. |
Graphical illustration of the difference
To properly illustrate the differences between the TEMA, EMA and SMA, we will add the Indicators to a single chart. We will used the same timeframe and period for the analysis.
Timeframe will be 4 hours while the period will be 50.
From the screenshot above, it can be seen that the blue TEMA line is closer to the price movement and follows it more closely than rhee SMA or EMA. It reacts to price changes faster and provides support. The TEMA Indicator acts as Support line during and uptrend while the SMA (Red line) and the EMA (green line) lines acts Resistance line during a downtrend.
As we earlier explained above, the Moving Average indicators are all Trend based indicator. They just vary with with the way they identify trends. TEMA is no exception to this rule, TEMA is used by traders to identify and not only identify but confirm trends in the market. In this section/question, I will be explaining how we can use TEMA to identify and confirm trends.
Bullish Trend Identification/Confirmation Using TEMA
To identify trend using TEMA, the price and the TEMA Indicator/line must be moving in the same direction, in this case, in an upward direction.
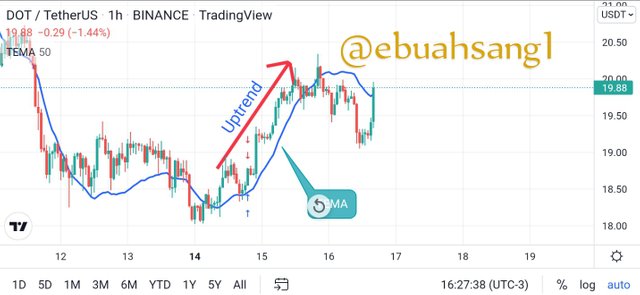
To confirm the trend movement, the TEMA Indicator should be below the price and possibly providing support levels.
We can see from the image below that price is in an uptrend with TEMA Indicator and to confirm the trend movement, price is above TEMA.
Bearish Trend Identification/Confirmation Using the TEMA Indicator
To identify a bearish trend movement, price and the TEMA Indicator should be moving together in a downward direction.
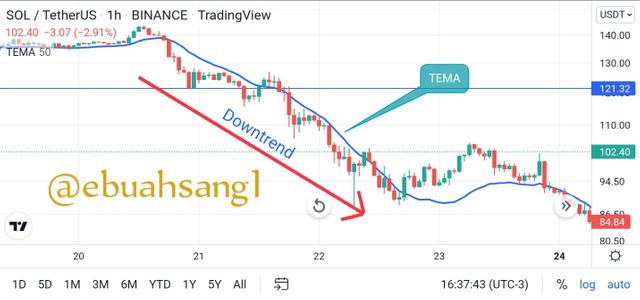
For confirmation of a bearish trend, the TEMA Indicator should be above the price movement. Looking at the screenshot provided above, we can see that price and the TEMA Indicator are moving in the same direction, further more for confirmation, price is below the TEMA line.
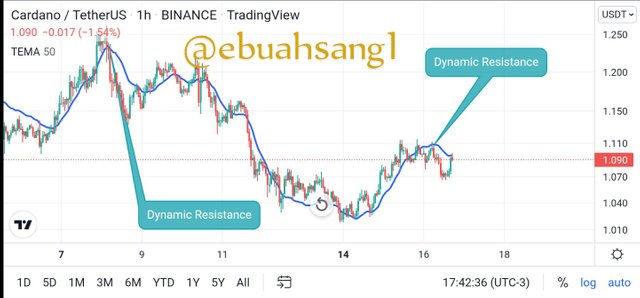
TEMA also serve as support and resistance levels when used in chart. The dynamic resistance and support levels provided by TEMA is very essential as it signal trading opportunities in the market. The dynamic Resistance or Support level indicate potential trend reversals.
Support levels
TEMA usually serve as a dynamic support levels to price in a downtrend. This is usually a bullish trend reversal signal and a good position to enter a buy trade as price is expected to reverse. In this case when price approaches the TEMA line, it tends to bounce off the TEMA line Signal a potential reversal.
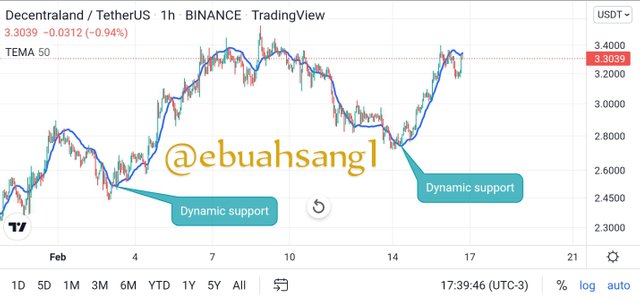
Resistance level
Contrary to the support support levels, TEMA provides a resistance level during a Bullish uptrend. This occurs when during a Bullish run prices move down to tye TEMA line and instead of providing a support, the TEMA line resist the the price. This usually signals a bearish trend reversal and a good position to enter a sell trade or exit a buy position.
One of the greatest and most used strategy of Moving Average is combining two different Moving Average. The combination of two Moving Average be it the same type of different types of Moving Average usually give great trading signals.
In this section we are going to be combining two TEMA Indicators using different periods on the same chart to identify trading opportunities. One of the TEMA will have a shorter period while the other will have a longer period. Usually, the shorter period TEMA is more sensitive to price and moves closely yo price than the shorter timeframe.
For this illustration, I will be using the 50 TEMA period and the 100 TEMA on a 1hour timeframe. When using the two different period, the following conditions can be made.
Buy Entry
When using two TEMA, a buy opportunities is presented when
- The faster TEMA in this case 50 TEMA crosses above the 100 slower TEMA.
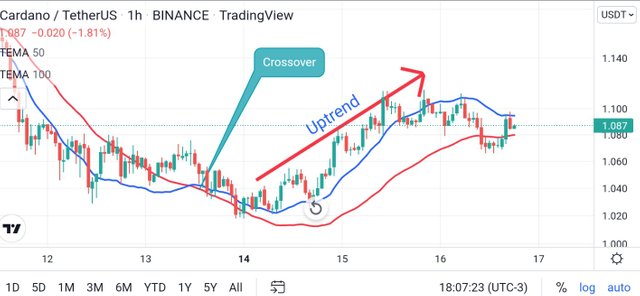
As seen from the screenshot above, the 50 TEMA line (blue) crosses over the 100 TEMA line(red line), the Market is in an Uptrend.
Sell Entry
On the other hand, a sell entry occurs during a Bullish trend. When fast 50 TEMA line crosses and goes below the 100 TEMA line, then it is a good signal for a sell order.
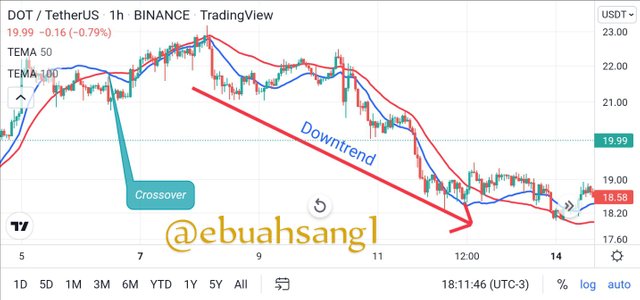
As can be seen from above when the blue 50 TEMA line crosses below the red 100 TEMA, this is signal for downtrend and you can see that price is in a downward trend.
When using a combination of two TEMA with different periods, a Cross over is a great signal for a trade depending on the direction of the crossover.
To every trading indicator and strategy, there are rules to follow in order to successfully execute a trade. Thee following are criteria required to Enter or Exit a trade using TEMA.
Buy Entry and Exit
Use two TEMA with different periods. The first criteria is to use 2 TEMA. I will use a 50 abd a 100 period
The market should be in a downtrend. Then wait for the fast 50 TEMA to cross above the slow 100 TEMA.
When the cross over occurs, wait for two candlestick confirmation to form. If the candlestick are bullish then place a by trade.
Exit. For trade exit, the Stop loss should be place below the price while the Take profit above. A risk reward ratio of 1:2 is advisable.
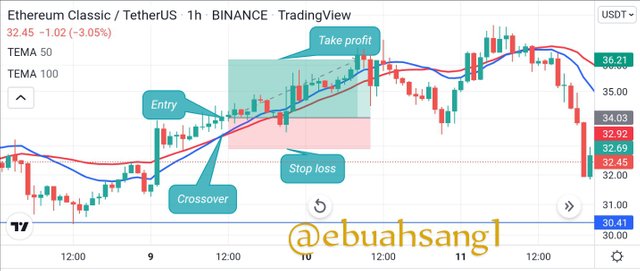
The image above is a graphical representation of the conditions necessary for buy entry using ETCUSDT including the stop loss and take profit points.
Sell Entry and Exit
The following criteria is to be fulfilled to place a Sell trade.
Use two TEMA Indicators in this case 50 and 100 TEMA.
Crossover. The crossover in this case contrary to the buy entry, should be during an uptrend. We then wait for the slow moving 100 TEMA to crossover the fast 50 TEMA. When this happens, it signals a bearish trend reversal.
Confirmation. When the crossover occurs, we then wait two candlestick after to confirm the a downtrend. This usually required formation of two bearish Candlestick.
Exit. For Exit, Stop loss should be place above the price while Take profit is To be placed below the price. A risk reward ratio of 1:2 is advisable.
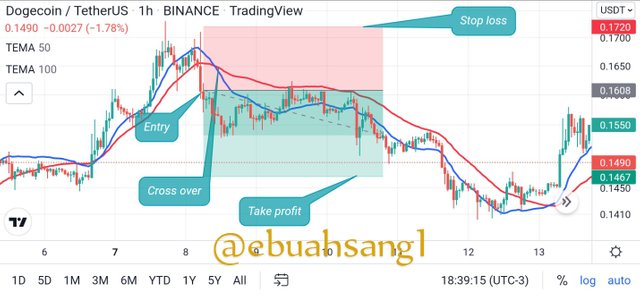
The above screenshot is a representation of the criteria for a Sell entry and exit using the DogeUSDT chart.
TEMA Indicator and RSI.
For the purpose of answering this question, I will be using the TEMA Indicator in synergy with the RSI indicator.
Usually the RSI indicator is made up of a range from 1-100. When the Indicator is above 70, it signals an oversold position and a potential bearish trend reversal while below 30 indicates oversold positions and potential uptrend reversal.
Now when combining the TEMA Indicator and the RSI, the following criteria will be required to place a trade
Buy trade.
For a buy trade,
- The RSI will need to be below 30 in the oversold zone.
- The Two TEMA Indicator needs to cross over with the shorter TEMA crossing above the slower TEMA.
Buying SOLUSDT.
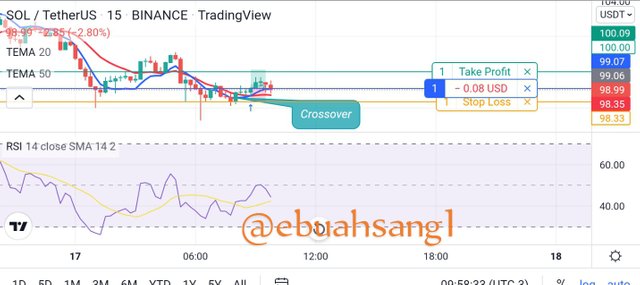
From the screenshot above, using the 15minute timeframe we can observe how the fast 20 TEMA crosses above the slow 50 period TEMA. This is a good position to place a buy trade and that's why I decided to place a buy order. Taking into consideration the stop loss and take profit positions.
Stop loss below price at $98.35
Take profit above price at $99.07
Entry at $98.99.
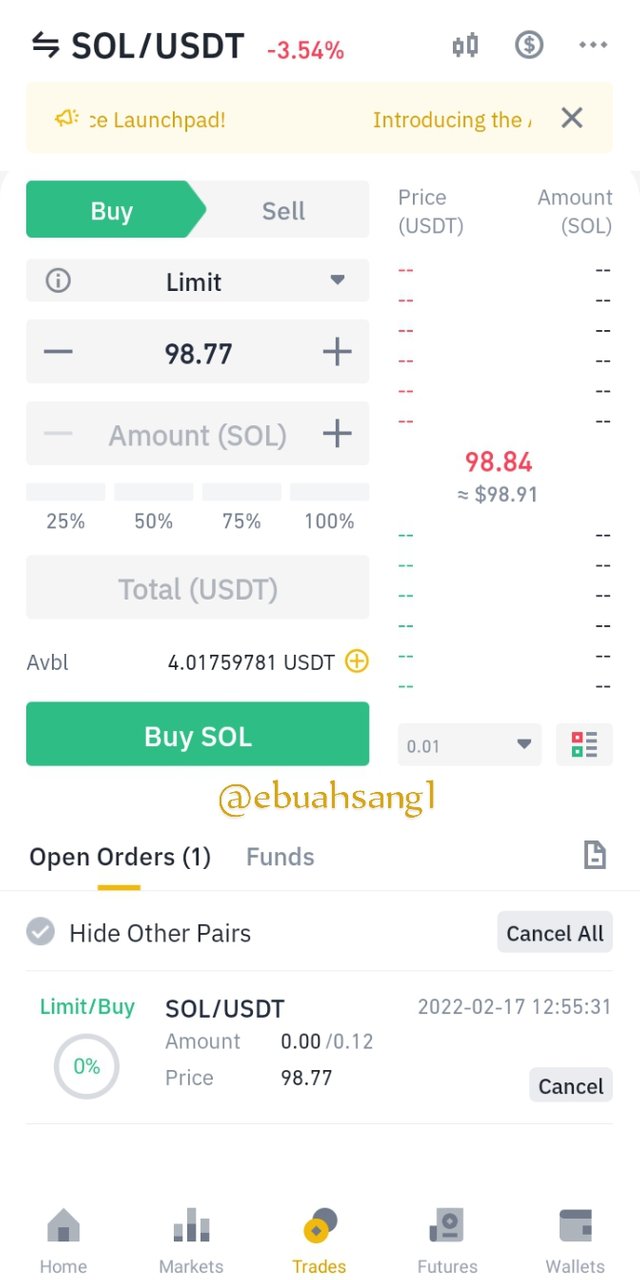
Using Binance to do a real trade base on the Analysis from Tradingview
Sell Trade
For a sell trade, the following criteria is required
The RSI indicator should be above 70 in the overbought zone.
Crossover. There should be a crossover between the two TEMA with the faster TEMA crossing below the slower TEMA.
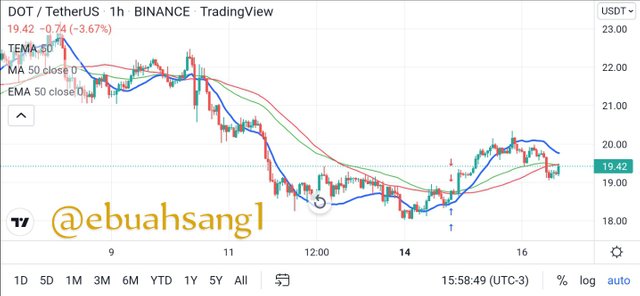
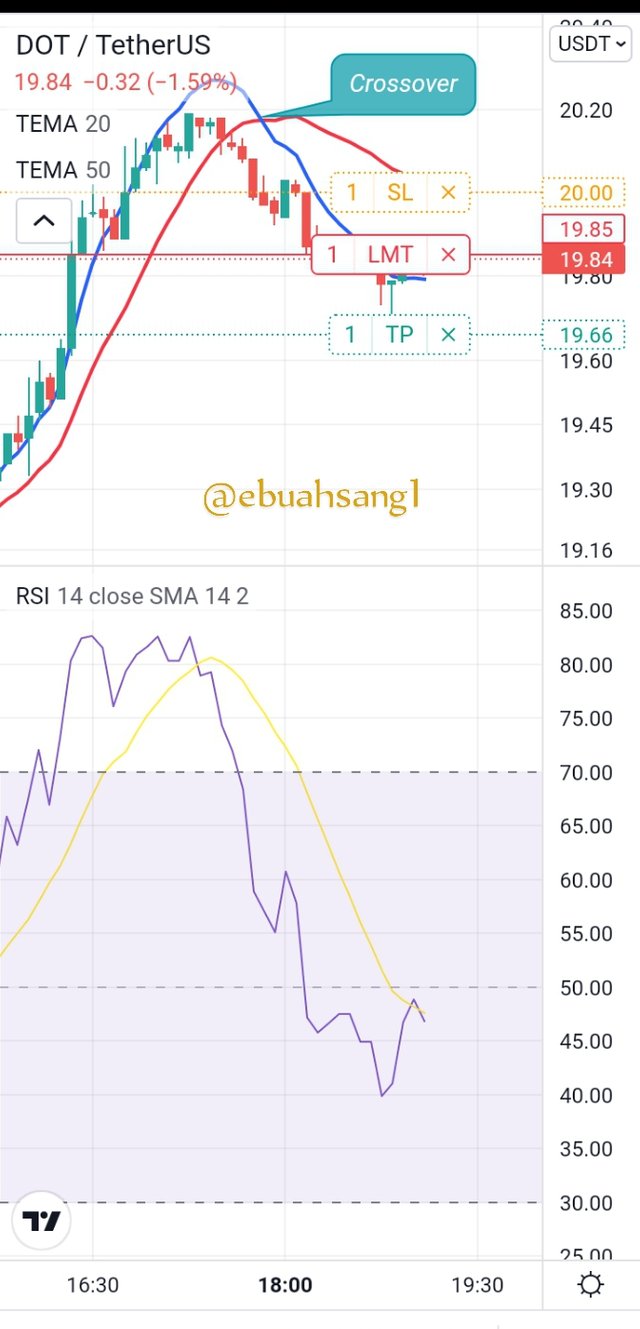
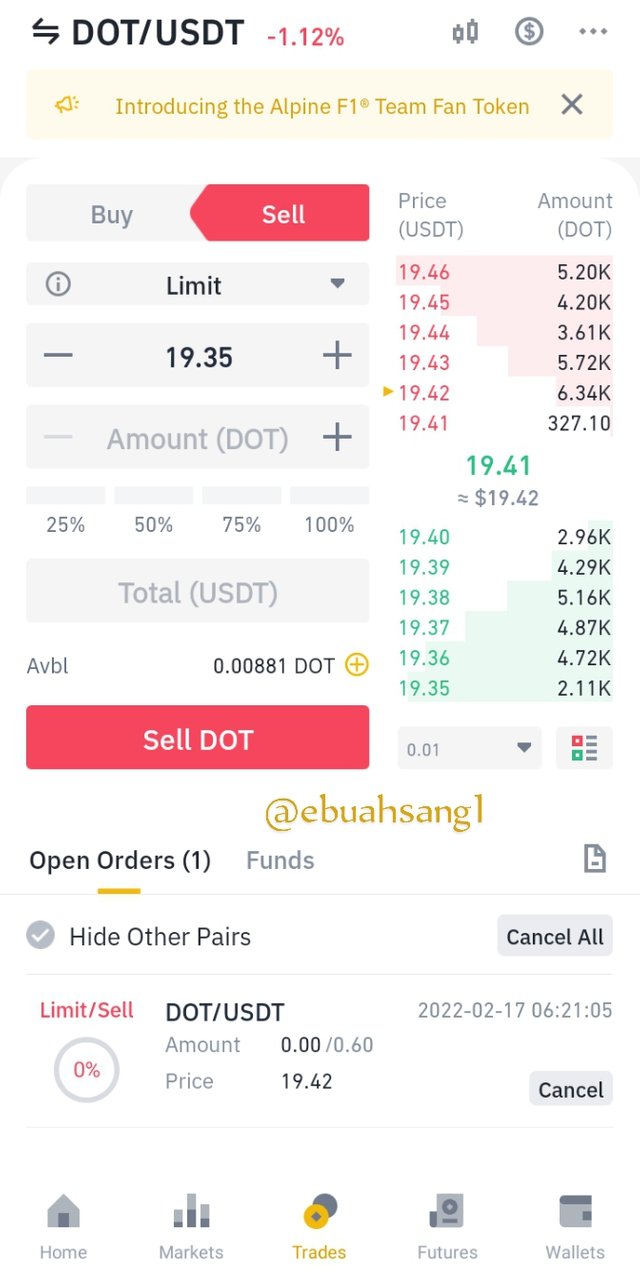
Selling DOTUSDT
Looking at the screenshot below, it can be seen that the blue TEMA which is the 20 fast moving TEMA has cross below the slower 50 TEMA.
Also looking at the RSI indicator, it can be seen that the Indicator is above the 70 range. Signalling a possible trend reversals to a bearish trend. And so I decided to place a demo trade.

Using Binance Exchange to perform real Sell trade
TEMA helps to smoothen out price reducing fluctuation and reducing noise in the market
TEMA provides up to date Information in the market since it reacts faster to price changes than any other Moving Average indicator. This helps to show the present emotion in the market
TEMA also helps to identify and confirmation trends in the market with the position of the TEMA Indicator and the price chart.
TEMA helps traders to spot trading opportunities in the market through its unique cross over technique in the market. It also provide dynamic support and Resistance level for traders to place trade.
It is very easy to understand the TEMA Indicator which is an added advantage and that's why most traders use it.
TEMA like other Moving Average indicators are more useful only in a trending market. On a ranging market it doesn't help you predict price movement effective.
TEMA is not a very good indicator for long term traders. Since it is good with shorter timeframe and place more weight on recent price changes.
The TEMA Indicator is not a good indicator in a volatile market as it will tend to produce much more false signals
Identify reversals in a market using TEMA is very risky as the Indicator reacts fast to time and can provide false support and resistance levels.
Triple Exponential Moving Average indicator is a very good signal. It helps traders to identify trading opportunities in the market especially in a trending market. Reducing the price fluctuation in the market using 3 Exponential Moving Average has made it easy for short term traders to analyse recent price changes.
I want to thank Professor @fredquantum for bringing this indicator to my notice. It was a great lecture and good assignment.