Pinterest Edited Postermywall"
The A/D indicator is a technical analysis tool used by traders to analyze the crypto market. This indicator comprised of volume and price of a financial asset to determine Accumulation and Distribution phases. So the A/D simply means Accumulation and Distribution Indicator. The A/D indicator was Created by Marc Chaikin in an attempt to help traders determine the volume of money that flows into or out of a financial asset. This Indicator is used world-wide by traders.
Looking at the Indicator's name itself, we can see that it is a combination of two words, Accumulation and Distribution, I will like us to defined this words first before we go any further.
Screenshot from Tradingview official website"
Accumulation.
Accumulation in English is regarded as the process of gathering/acquiring something little by little. This definition is not Farfetch from what it is in finance.
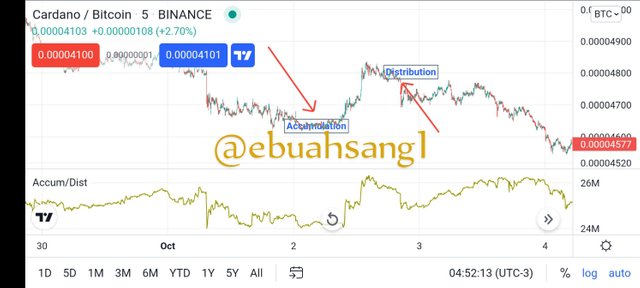
Accumulation in finance is the gradual process by which traders purchase or acquire financial asset and hold it over time. It is a looked upon as a growth stage of a financial asset as buying activities of the asset increase. This phase is a indication that traders in the market are pumping money into a financial asset. Usually, the accumulation stage is usually followed by an increase in price.
Distribution.
Conversely to Accumulation where have distribution. Distribution in English refers to an act or process of sharing or giving out something.
Distribution is the supply stage of a financial asset. This usually occurs when an asset have been overpriced in the market. This phase mostly happens after the accumulation stage and traders who acquired financial asset are seeking to make a profit by exiting the market.
The stage in a financial asset is usually preceded by falling prices as an increase in supply reduces prices.
So having now understood the accumulation and distribution phases, we can then understand better what the Accumulations and support Indicator is. It is therefore an indicator that shows the different stages of Demand and Supply of financial asset, that is where traders increase demand by acquiring and asset and increased supply by exiting the market.
How and why it relates to volume.
As I earlier mentioned, the A/D indicator used price and volume to indicate periods of accumulation and distribution of an asset. The A/D Indicator is also referred to as a Volume based Indicator. Why? This is because the A/D Indicator identify the divergence between price of an asset and Volume.
This Indicator helps traders to analyze prices of financial assets and spot reversal points in the market. When the A/D Indicator rises and price is in an uptrend, this is an indication that traders are buying the asset and we are in the accumulation phase. Contrary to this, when prices are falling the Indicator is in a downtrend, it is an indication that traders are exiting their positions on the asset and we are at the Distribution stage.
Divergence is an important aspect of the A/D indicator and it occurs when price and the indicator line moves in opposite directions. That is, when the A/D Indicator line is in a downtrend and price is rising, it means the volume of purchasing is reducing and a potential reversal will occur. Conversely, when price is in a downtrend and the Indicator is rising, it means the downtrend is about to end and an uptrend reversal about to happen.
In a nutshell, during accumulation phase when traders are constantly buying and keeping an asset, these increase the price of an asset and it's activity thereby increasing the Volume of the financial asset. On the other hand, when traders are exiting the market of a financial asset, this decreases the volume.
Therefore, during the Accumulation phase Volume increases and during distribution phase, Volume decreases
)
To answer this question, I will be using the Tradingview platform to illustrate how to add the A/D indicator to an asset chart.
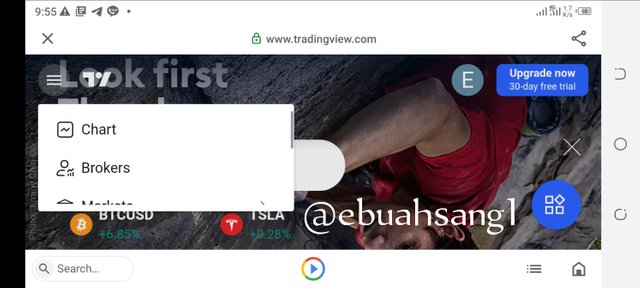
- Step 1. I will go to the official Tradingview platform. On the top left corner, I will click on the 3 lines and a list will pop-up with chart at the top. I will click on it.
Screenshot from Tradingview official website"
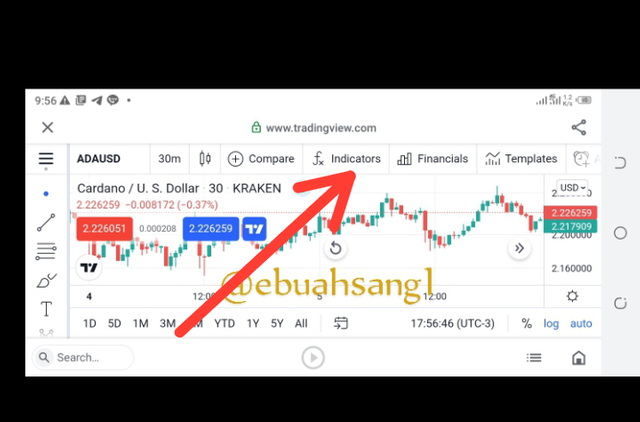
- Step 2. As we can see, that is the chart of ADA/USD. At the top center of the chart is the fx indicators icon. I will click on it.
Screenshot from Tradingview official website"
- Step 3. A search bar will appear. I will type the A/D Indicator and click on search. A list of indicators will appear and I will choose the A/D indicator and click on it.
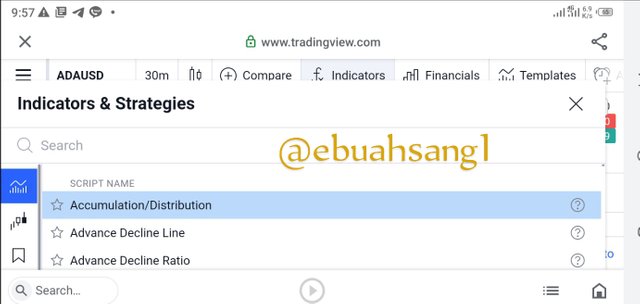
Screenshot from Tradingview official website"
- Step 4. As you can see, the Indicator has been successfully added to our price chart.
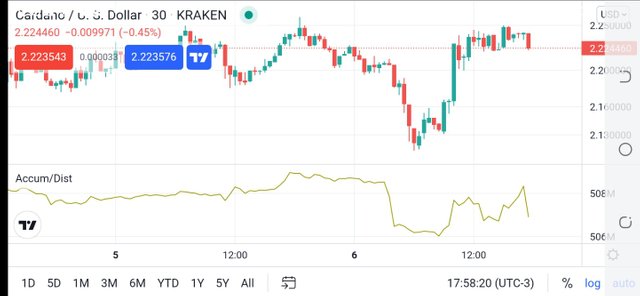
Screenshot from Tradingview official website"
)
There are 3 parameters involve in calculating A/D Indicator.
Money flow multiplier. The formula for calculating Money flow multiplier denoted as MFM is
MFM= (CP-LP) - (HP-CP)/ HP-LP.
Where
CP= Closing price
HP= High Price
LP= Low Price.Money Flow Volume. The second parameter is the Money Flow Volume denoted MFV. It is calculated as follows
Money Flow Volume= MFM x VP.
Where
VP= Volume of the Period.Previous Accumulation/Distribution line. The last but not the least parameter is the previous A/D line denoted P(A/D) and it's gotten from the chart.
When we have successfully gotten these parameters, then we are ready to calculate the A/D indicator line.
A/D= MFM + MFV x P(A/D)
For this example, we will continue with ADA/USD.
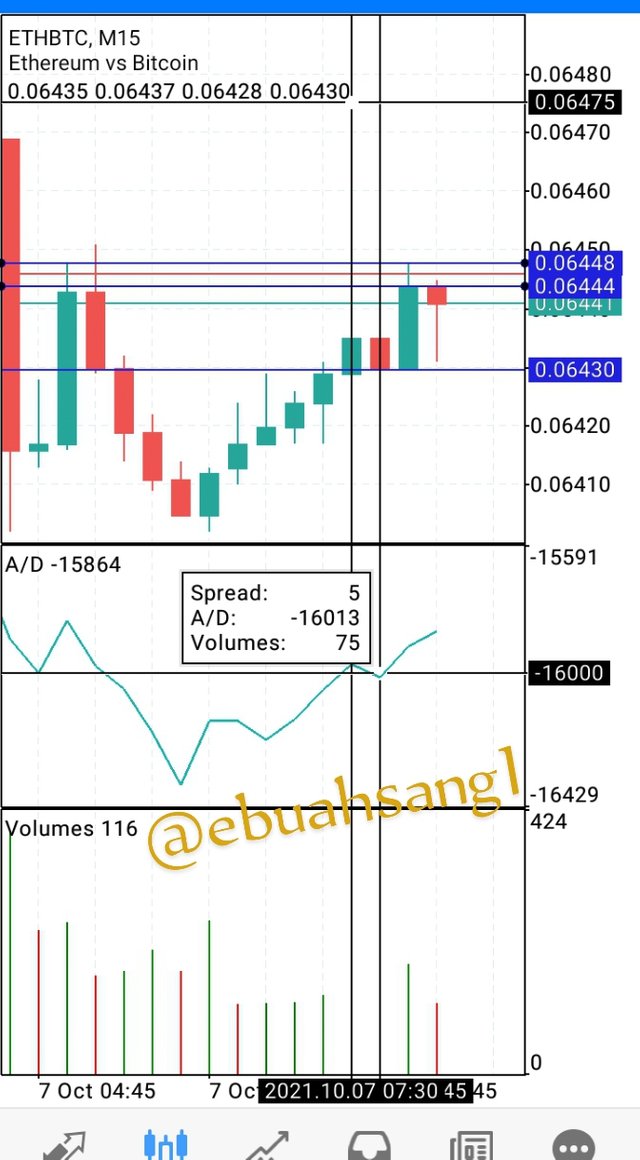
From the screenshot above and using Meta5trade demo account,
CP= 0.06444
LP= 0.06430
HP= 0.06448
Previous AD line = -16013
Previous volume= 75.
Firstly, we need to calculate our Money flow multiplier
MFM= (CP-LP) - (HP-CP)/ HP-LP
MFM= (0.06444-0.06430)-(0.06448-0.06448)/ (0.06448-0.6430)
MFM= (0.00014)-(0.00004)/0.00018
MFM= 0.555555555555555
MFM= 0.556( 3 s.f)
Now let's Calculate our MFV.
MFV= MFM x VP
MFV= 0.556 x 75.
MFV= 41.7
Now, the final step is to calculate the A/D. Therefore,
AD= MFM + MFV x P(A/D)
AD= 0.556 + 41.7 x -16013
AD= -667,741.544.
)
This question requires that we confirm the AD indicator. I will explain how to confirm to identify and confirm the A/D Indicator in both an uptrend and a downtrend.
- Uptrend
If the price of a financial asset is in an uptrend making consistent higher highs, and the A/D indicator is also rising then we can say the market is in an uptrend. This is a strong bullish Indicator.
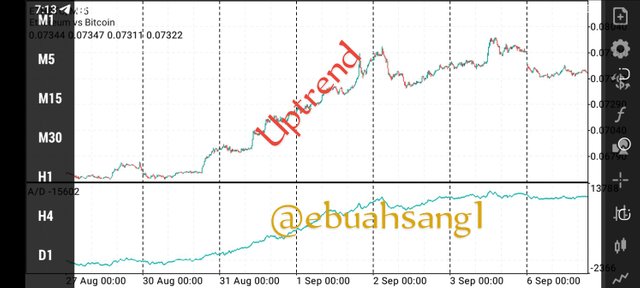
As can be seen in the image above, the price of the financial asset is in the same direction with the A/D indicator.
- Downtrend.
Contrary to the above Explanation will indicate a downtrend. That is when price of a financial asset is falling and making consistent lower lows and the A/D indicator is falling, it means the asset is in a downtrend and this is a strong bearish signal. This is a good position to enter a SELL trade as prices are expected to continuously fall.
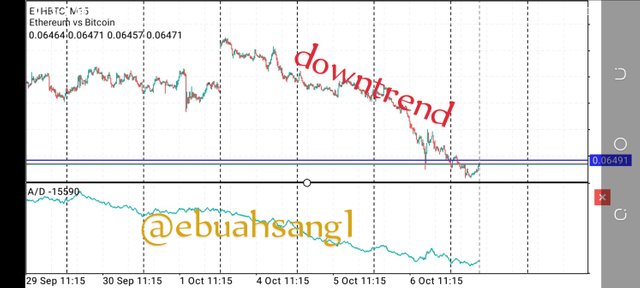
As can be seen from the image above, the price is making consistent lows while AD is also falling.
- Divergence.
Divergence is occurs when price and the A/D indicator moves in opposite directions. This is a good Signal that the trend is about to end and a potential reversal is on the way.
Take for example the price of a financial asset is in an Uptrend while the A/D indicator is in a downtrend. This illustrate a weak bullish signal, low volume and a possible trend reversals. This is true when prices are falling and the A/D indicator is rising.
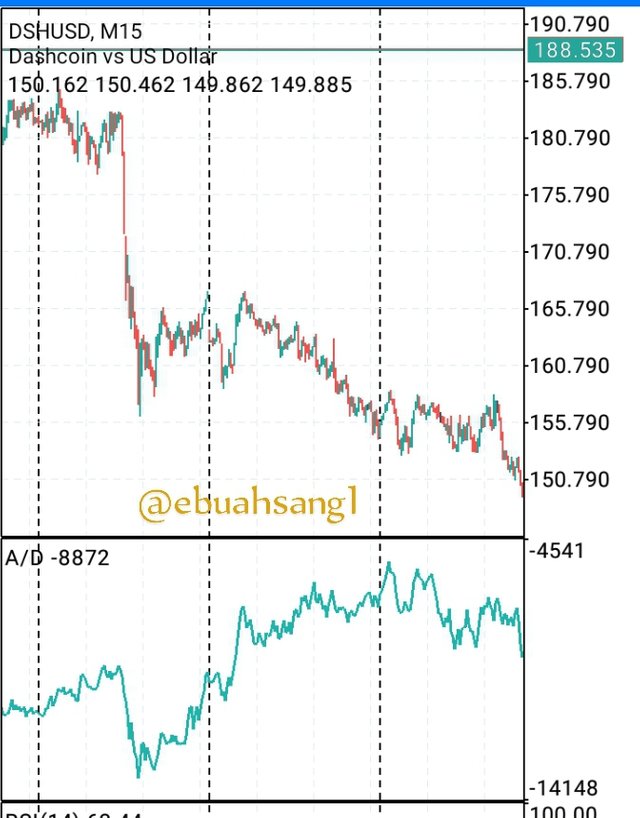
The image above is a good divergence as we can jow price is falling and the A/D Indicator is in an uptrend.
)
Sell DHSUSD
To answer this question, I will be using the Meta5trade demo account to place sell position on the DHSUSD.
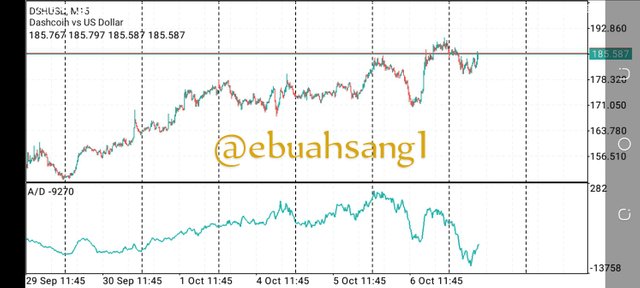
Using the A/D indicator, we can see from the image above that price are up. Even though at that point price is are at 185.377, the the AD indicator has fallen drastically. This period shows that price and the AD indicator are in opposite directions and the uptrend has come to an end and judging from this chart Indicator, I expect a downtrend.
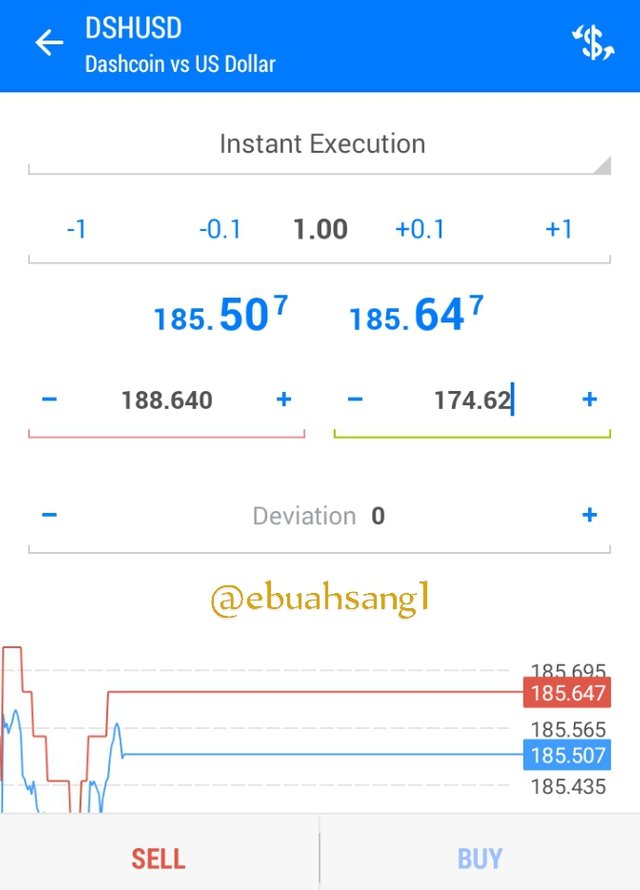
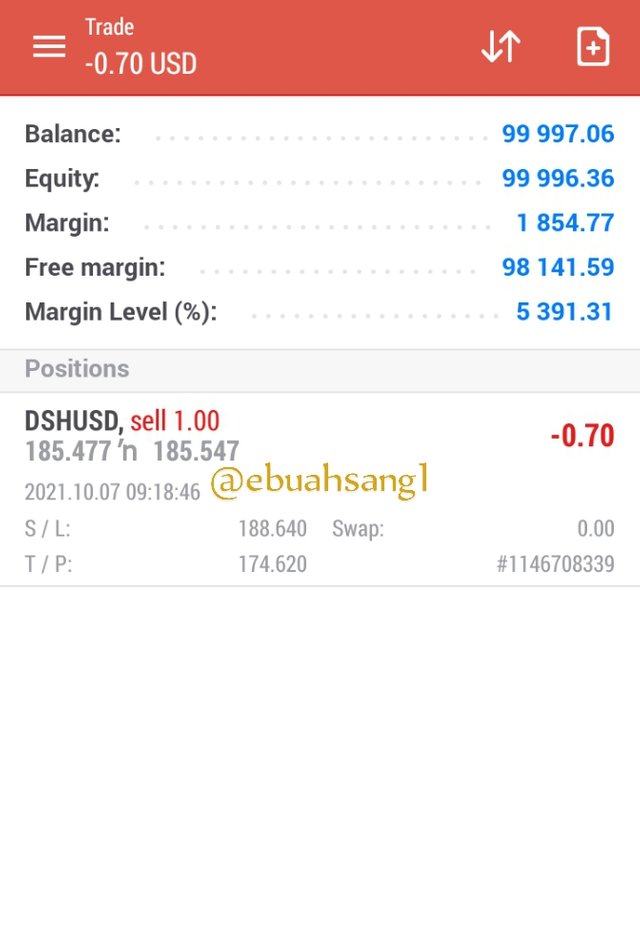
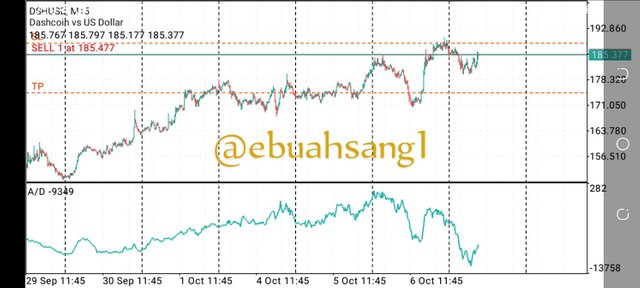
So I place a sell order with a take profit position at 174.62 and a stop loss at 188.64.
)
It is a generally know fact in the trading world that no indicator no matter how good is good to be used as a standalone indicator as no Indicator is 100% accurate. Therefore, it is always advice to combine different indicators to give stronger trading signals.
For this question, I will be using the RSI indicator in conjunction with the A/D Indicator to explain why this two Indicators are suitable to be used together.
Relative Strength Index denoted as RSI is a momentum oscillator indicator. It has a range from 0-100 and shows overbought and oversold position of an asset. When price is above 70 and closer to 100 range, this signals an overpriced assets and a possible reversals and a price below 30-0 signals and underpriced and oversold asset.
This Indicator is good to use conjunction with the A/D Indicator since it indicates buy and Sell pressure in the.
Combining AD indicator and the RSI Indicator.
To combined this two Indicators to traders have to look for divergence positions on the A/D Indicator and confirm with an Overbought or oversold positions on the RSI indicator.
That is, when prices are in an Uptrend, the AD indicator should be in a downtrend and the RSI indicator should be above 70 showing an overbought/overpriced assets. This is a strong Bearish reversal signal.
Also, when prices are falling and the A/D indicator is in a uptrend, also the RSI indicator is in an oversold/underpriced position, this is a sign that prices are about to reverse and a possible uptrend will happen.
A bullish or bearish divergence occuring in the AD indicator and an oversold or overbought position on the RSI indicator combine to give strong buy or sell signals.
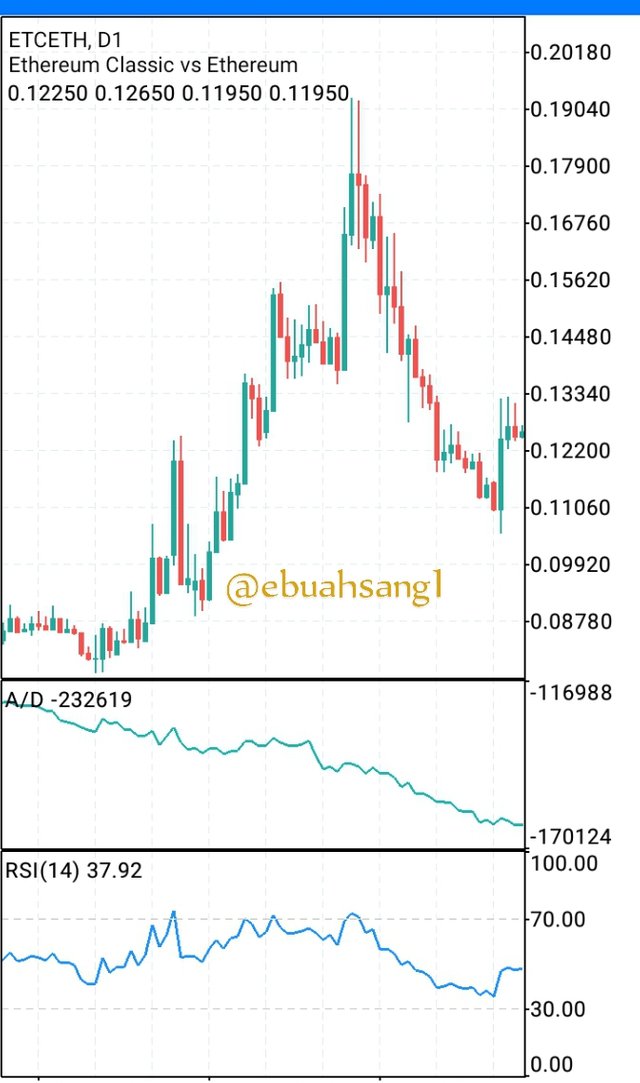
Illustrating from the image above. It can be seen that the price of ETHEUR is rising while the AD indicator is falling. This a bearish divergence, and furthermore, the RSI indicator is above the 70 range, signalling an overbought position. This indicates that there is a Bearish reversal soon as can be seen with prices.
)
From the above explanations and the wonderful lecture by professor @allbert, it can be seen that the AD indicator is a very impressive and important technical analysis component. A good analysis and understanding this indicator will help a trader to enter successful trades in the market .
I am very happy learning this indicator today and I say a big thank you to professor @allbert for his efforts in giving us the best.
CC.professor @allbert.
Most images were screenshot from Meta5trade demo account and Tradingview platform
Hello @ebuahsang1 Thank you for participating in Steemit Crypto Academy season 4 week 5.
Downvoting a post can decrease pending rewards and make it less visible. Common reasons:
Submit