Today's lesson covers a very important topic "How to create an account on TradingView, how to use indicators, tools, features of Tradingview". Thank you Professor @yousafharoonkhan for letting us know about How to create an account on TradingView, how to use indicators, tools, features of Tradingview through this lesson. I learned many unknown things. I hope the lesson will be helpful for everyone.

Question no 1:
Defining the TradingView site and how to register an account in tradingview? what are the different registration plan?(screenshot necessary)
TradingView site
TradingView site is a technical analysis platform for traders. Most of the traders use this site to do technical analysis in cryptocurrency, forex, stock, or any other field. This website is very popular in case of using it for analysis. According to Alexa, this site ranked 130 in the world.
Tradingview provides charts of cryptocurrencies, most of the cryptocurrencies in the world are available on this site for charting and trading. Not only crypto charts it also provides forex, stock charts for its users.
This site is also known as social media site. A group of traders can share their charts with each other on trading view. In this way, they can analyze together for trading. This is a very good option. To get this feature you have to buy their monthly or annual package.
Registration of an account in Tradingview
It is easy to resister in Tradingview. Below I try to explain all the steps with screenshots:
- First, visit https://www.tradingview.com/ and you will see the following interface. I am going to create a free account that's why I click Start free trial.

- This brings me a new window. I scroll down a little and then click Try free basic.

- I want to open my Tradingview account with my email. So I click Email. You may choose your own.

- I enter my username, email, password and tick the marks then confirm that I am not a robot. After all, these done I click Create account.

- Then I got this message, my account yet. I have to go to my email and activate my account.

- I visit my email and click Activate account.

- This asks for my First and last name. I enter them both along with my profile picture. Then click Continue.

- As you can see, my Tradingview account is successfully created.

Different registration plans
There are 4 registration plans on the Tradingview site. Each plan has individual special features. Below I try to let you know all the registration plans with their price.
| Registration plan name | Price |
|---|---|
| Free basic plan | Free |
| Pro plan | $14.95/month |
| Pro+ plan | $29.95/month |
| Premium plan | $59.95/month |


Question no 2:
Explain the different features of TradingView and what is your favorite feature and why?(screenshot necessary)
Different features of TradingView
Chart
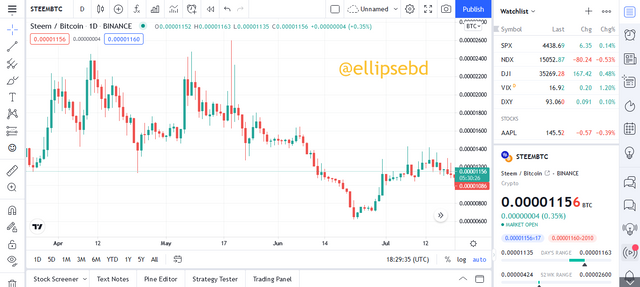
The chart is a very important feature in Tradingview. Through the chart, we can find different types of market trends. Signals are also extracted using different indicators in the charts. There are many editing tools in the charts that are easy to use to find the proper market trend. In this way, traders make a profit by trading using charts.

Market
Cryptocurrencies, Currencies, Stocks, Indices, Futures, etc are all available in Markets. From here, you can select as you wish, to explore the trading options of any.
Whatever we choose from the market, we will get all kinds of options available. For example, from Cryptocurrencies to price, Defi coin, also all the information of different coins are available.

Whatever we choose from the market, we will get all kinds of options available. For example, from Cryptocurrencies to price, Defi coin, also all the information of different coins are available.
I have selected the Bitcoin option from Cryptocurrency. There is much information such as the current price of Bitcoin, market capital, available coins, trading volume. So Markets is a very important feature in Tradingview.

Screeners
In Screeners, you will get three different options stock screener, forex screener, crypto screener. I choose a crypto screener to show you its different options.

Many important options are available in this section. Changes in 24 hours, high, low, volume, last hour volume these options are helpful in the case of trading.

My favorite feature and the reason
My favorite feature is the form Chats indicator. This is a great feature for all traders. Most of the time I use this feature for getting support and resistance. Traders and investors most often use this feature.

Not only support and resistance can be extracted from the indicator. With this Buy and Sell, Signals can be used very easily. It is also easier to extract the signal by adding multiple indicators.

Question no 3:
How to set up a chart in TradingView and use two tools to edit it. (screenshot necessary)
It is easy to set up a chart in Tradingview. Let's see how can we do that:
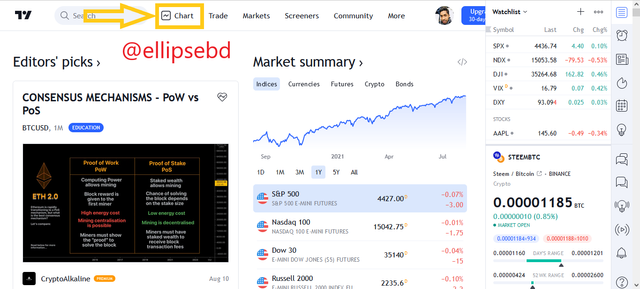
- First, I visit https://www.tradingview.com/ and log in with my email and password. Then I click Chart.
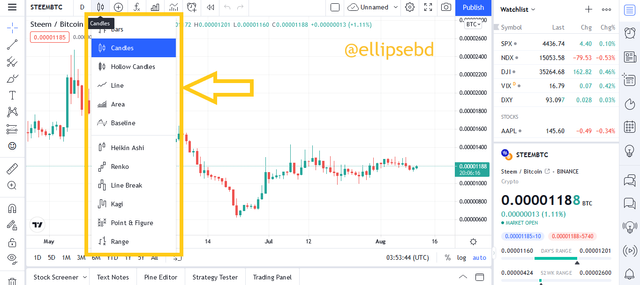
- You can see different options are available in front of me. I can choose, Bars, Candles, Hollow Candles, Line, Area, etc. by clicking any of them.
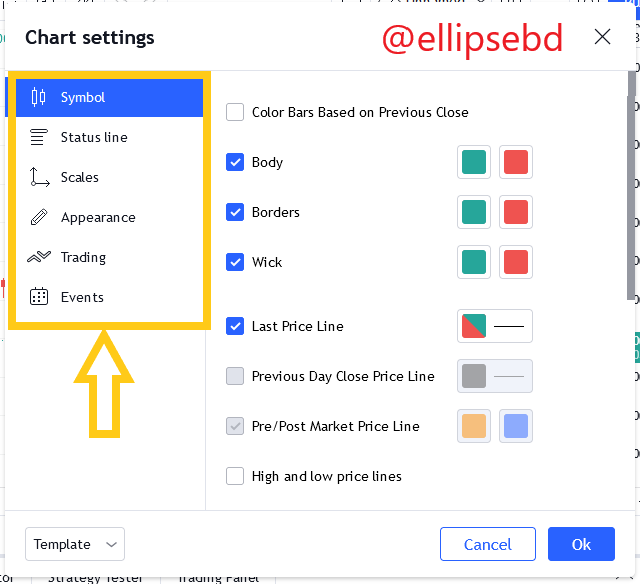
- Then, If by visiting the Chart setting I see the following options Symbol, Status line, Scales, Appearance, etc. We can easily modify color, line, and others options very easily.
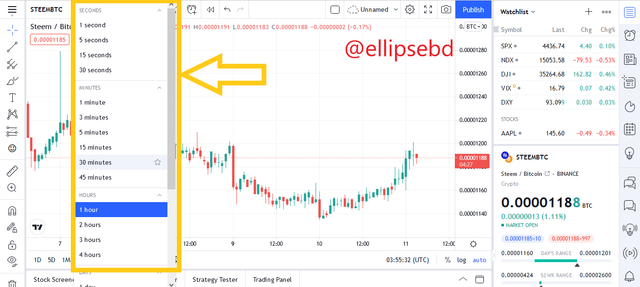
- Different time frames are also available in a Chart. We can choose any time frame from 1 minute to 1 Month which is very handy.
Now, I will try to explain two tools to edit the chart easily those I always use.
1- Trend lines
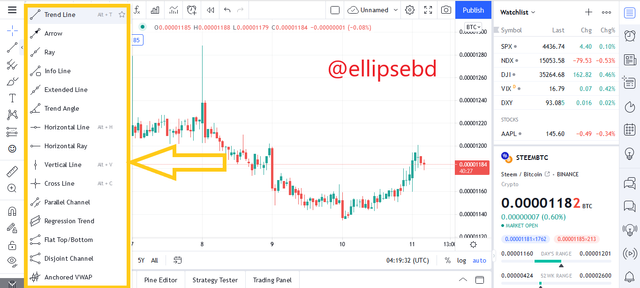
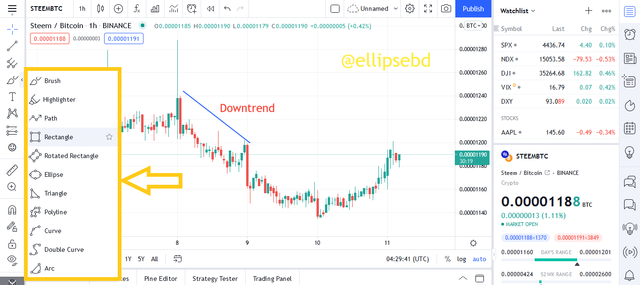
There are different trend lines available such as Trend line, Arrow, Ray, Infoline, etc. The purpose of these lines is to draw market trends. Sometimes the market is in Uptrend and Downtrend condition. Traders use trend lines to show market trends in their chats.
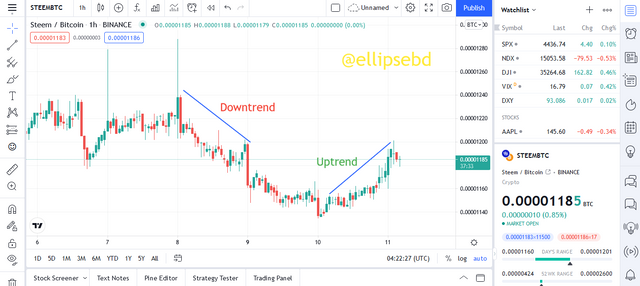
In the chart below. You can see I tried to draw trend lines of Uptrend and Downtrend both. This line could use with any of the indicators and get good signals.
2- Rectangles
There are many options in this section. Brush, Highlighter, Path, Ellipse, Rectangle, etc. These options can be used to mark in the chart.
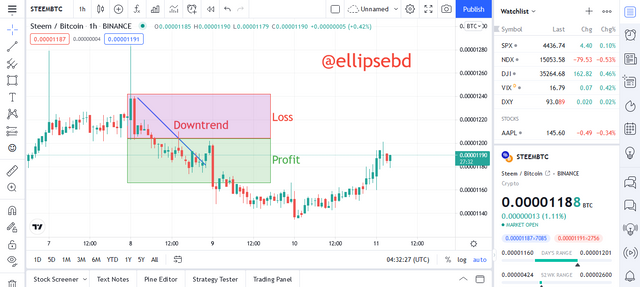
The rectangle can be used in chart to calculate risk in future trade. A downtrend is going on and a 1:1 risk calculation is done in the chart. In this way, we can understand the calculation easily and I if we share it with others they will also understand easily.

Question no 4:
Explain how to add indicators in the chart, what is your favorite indicator and why? (screenshot necessary)
Adding Vortex indicator to STEEM/BTC chart
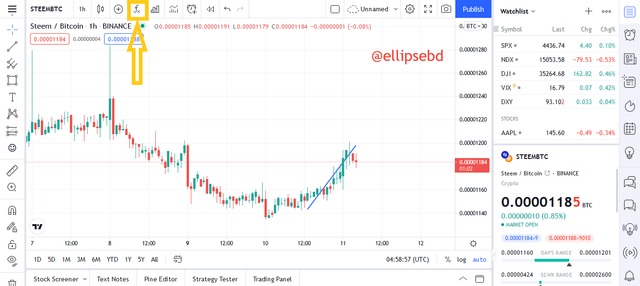
- First, click this fx icon marked as the screenshot below.
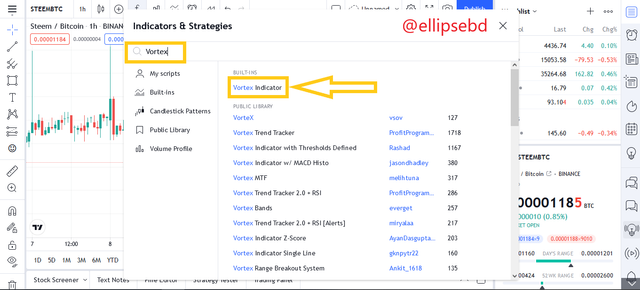
- As, you already know I will add a Vortex indicator. So in the search box, I type Vortex. Then I click Vortex indicator.
- As you can see, Vortex indicator is successfully added to the chart.
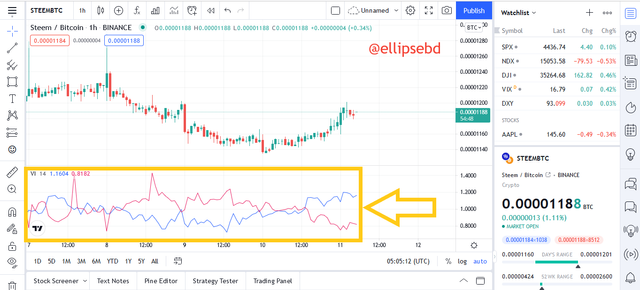
By following the above procedure. We can easily add indicators to the chart.
Vortex indicator in my favorite indicator
Vortex indicator is my favorite indicator. This indicator is my favorite because it is a very simple indicator. It has two lines blue line or positive line and a red line or negative line. These two lines form buy and sell signals by crossing each other.
When the blue line is above the red line and crosses each other, this is a buy signal and when the blue line is below the red line and crosses each other, this is a sell signal. By this simple method, we can get buy and sell signals easily. That's why I love this indicator.
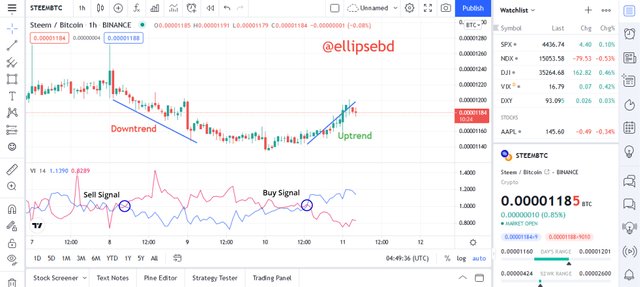
In the above screenshot on STEEM / BTC chart, I have shown a Buy and Sell signal mark on the Vortex indicator. Here we can see that the market was in a downtrend when the sell signal was given, and again when the buy signal was given, the market started going uptrend.

Question no 5:
Do you think TradingView is useful in predicting the market for cryptocurrency (trend / price)?
Tradingview is a very useful in predicting the market for cryptocurrency trend/price. Most of the traders use this for their technical analysis. This site is very handy and easy to use. There is a free basic option for free users. There are also premium options for advanced traders.
Tradingview has different types of indicators. Using these indicators, the signal can be easily extracted. Build-in indicators in Tradingview are very helpful for finding signals and market trends.
The chart can be analyzed very well in Tradingview. Drawing and writing can be done here. With these, market trends can be easily identified. Premium members can share their charts with everyone. This is a very important feature. Group of traders and telegram group members can take advantage of this feature.
So Tradingview is very useful in predicting the market for cryptocurrency trend/price.

6
Conclusion
Conclusion
This lesson discusses Tradingview, a very important topic that traders need. How to open an account in Tradingview is shown step by step. Besides, 4 packages have been discussed here.
Tradingview has many important features, some of which we have discussed. I have shown how to get buy and sell signals from my favorite indicator of trading view. Market trend identification in the Tradingview site is very easy. Overall today's lesson was very helpful for all.
Respected first thank you very much for taking interest in SteemitCryptoAcademy
Season 3 | intermediate course class week 7
thank you very much for taking interest in this class
Downvoting a post can decrease pending rewards and make it less visible. Common reasons:
Submit
Thanks for your valuable feedback.
Downvoting a post can decrease pending rewards and make it less visible. Common reasons:
Submit