Hello All Steemians !!!
Today I'm going to make my Steemit Crypto Academy Homework task by professor @cryptokraze that talking about Trading Sharkfin Pattern. Very interesting lessons. Actually I have very little knowledge about this, but I will try to discuss it to improve my writing skills. On this occasion I will try to discuss it.


What is your Understanding of Sharkfin Pattern
Sharkfin pattern is a pattern that is formed due to trend movements and trend reversals in the cryptocurrency market. In chart analysis you can see quick price movements from a certain direction and quick price reversals in the opposite direction. A significant price movement or downtrend followed by a price reversal or uptrend will form a V-shape pattern. A significant price movement or uptrend followed by a price reversal or downtrend will form an inverted V-shape pattern.
This pattern is considered by traders as a sharkfin pattern which can assist traders in analyzing market trends that indicate a potential trend reversal at the beginning of a trend change.
V-Shape Pattern
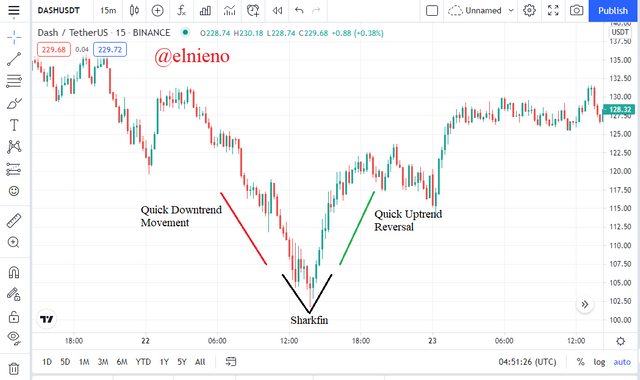
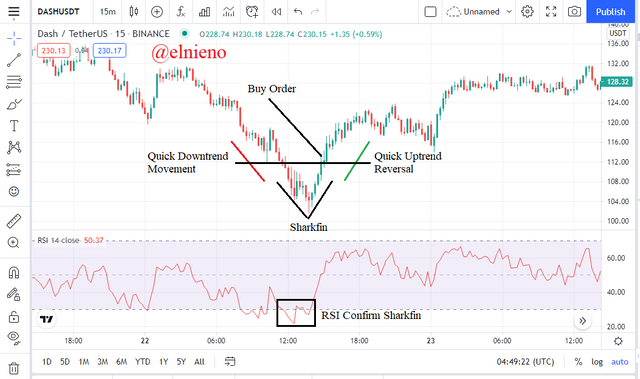
Based on the chart above, you can see the market trends for the DASH/USDT crypto pair which shows a quick downtrend movement and a quick uptrend reversal. The V shape on the chart shows a sharkfin pattern.
Inverted V-Shape Pattern
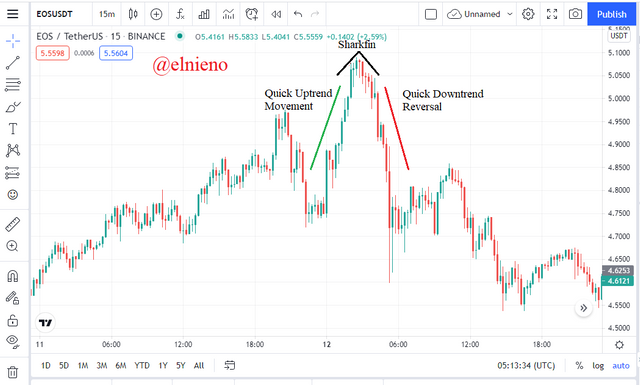
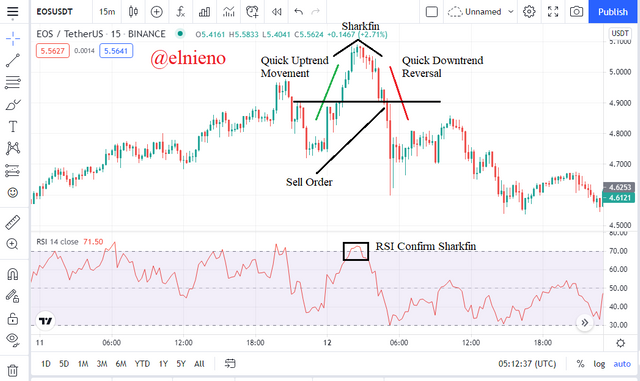
Based on the chart above, you can see the market trends for the EOS/USDT crypto pair which shows a quick uptrend movement and a quick downtrend reversal. The inverted V shape on the chart shows a sharkfin pattern.
Implement RSI Indicator to Spot Sharkfin Pattern
The addition of the Relative Strength Index (RSI) indicator is very useful to provide confirmation in seeing sharkfin patterns. This is intended to make you not mistakenly determine the position of entry and exit and not trapped in the middle of the market. The RSI setting on the chart is at the default setting. The length of the RSI is 14 and the bands are 30 and 70.
Downtrend Reversal
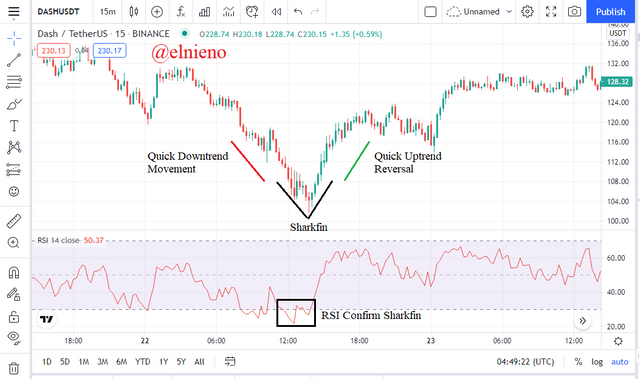
Based on the chart above, you can see the market trends for the DASH/USDT crypto pair. Downtrend reversal indicates that the RSI should move down and below the 30 level. The quick reversal should move up and above the 30 level. The V shape pattern and the RSI seen on the chart will confirm the sharkfin pattern.
Uptrend Reversal
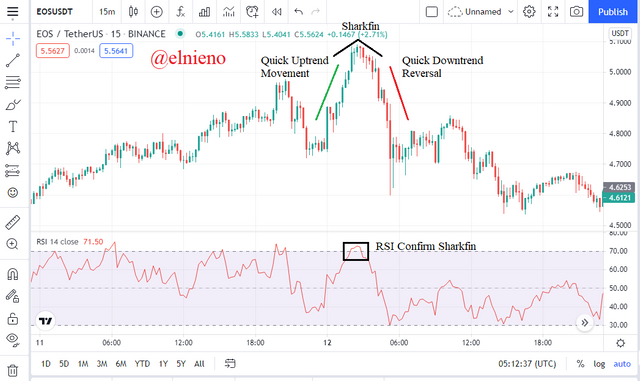
Based on the chart above, you can see the market trends for the EOS/USDT crypto pair. Uptrend reversal indicates that the RSI should move up and above the 70 level. The quick reversal should move down and below the 70 level. The inverted V shape pattern and the RSI seen on the chart will confirm the sharkfin pattern.
Write the Trade Entry and Exit Criteria to Trade Sharkfin Pattern
Entry Criteria for Buy Position
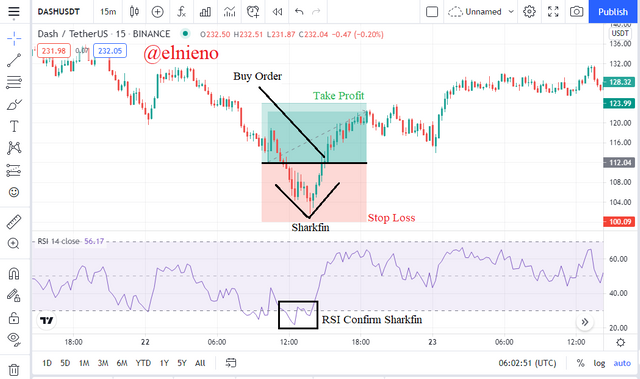
The addition and support of the RSI indicator using the default settings will provide precise confirmation of the sharkfin pattern on the DASH/USDT chart.
Analyze and wait for market trends and price movements that show a quick downtrend movement followed by a quick uptrend reversal to form a V-shaped pattern.
Watch and confirm the RSI indicator should move down and below the 30 level. Next the quick reversal should move up and above the 30 level.
Place and execute a buy entry when the RSI has clearly crossed the 30 level for your trading. A clear price movement and a clear RSI indicator rising above the 30 level are the keys to confirming a good sharkfin pattern.
Entry Criteria for Sell Position
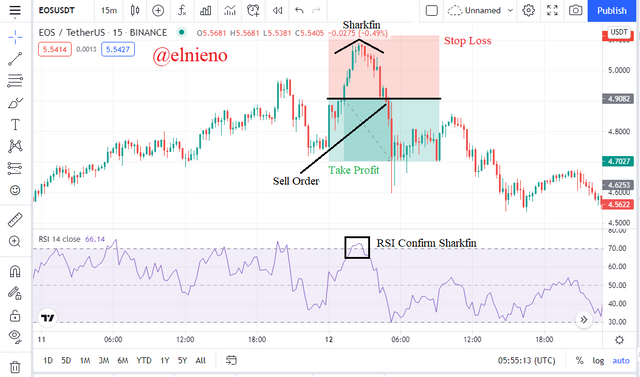
The addition and support of the RSI indicator using the default settings will provide precise confirmation of the sharkfin pattern on the EOS/USDT chart.
Analyze and wait for market trends and price movements that show a quick uptrend movement followed by a quick downtrend reversal to form a inverted V-shaped pattern.
Watch and confirm the RSI indicator should move up and above the 70 level for your trading. Next the quick reversal should move down and below the 70 level.
Place and execute a sell entry when the RSI has clearly crossed the 70 level. A clear price movement and a clear RSI indicator falling below the 70 level are the keys to confirming a good sharkfin pattern.
Exit Criteria for Buy Position
Determining and setting the stop loss level is very necessary and useful if your trading move down or go wrong after a buy entry.
Stop loss level must be below the swing low point of the sharkfin pattern on the EOS/USDT chart.
If the price reaches the stop loss level then your trade settings are not as expected and must exit the trade.
Determining and setting the take profit level is very necessary and useful if your trading move up or is correct after a buy entry.
Take profit level must be 1:1 which is at least equal to the stop loss level. But the ratio can be 1:2 for certain needs or maximizing profit.
If the price reaches the take profit level then you can place profit order when exiting the trade.
Exit Criteria for Sell Position
Determining and setting the stop loss level is very necessary and useful if your trading move down or go wrong after a buy entry.
Stop loss level must be above the swing high point of the sharkfin pattern on the DASH/USDT chart.
If the price reaches the stop loss level then your trade settings are not as expected and must exit the trade.
Determining and setting the take profit level is very necessary and useful if your trading move up or is correct after a buy entry.
Take profit level must be 1:1 which is at least equal to the stop loss level. But the ratio can be 1:2 for certain needs or maximizing profit.
If the price reaches the take profit level then you can place profit order when exiting the trade.
Place at Least 2 Trades Based on Sharkfin Pattern Strategy
MANA/BTC
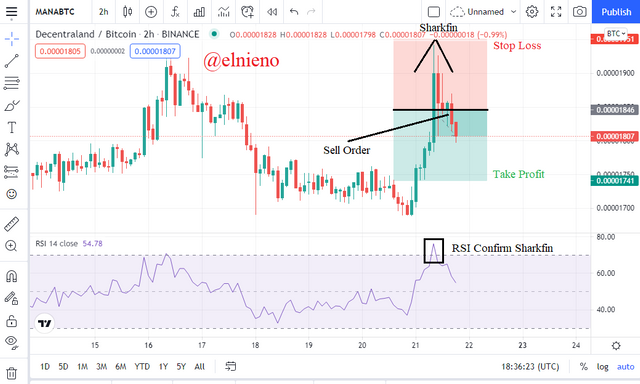
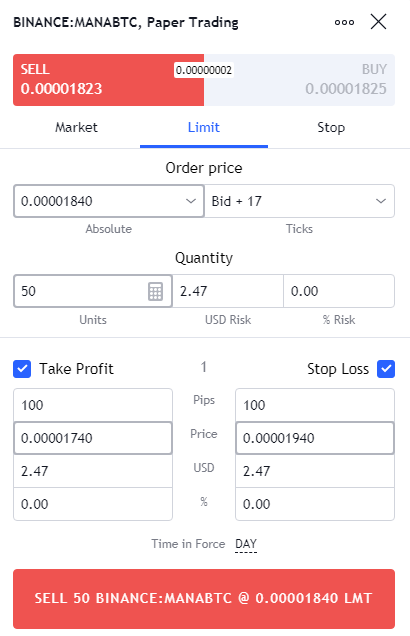
Based on the chart above, I analyzed market trends and price movements of MANA/BTC. Market showed a quick uptrend followed by a quick downtrend reversal to form an inverted V-shaped pattern. The RSI indicator also confirms by showing a move up and above the 70 level and a reversal move down and below the 70 level. I placed and executed a sell order with a stop loss and take profit ratio of 1:1.
DASH/USDT
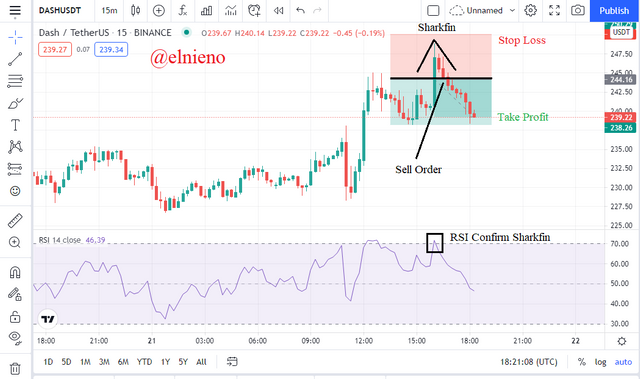
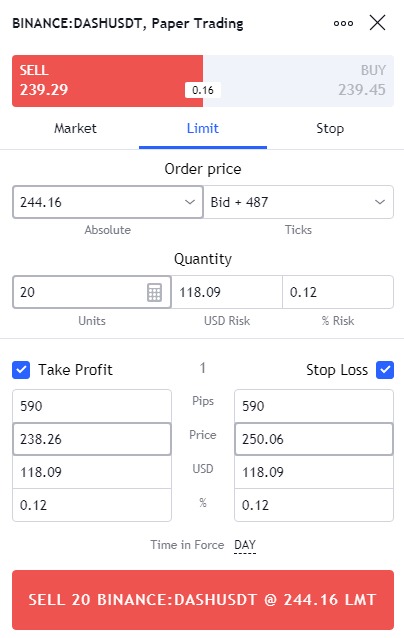
Based on the chart above, I analyzed market trends and price movements of DASH/USDT. Market showed a quick uptrend followed by a quick downtrend reversal to form an inverted V-shaped pattern. The RSI indicator also confirms by showing a move up and above the 70 level and a reversal move down and below the 70 level. I placed and executed a sell order with a stop loss and take profit ratio of 1:1.
Conclusion
Trading using sharkfin patterns are very helpful and useful for traders in carrying out profitable trades. Sharkfin patterns can provide a clear indication that shows a quick trend movement followed by a quick trend reversal in the cryptocurrency market. The addition and use of the RSI indicator is helpful for confirming shark fin patterns. In the world of cryptocurrencies, trading strategies and chart analysis are needed to provide good trades.