INTRODUCTION
Hi everyone, welcome to steemit crypto academy season 4!!!. I am very happy about the return of steemit crypto academy after it's short break. Today I'll be making a post based on the lecture given by professor @allbert on trading with strong, weak and gap levels.
Without further ado, let's go on:

STRONG AND WEAK LEVELS
Before we delve into what string and weak levels are, I'll like us to revisit what support and resistance is on a chart. If you've noticed on a chart, there are often places where where is a characteristic price movement. This could be the support or resistance level.
Resistance level is an imaginary horizontal line where there is price change ,which often involves a rising price getting to this level then reversing to fall. Support level on the other hand is also an imaginary price level where falling prices reverses and begins to rise. Let's take a look at a screenshot to understand better.
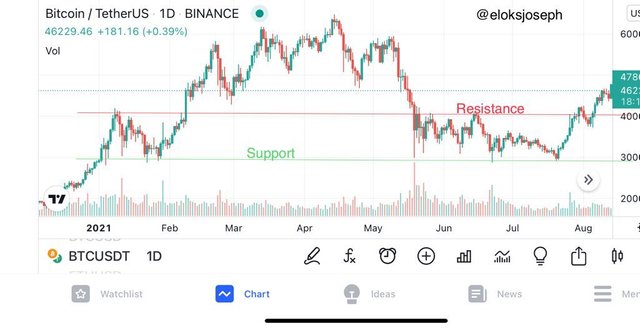
SCREENSHOT FROM TRADINGVIEW MOBILE APP
As we can see from the screenshot above , the imaginary horizontal levels are often characterized by a price trend change. Let's now take a look at strong and weak levels.
STRONG LEVELS
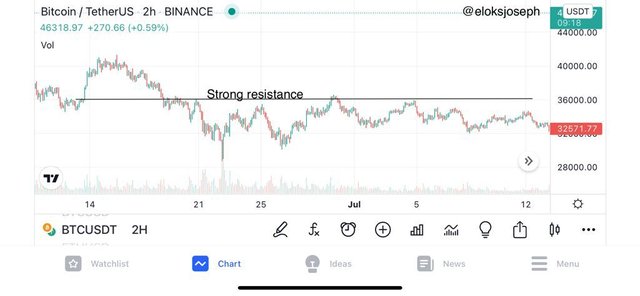
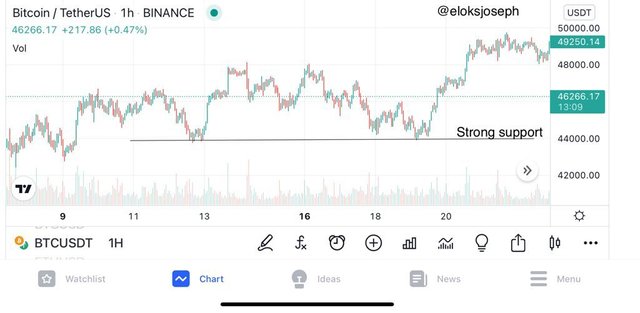
Strong levels are levels in the chart where large volumes are traded and price reversals occur at these levels frequently. It could a strong resistance level or strong support level. It is hardly broken out of and trend reversals are common at this point.
STRONG RESISTANCE LEVEL
SCREENSHOT FROM TRADINGVIEW MOBILE APP
These levels are often caused by large volume of sell orders. At these level, there are constant price reversals from uptrend to a fall in price.
STRONG SUPPORT LEVEL
SCREENSHOT FROM TRADINGVIEW MOBILE APP
This strong support levels are often caused by a large number of buy orders which often cause a falling price to reverse back in the opposite direction.
WEAK LEVELS
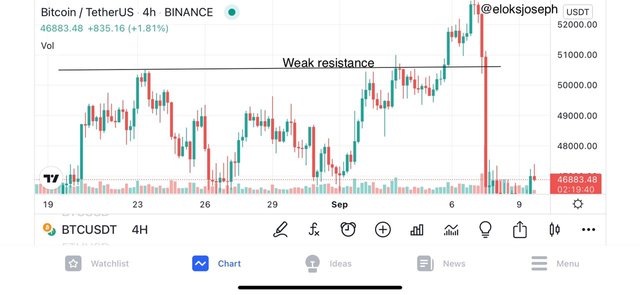
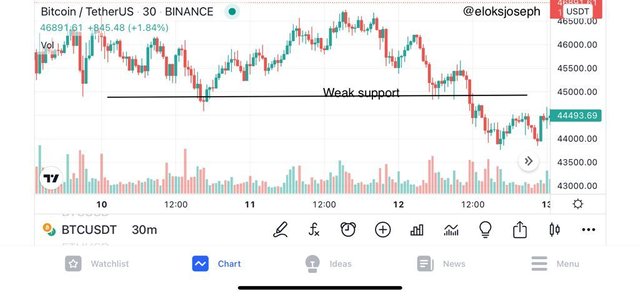
Unlike the strong levels where there are multiple price action at a level, the weak levels are levels of resistance and support that are easily broken out of. Now here's why; in the case of the strong levels ,we have established there are large volume orders waiting to take place, but in this case, there are still orders waiting to be completed but not as large as the orders in the strong levels so the price would only reverse temporarily and then continue in it's trend.
WEAK RESISTANCE LEVEL
SCREENSHOT FROM TRADINGVIEW MOBILE APP
From the chart above, we can see that the price was initially reversing after hitting the resistance level but then continued and broke through the level. This is caused by sell orders but the volume of the sell orders were not enough for it to resist the price action so it broke through.
WEAK SUPPORT LEVEL
SCREENSHOT FROM TRADINGVIEW MOBILE APP
From the chart above, we can see that like in the weak resistance, there was a temporary reversal but the orders were not enough to validate the reversal so the price broke through the support level.

GAPS AND ITS CAUSES
When we hear the word gap,what comes to mind is a separation or a space between 2 things. When we analyse charts, we can often see situations where 2 corresponding candles do not follow each other as they're supposed to. From that we can now say a gap in a crypto chart is a jump from one level to another which creates space between 2 candlesticks. Let's take a look at a screenshot to understand better.
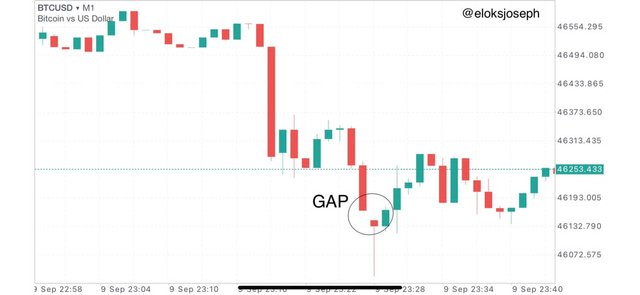
SCREENSHOT FROM TRADINGVIEW MOBILE APP
From the screenshot above , we can see that there was a gap between 2 candles. Now what causes this gap? The answer is really simple. Gaps are caused by large volume entries in a market. This is often done by institutions or a composite man entering the market with a very large volume. This causes the candlestick to skip and then a gap is formed.

TYPES OF GAPS
From the lecture, we have found out that there are three types of gaps;
- Breakaway gap
- Runaway gap
- Exhaustion gap
Let's take a look at each one by one:
BREAKAWAY GAP
Breakaway gap as the name implies mean a gap that causes the market price to break out of the current trend or dissociate from the current trend. This breakaway gap always starts a new trend or at the start of this gap , a strong support or resistance level is formed.
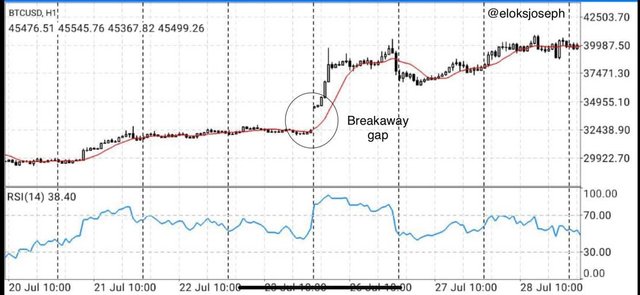
SCREENSHOT FROM METATRADER 4 MOBILE APP
RUNAWAY GAP
This type often occurs in a trending market and unlike the breakaway gap where a totally new trend is formed, this type of gap continues a new trend in the market. They are often hard to identify but when found, they also act as strong resistance and support levels.
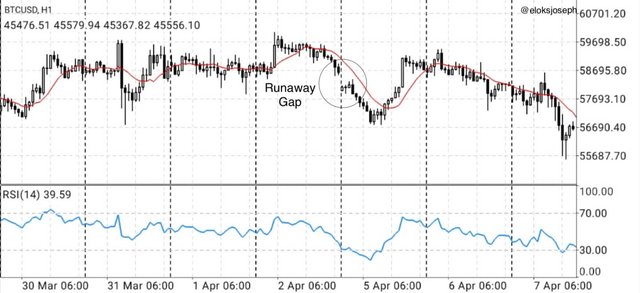
SCREENSHOT FROM METATRADER 4 MOBILE APP
EXHAUSTION GAP
These type of gaps often occur at the end of a trend. They are hard to identify as they are often mistaken for the runaway gap and some times these gaps are so hard to identify that it has to complete the total price movement before it can be identified. When identified, it is best to trade in the opposite direction as the previous trend has been exhausted.
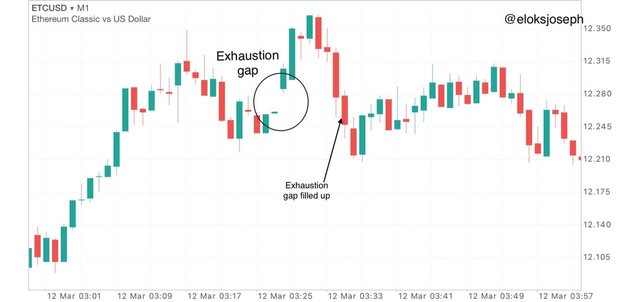
SCREENSHOT FROM METATRADER 5 MOBILE APP

DEMO TRADE USING STRONG SUPPORT OR RESISTANCE LEVEL
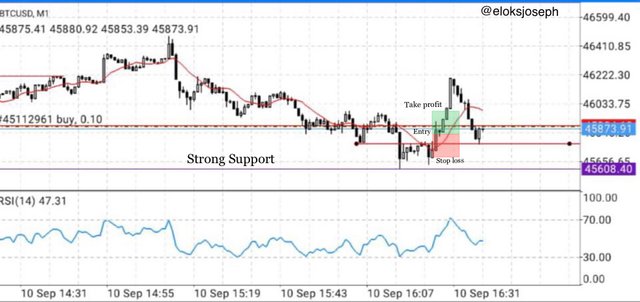
In the 1 minute BTC/USD chart, I noticed a string support around the $45600 line. When I noticed the market price heading towards that direction, I monitored closely and waited for it to reverse and when it did, I placed my trade in a buy position.
SCREENSHOT FROM METATRADER 4 MOBILE APP
At the end of my trade, here's the profit;
SCREENSHOT FROM METATRADER 4 MOBILE APP

DEMO TRADE USING GAPS LEVELS
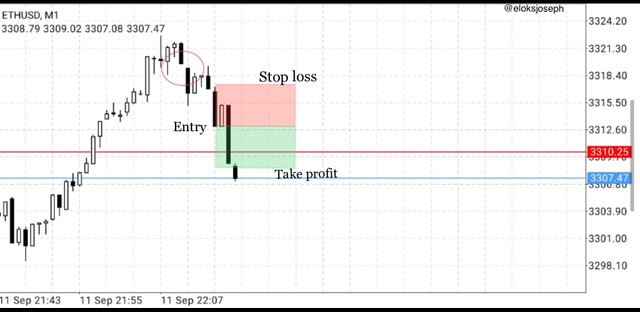
Using the ETH/USD 1 minute chart, after studying the market for a while I noticed a gap and studied the price movement for a while before entering the trade . I entered the trade in the sell position and then watched as it hit my take profit.
SCREENSHOT FROM METATRADER 4 MOBILE APP
Just before closing the trade, I took a screenshot of my profits :
SCREENSHOT FROM METATRADER 4 MOBILE APP

CONCLUSION
Being able to identify strong and weak resistance and support levels are very important for a trader as it is a great technical analysis of the price action of an asset. The presence of gaps in market are due to large volume entries and there are different type of gaps which when properly identified can be utilized to get proper entry positions in a trade.
Thank you for the lecture professor @allbert.
