.png)
Good day all at crypto academy and a happy new year . Today I'm this class we would talk about trading fractals in the market so let's begin :

1- Define Fractals in your own words.

Trading the market is not a guess work but by watching the market we notice that certain events repeat themselves in the market and by events I mean patterns . These patterns when they occur we see market follow a particular trends and this is what traders who study the market have noticed and they trade with this knowledge. These repeated occuring patterns are called fractals . Fractals are those repeatedly occuring market patterns. Previously we saw traders try to mark out these patterns manually themselves but this takes tim of times and energy and resources leading to development of indicators which help one identify this important patterns . It is now left for traders to use the patterns identified by these indicators and interpret it the way they wish to

2- Explain major rules for identifying fractals. (Screenshots required)

Number of candles :
for a pattern to be first identified as a fractal one must see at least involved in 5 candles in formation of the pattern . There maybe more but 5 is the minimum number of candles that can be involved in its formation
Fractals are only of two types : bullish and bearish . These two fractals differ in the conditions that must be met for a fractal to be identified as one of them
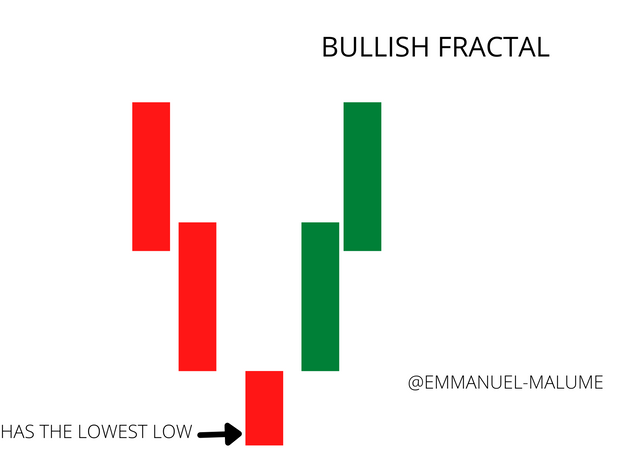
- for bullish fractals : we would need to see a kind of v pattern with the number of candle starting from 5 . Here in the v pattern we often see a candle usually in the middle with the lowest low with other candles flanking it having higher lows . An example can be seen below
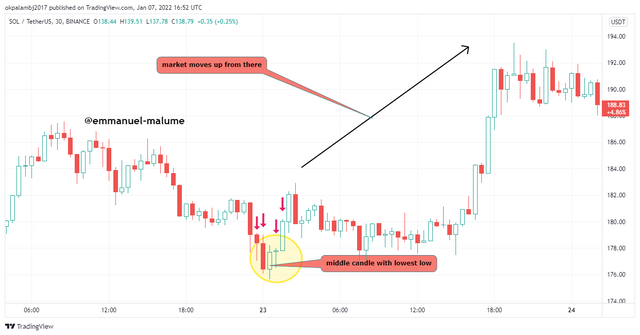
In the solusdt chart below, we see a bullish fractal formed by 5 andles and how thy were arranged with the middle candle being the one with the lowest low
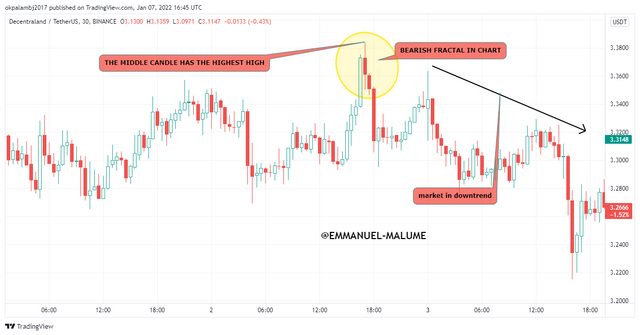
- for bearish fractal :we see something like an inverted v pattern with the middle candle standing out by having the highest high and other candles having power highs . The minimum amount of candle still remains 5 candles
.png)
In the manausdt chart below, we see how after a bearish fractal we saw market turn and start moving downwards from there

3.What are the different Indicators that we can use for identifying Fractals easily? (Screenshots required)

Indicators that one can use to identify fractals include : Williams fractals , fractal support and resistance, fractal breakout , fractal average breakout , fractal resonance bar , fractals highs and lows . I will show examples of 5 of these indicators using images below;
FRACTAL SUPPORT AND RESISTANCE
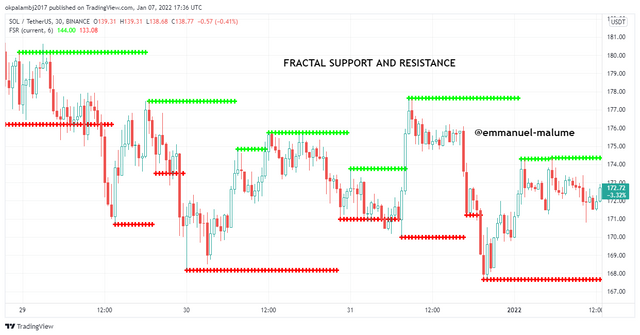
This identifies point of fractals using dotted lines with green for bearish fractal and red for bullish fractal which are point where we see market change direction often with this acting as support and resistance area ,There is a strategy for trading this which is the fractal support and resistance strategy
FRACTALS HIGHS AND LOWS
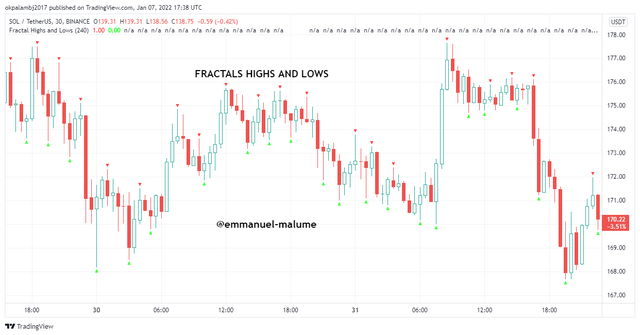
It uses dots to idetnfies areas that fractals can be found
williams fractals
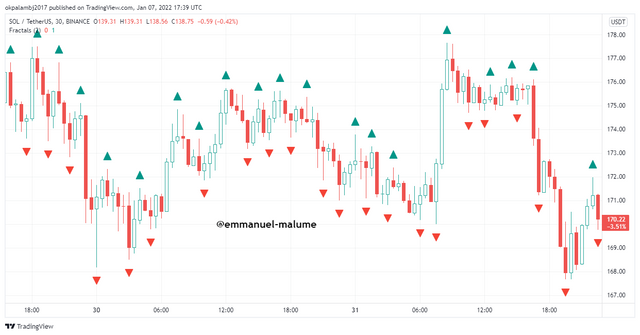
Probably the most popular of all fractal indicator and produced by bill wiliams and it uses arrow head to point out areas of bullish and bearish fractals. Price often changes directions where these fractals appear

4.Graphically explore Fractals through charts. (Screenshots required)

Fractals are repeating patterns in the market that we often see a market reaction which has ooccurred repeatedly in history.
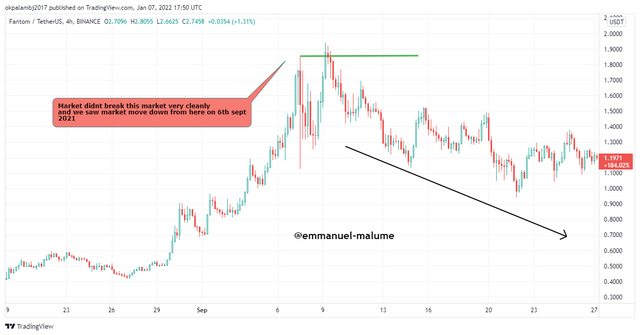
FTMUSDT
In the ftmusdt chart below, i went back to as old as 6th september where there was situation where the market failed to break the high of the previous high very well after a major retracement leading to a fall in the market
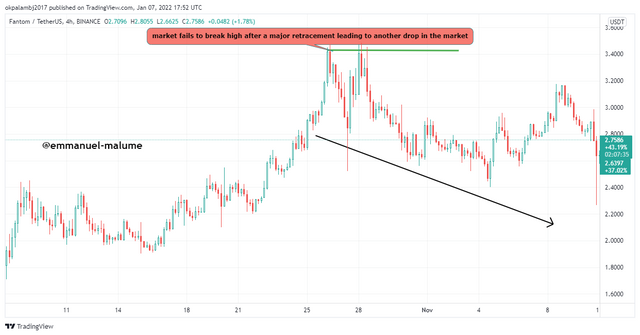
Later on the 28th of october of the same year, the same pattern formed and we saw market go downwards again
SXPUSDT
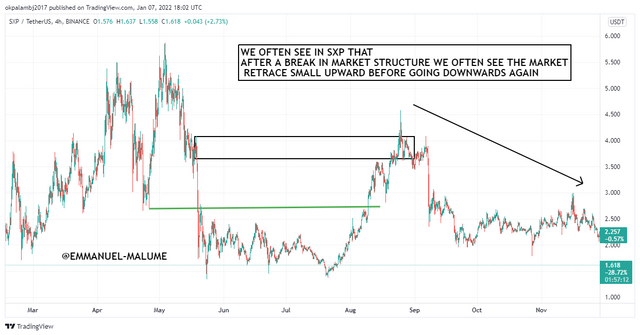
WE OFTEN SEE IN SXP THAT AFTER A BREAK IN MARKET STRUCTURE WE OFTEN SEE MARKET RETRACE SMALL UPWARD BEFORE GOING DOWNWARDS AGAIN
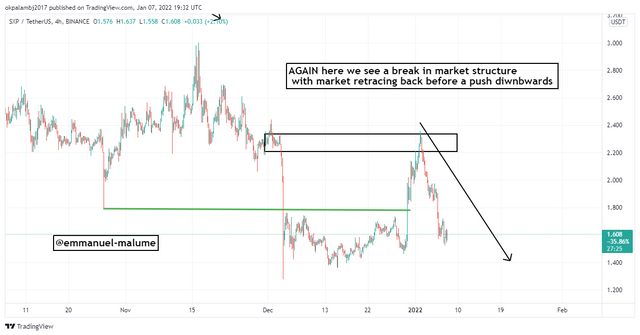
After a while in a recent chart, we see the same pattern been repeated with market clearly doing the same thing below:

Do a better Technical Analysis identifying Fractals and make a real purchase of a coin at a suitable entry point. Then sell that purchased coin before the next resistance line. Here you can use any other suitable indicator to find the correct entry point in addition to the fractal. (Usually, You should demonstrate all the relevant details including entry point, exit point, resistance lines, support lines or any other trading pattern

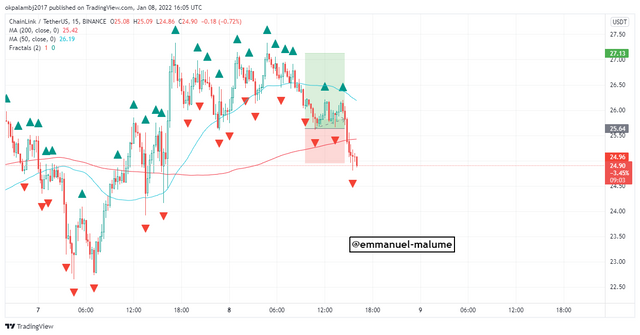
For this quesion i would be using the williams fractals together with moving average . The moving average would be used for confirming entry and then we use the fractals to identify those patterns that form adding more confirmation to the trade we are about to take .
LINKUSDT
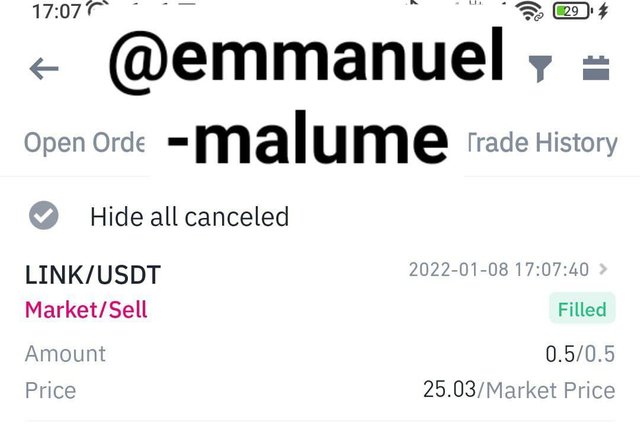
In the chart below, we can see how there was a fractal signal and price have retrcaed to the 20ma which is also acting as support level amd then i took a buy trade
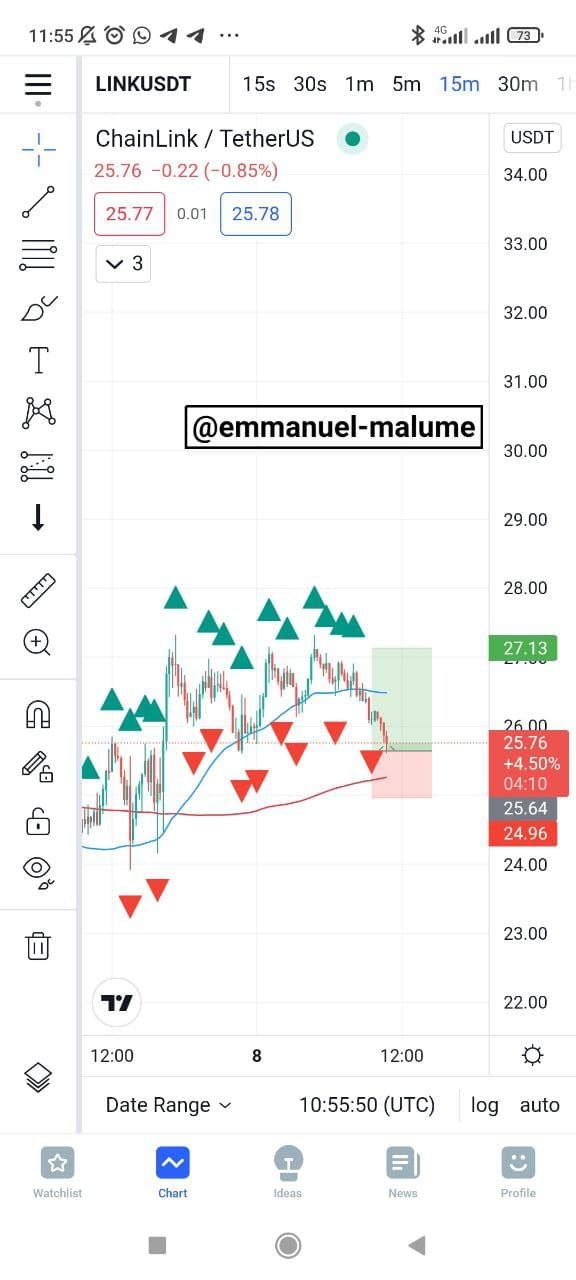
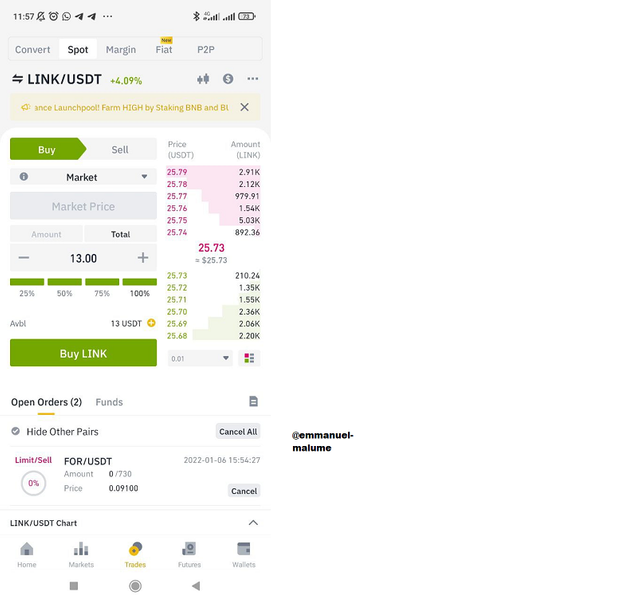
I applied strict risk management with a stop loss below movin average and the stop loss ended up being hit eventually

CONCLUSION

Fractl trading is actually very amazing and something wwhich one can develop ood strategy cause it teies to use repeated activities in the market to help on predict the future and also have a variety of indicator one can use to identify them. Some of these indicators tend to perform best with williams indicator a good example cause it can be used with williams alligator and moving average so as to increase confluence . It is good to note that the market hasnt reeally been moving well so a drop in the market is expected cause we are still bearish
Thank you @reddileep and a happy new year