
1.Explain in detail the function of the "Trend Line" in the EMA Strategy + Trend Line Breakout?

The Trend line is the second important factor in the implementation of this strategy. As I have already stated earlier, a trend line is drawn by connecting the swing highs or swing lows of price movement in a given trend. It is a widely used tool and is one of the most basic elements of technical analysis.
The general rule for the drawing of a trend line is that it must connect two/three or more swing highs or swing lows. Trend lines usually act as support/resistances, and this is the exact role they play in the implementation of this strategy. When the resistance/support of a trend line is broken and the candle closes above it, one can expect further movement in that direction. For this strategy, a candle close outside the trend line is a signal to enter the trade.

2.Explain in detail the role of the 100-period EMA in the EMA + Trendline Breakout Strategy

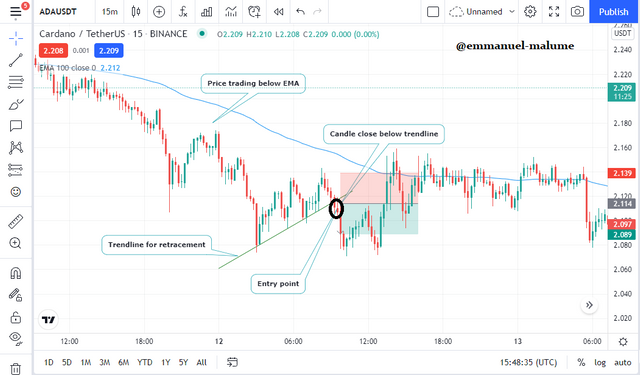
The major role of this indicator first of all is to show us the trend of the market, when we see this indicator above price, we say the market is in a downtrend but below price, we can say market is in an uptrend so the 100 ema shows us this so as to avoid buying in downtrend market and buying in downtrend market which leads to severe losses. Lets look at this example below :
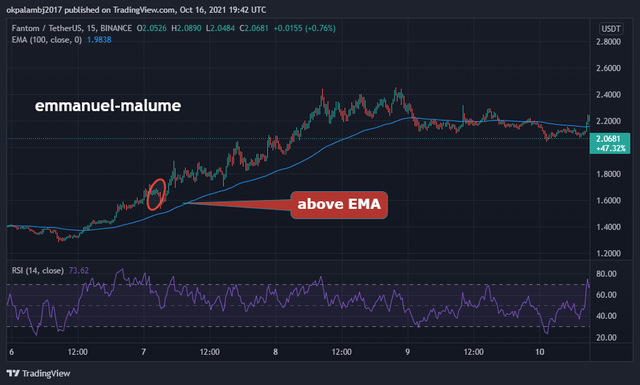
As seen above, imagine selling when price is above trendline, you would have ended up been taking out by the market

3.Explain in detail the role of the "Trend Line" in the EMA + Breakout Trendline Breakout Strategy?

The role of trendline in this strategy is to enable us avoid entering markets during retracements and to know the end of these retracements which is when we enter the market so in this strategy we draw a trendline then wait for price to break out of the trend line before we enter and daring these trendline for downtrend retracements in uptrend means connecting the highs of the minor downtrend then wait for a break as seen below :
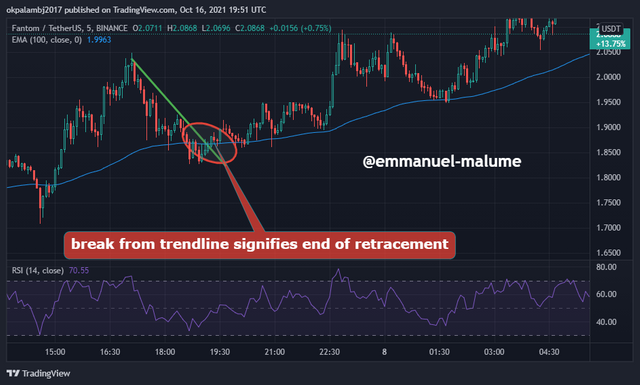
Breaking out of the down trendline when above ema shows us a good sign that our retracement have come to an end and we can now see the uptrend continue from where it stopped and keep moving upward

4.Explain the step-by-step of what needs to be taken into account to execute the EMA + Trendline Breakout strategy correctly?

A trader who decides to make use of this strategy must take into account the following:
The trader must identify the prevailing trend. This is done by looking at the price in higher timeframes, as well as the timeframe you wish to trade in. It is also done by adding the EMA. Price trading above the EMA is indicative of an uptrend. Below it is indicative of a downtrend.
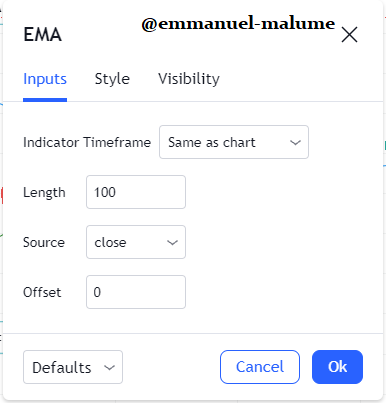
The trader must ensure that the EMA is set at a 100-periods. This is the ideal period for the EMA for this strategy, because it is a good gauge of medium term investor sentiment.
- The trader must be able to identify the impulses and retracements of the trend. One should make sure not to enter into a ranging market, as this will most likely lead to losses.

5.What are the trading entry and exit criteria of the EMA strategy + Trend Line Breaking?

To execute this strategy two things must be in place:
- The 100-period EMA must be set up on the chart, and the prevailing trend .
- A trend line must be drawn on a retracement from the prevailing trend.
must be identified
To enter: - Wait for the price to breakout from the drawn trendline.
- Ensure to wait for a candle close outside (above or below) the trend line.
- When a candle close is observed outside the trendline place a market order in the market.
To exit:
- Set your stop loss order a few price points above or below the most recent swing high or swing low.
- Set your take profit order at a Risk:Reward of 1:1
Practice (Only Use of own images)
Make 2 entries (One Bullish and one Bearish) in any pair of "Cryptocurrencies" using the "EMA Strategy + Trend Line Break" (Use a Demo account, to be able to make your entry in real time in any temporality of your choice, preferably low temporalities)
BULLISH ENTRY
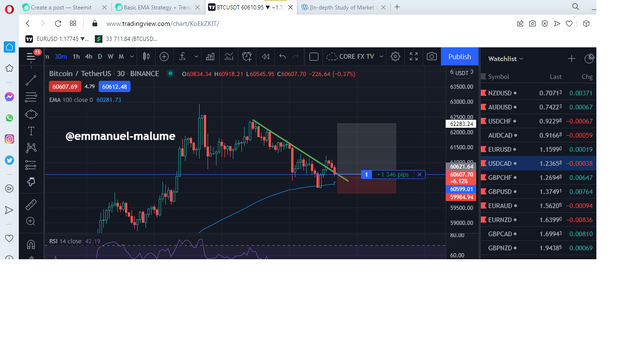
In the btc chart above, we saw price above ema which is a sign that we are still in an uptrend but suddenly we saw price break out of this retracement downtrend from the trendline so I took a buy entry on the trade
BEARISH ENTRY
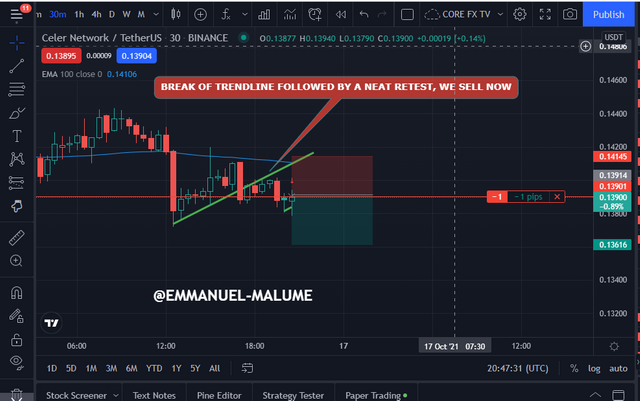
Here we see price below ema but we see an uptrend which is a mini retracement of price followed by our uptrend line been broken and well retested and i entered cause I know this is the end of the market retracement then we hope in for the downtrend trade


This strategy was well taught by the lecturer and involved us combining the knowledge of EMA and trendline to take trades helping us get high and good risk to reward trade entries which makes our trading life better .Thanks cc: @lenonmc21 for the class