
1.Definition of simple moving averages and exponential moving averages.

The simple moving average is an indicator that is derived by calculating the average of the closing prices of an asset over a specific period of time and represented in form of a line. It is constantly calculating average using new data over a set period of time
It takes into requirement a certain amount of days when giving an average depending on the duration you set it at.
So a 50sma will be representing the average of the last 50 candle close depending on the time frame so for a 15 min chart with 20 sma, the sma is giving you the average candle close after every 15 mins for the last 20 candles.
It is commonly used by traders to serve as a trend identifier (this is done using its orientation) and as dynamic support and resistance and also for trend reversal when combined with another.


We can take it as the faster-moving average that reacts more to small changes in price and also calculates price average over a specific amount of time too. It gives more weight to recent price points. It is not calculated the same way with the simple moving average but it has similarities in function with the simple moving average. Its biggest function is used in getting golden and death crosses in trading.


This is calculated by adding up closing prices of the specific amount of time and divide it by the amount of time(periods)
Sma=(A+N+G......+n)/nP
nP-number of period
For a 20 sma- closing prices for the last 20 candles is gotten, added up, and divided by 20


This has a more complicated calculation and the formula is
Current EMA = [Closing Price – EMA (Previous Time Period)] x Multiplier + EMA (Previous Time Period)
Now let’s look at the derivation
1.the simple moving average is first calculated for the period: the simple moving average is used as the previous period’s EMA. We use the formulae above for this
2.We need to get the multiplier which is gotten with this formulae
Multiplier = [2 / (Selected Time Period + 1)]
For example, if the time period in question is 30, the multiplier will be calculated as follows:
Multiplier = [2 / (30+1)] = 0.064
3.We have gotten our multiplier and last Emma so we fill in the details in the formulae to get our answer

3.Briefly describe at least 2 ways to use them in our trading operations.

There are many ways we can use the moving averages to identify trends and for trend reversals (golden and death cross ) and dynamic support and resistance levels
As a trend indicator: moving average is an indicator that shows us whether the price is bullish or bearish as the indicators follow price accordingly by using old data. So when we see our moving average is moving up we can see we are in an uptrend but when the price is moving down, d moving averages are also seen falling showing and confirming a clear downtrend but when the moving average isn’t moving up or down we can say we are in a range or neutral market.
As dynamic support and resistance: we know a support level is where price bounces up from to move upwards while resistance price bounces from it to move downwards. Moving average as it’s moving with price also rockers this levels for them especially the Ema.
A key example can be seen below

4.What is the difference between simple moving averages and exponential moving averages (Explain in Detail)

The major difference between the two moving averages is their reaction to recent prices. The exponential moving average reacts faster to changes in price than the simple moving averages cause of its additional weighting on recent price data. The simple moving averages takes the normal average of old data and so doesn’t reflect the new data making it a very lagging indicator while the exponential moving average shows more reference to recent data

5.Define and explain in your own words what "Fibonacci Retracements" are and what their gold ratios are

This is a popular tool used for finding good points to re-enter trends after a proper retracement. We can say they help us to identify key levels of support and resistance
It works using what is known as the Fibonacci numbers. The Fibonacci numbers were created by Leonardo Pisano, who was called Fibonacci. The numbers were formed by adding the last two previous numbers to get the new one so the sequence was like 1, 1, 2, 3, 5, 8, 13, 21, 34, 55,......and so on.
The Fibonacci Retracement we use are in percentage so we get them by division of certain Fibonacci numbers by their two predecessors and then multiplying by 100% . The Fibonacci numbers used are these :
0/1 = 0,1/1-1,1/2 = 0.5,1/3 = 0.333,2/3 = 0.666,3/5 = 0.6 ,3/8= 0.375,5/8 = 0.625,5/13 = 0.380,8/21 = 0.380,13/34 = 0.382, 21/55 = 0.3,34/89 = 0.617
We can see they gave a constant value range which is then multiplied by 100 to give the percentages which are -23.6%, 38.2%, 61.8%, and 78.6%

What is the golden ratio?

The golden ratio is actually 1.618 and this number was discovered by Greeks when they studied a lot of natural things and noticed that the value can be found everywhere in life from measuring from your head to your feet, and divide that by the length from your belly button to your feet to the spirals in sunflowers. The number was persistent
Now how does this relate to Fibonacci?
It was discovered that the Fibonacci numbers when divided by their preceding values gave almost the golden ratio. and the higher the values used the closer it was to the golden ratio.

PRACTICAL QUESTIONS (WITH OWN IMAGES)


show step by step how to add a "Simple and Exponential Moving Average" to the graph (Only your own screenshots - Nothing taken from the Web).

We will be using the trading view platform so we will be visiting the sitetradingview.com. The steps are as follows:
1.click on the indicator above after loading the site

2.we will start with simple moving average before loading the exponential moving average and for both we would use 30sma and 30ema . we search moving average and then click on the one without any etra words which i identified below
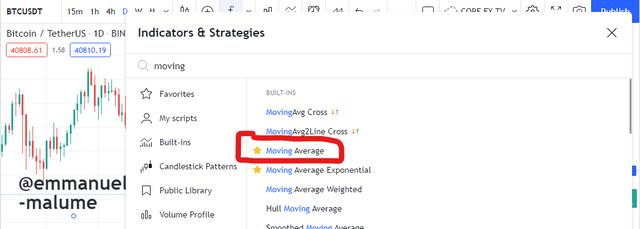
3.we change the setting cause usually the default setting is 9 sma so we change it to 30, one can adjust colour too
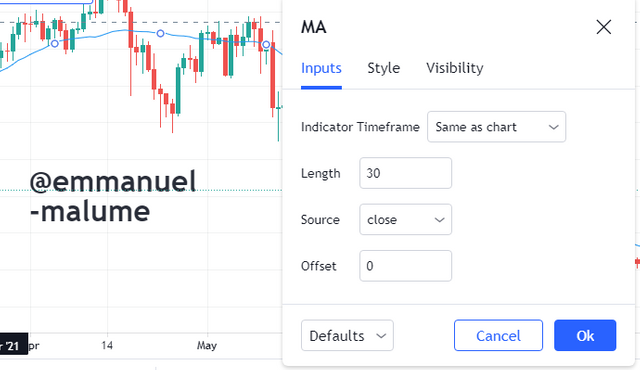
for EMA
1.We also search for it on the indicator option and then click on it to load it.

2.we also change the setting cause usually the default setting is 9 sma so we change it to 30, we will be adjusting the colour so e can easily differentiate it from sma since their default colour is blue
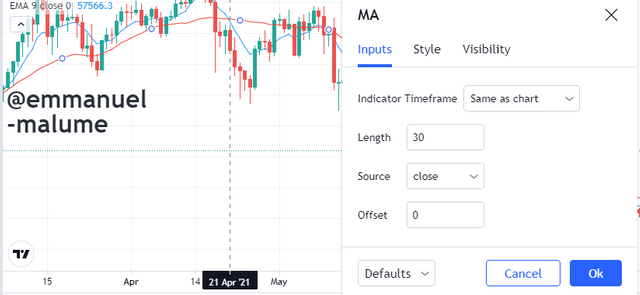
The two moving averages appeared like this eventually on the chart


Use "Fibonacci Retracements" to chart a bullish and bearish move (Own screenshots only - Nothing taken from the web)

I will be guiding us on how to draw the Fibonacci retracment on our charts. We will be using the trading view platform too. so we go to the site tradingview.com.
- we click the fork sign at the sides and we get a drawdown
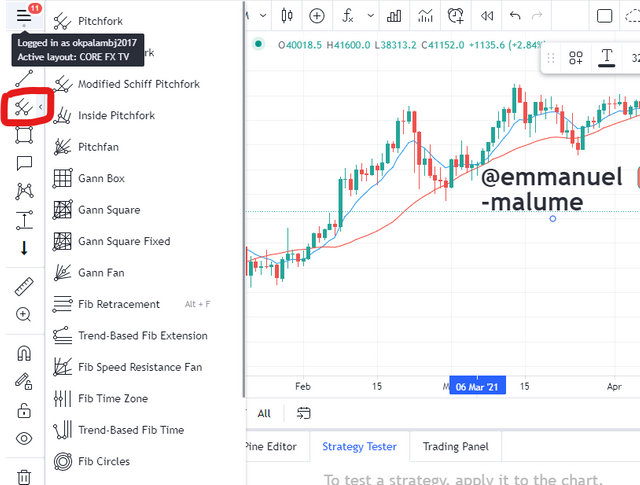
2.click on fibomacci retracement tool
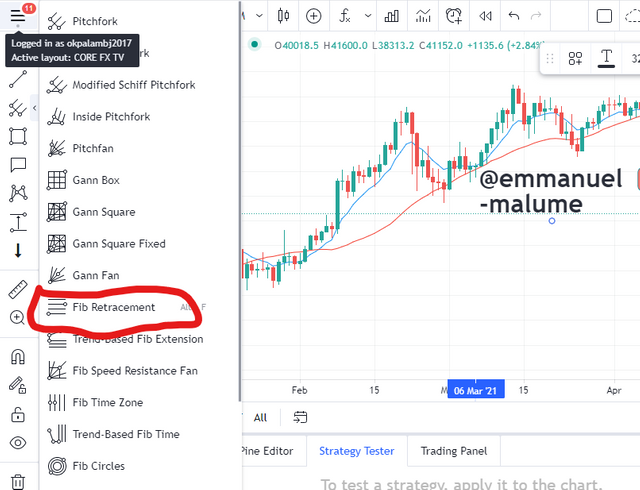
please note this before we draw the fib tool, fib tool can only be used in a clear trendmarket showing clear higher highs and higher lows so we will take an uptrend first before down trend . so for the uptrend we would look for a market making higher highs and lows
3.for uptrend we draw from low to a high and then the retracement of the high is checked using the tool and so we drew from point A to point B.
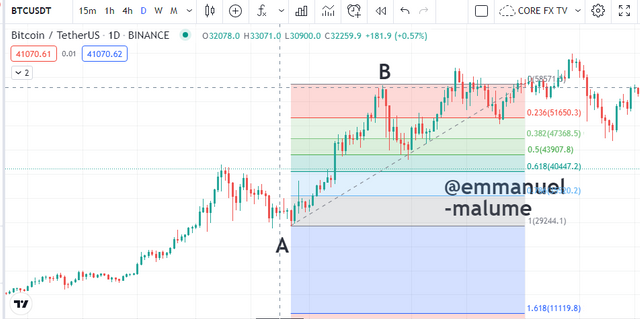
4.A downtrend we look for a tending market making lower lows and highs and then using the fib tool we draw from a lower high to a lower low then take the retacement of the low using the tool from point A to point B
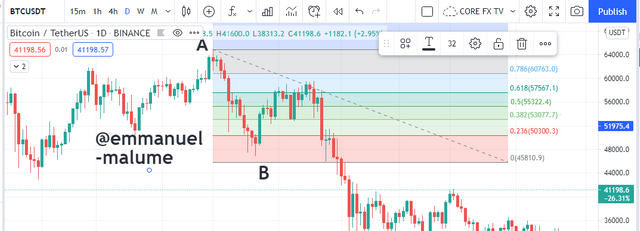

CONCLUSION

Moving averages are very good trading indicators that a trader needs to add to his trading tool. Personally i prefer using the exponential moving average cause of how it reacts to price and the Fibonacci tool is good for taking entries after retracement when combined with other trading tools like price actions.Thanks @@@lenonmc21