.png)
Good day all, it was a nice lecture from prof @imagen on Fibonacci and his questions were quite mind testing.Now let us dive into the questions he asked

1.) Who is Fibonacci? What is your most important contribution to mathematics?

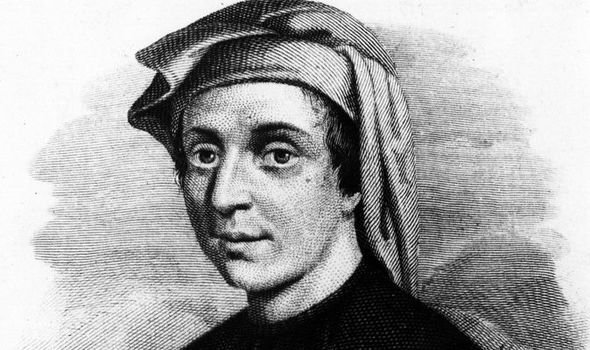
Fibonacci was an Italian man born to Gugleimo bonucci in the year 1740. He was transported to North Africa where he honed his mathematics skills at bulgia, Algeria. His full name was Leonardo Pisano Fibonacci with his last name Fibonacci meaning "son of bonucci". He was also known as Leonardo of Pisa. He had a lot of contributions to the development of numbers in human development and was a number theorist during this lifetime. He was the one who brought the Arabic numbering system following his return to Italy after his days in North Africa cause he says that Arabic numbering was easier and better.
HIs major contribution to mathematics
His major contribution to the mathematics world actually came in one of his written works which is the "Liber Abaci". It was in this work that in answering a particular question as shown below :
A certain man put a pair of rabbits in a place surrounded by a wall. How many pairs of rabbits can be produced from that pair in a year if it is supposed that every month each pair begets a new pair, which from the second month on becomes productive?"
source
This particular question led to his greatest contribution: the Fibonacci numbers, which were numbers origination from 0,1. These numbers were formed when he kept adding two previous numbers to get anew number forming a sequence like this :0, 1, 1, 2, 3, 5, 8, 13, 21, 34, 55, 89, 144, 233, 377, 610, 987, 1597, 2584, 4181, 6765, 10946, 17711, 28657, 46368, 75025, 121393, 196418, 317811, .... .This sequence of numbers is what is known as the Fibonacci numbers.

2.) Explain in depth the Golden Ratio. How to get it? Where is it? Give an example of your application through history.

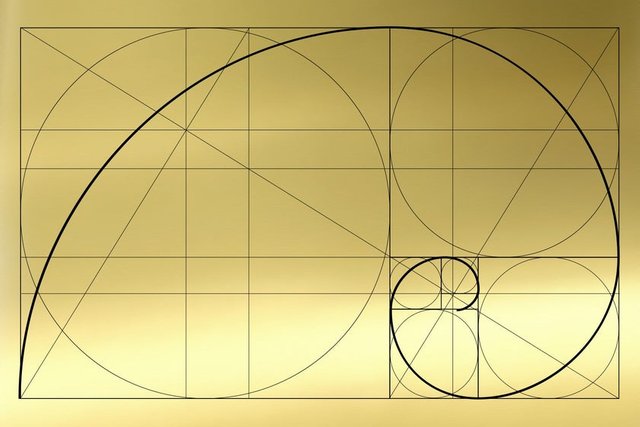 source
The golden ratio is one of the most famous ratios known to the world cause of its vast application in various areas of life. The ratio in ancient times was often found in structure with the first known structure that had this ratio being the Great pyramid of gizza. The ratio actually had a more defined history from golden rectangles whose ratio of length to breadth was known to give the golden ratio with a structure which had this golden ratio application first being the sculpture of Athens built in Greece by the Greece sculptor, Phidias. The columns which he sculpted had spaces between them which were the golden rectangles. The numerical symbol representation of the golden ratio was given the phi value to pay respect to Phidias for his contributions.
Famous artworks and instructions have applied this ratio in their production with the most famous being the Mona Lisa artwork of Leonardo da Vinci. GUESS WHAT, the golden ratio was also seen in the Fibonacci numbers created by Fibonacci. when we take the Fibonacci numbers excluding the first four numbers when we divide each number by its preceding numbers we get a particular ratio close to or equal to a particular value which let's look at it below ;
8/5=13/8/=21/13=24-31=1.618
This value is what we know as the golden ratio.
WHERE IS IT LOCATED
Like I said earlier, we can see a lot of Fibonacci applications in nature and various areas of life so let's look at these applications that are around us:
1.Pinecones: These are storage cones for seeds in pine trees and these seeds are actually stored in cones and these cones are arranged in a spiral form which looks like there spiral patterns derived from Fibonacci numbers
 source
2.Fruits and vegetables can see this in certain fruits and plants such as cauliflower where spiral patterns are seen
3.Galaxies: certain galaxies in outer space have a spiral pattern and one of these galaxies is the milky way galaxy which has a spiral pattern that is alike with the spiral pattern derived from Fibonacci numbers. From these Fibonacci numbers, we can get the golden ratios
 source
4.Human faces: We have our mouth and nose positioned at key golden areas that a spiral pattern can be derived from which is the same as the Fibonacci spiral pattern
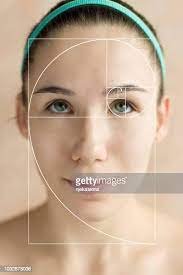 source
3.) Describe how Fibonacci is used in Tradigviews. Show screenshots

Fibonacci has a particular sequence one should use to draw it for effective results and they differ based on if it's an uptrend or if it is a downtrend. Let's give the different conditions for the different trends
UPTREND
1.WE need to find a good trending upward moving market and then identify the higher highs and lows.
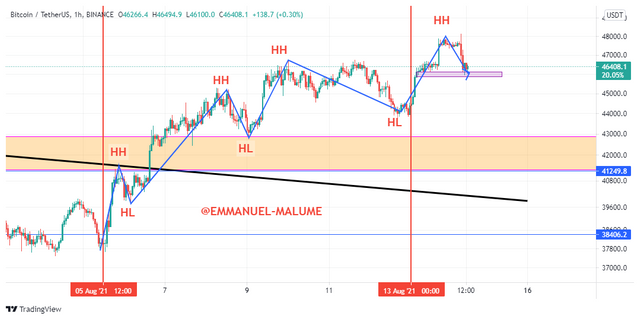
2.We mark out a low and then the following high. The low is A and the high is point B.
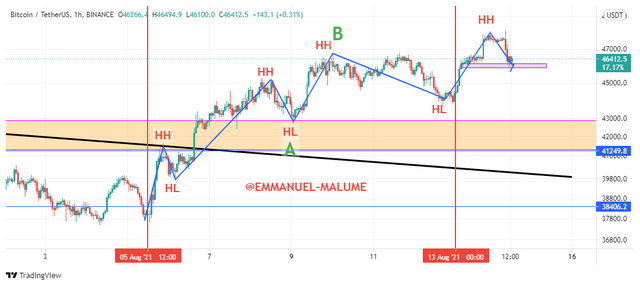
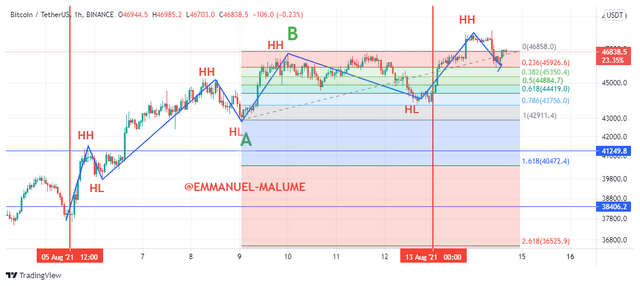
3.We now draw the Fibonacci tool from point A to point B making sure that the zero levels are at the peak of point B and point A should be the same level with 1 (100%) and B as 0(0%)
DOWNTREND
1.We also look for a good trending market but this time around a market-making lower highs and lows
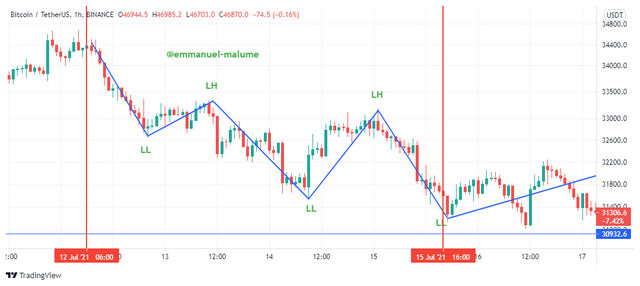
2.We identify a high and then followed by a lower low and we mark the high as A and the lower low as B
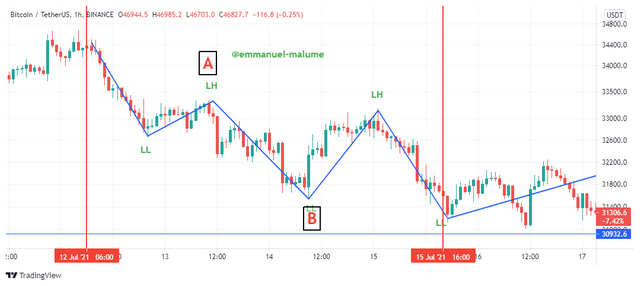
3.Draw a fib from that high A to point B with point A been marked at 1(100%) and B marked at 0(0%)
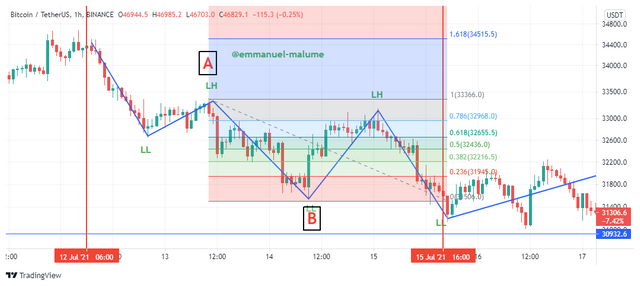
One can now sell at the 23.6% level or exit at the recent high for uptrend or recent low for a downtrend. There are certain levels, traders like taking entries from and they are mostly the 50% level and the 0.382 level.

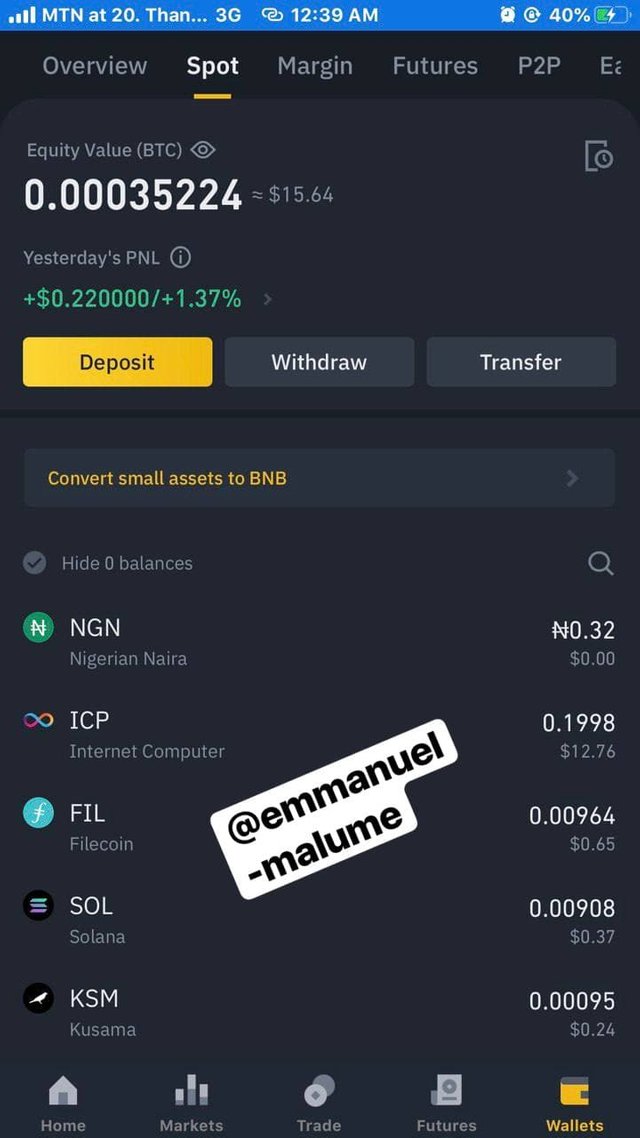
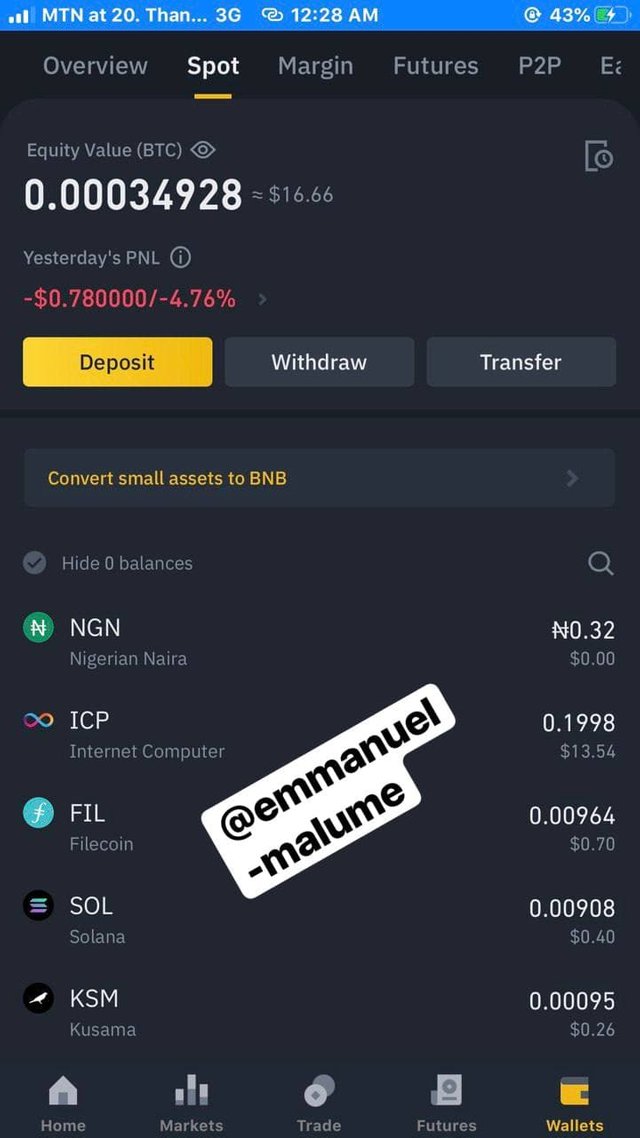
4.) Make an investment of at least $ 10 (show screenshots). Determine Fibonacci levels in the currency with which you made the investment, with a timeframe of 4 hours for a period of 48 hours. Identify possible support and resistance levels of the selected currency for a period of 24 hours (1 day) after the investment is made. Identify possible support and resistance levels of the selected currency for a period of 48 hours (2 days) after the investment is made. Show screenshots at 24 and 48 hours after the investment made with the Fibonacci levels.

I was going through the charts and then I found a perfect chart for this analysis and the chart I found was the ICPUSDT which was moving in a good uptrend and the market was in a retracing phase so I marked out a recent low and then I decided to make my investment at this level I marked out wit $13.55
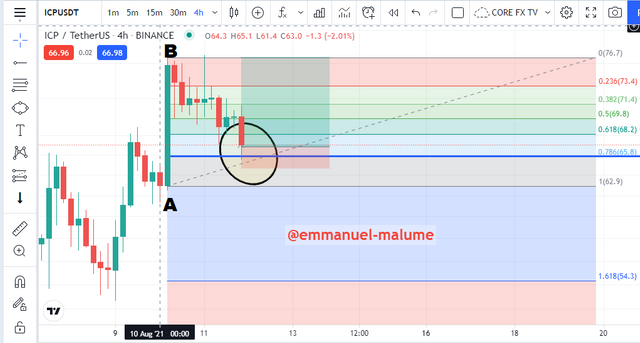
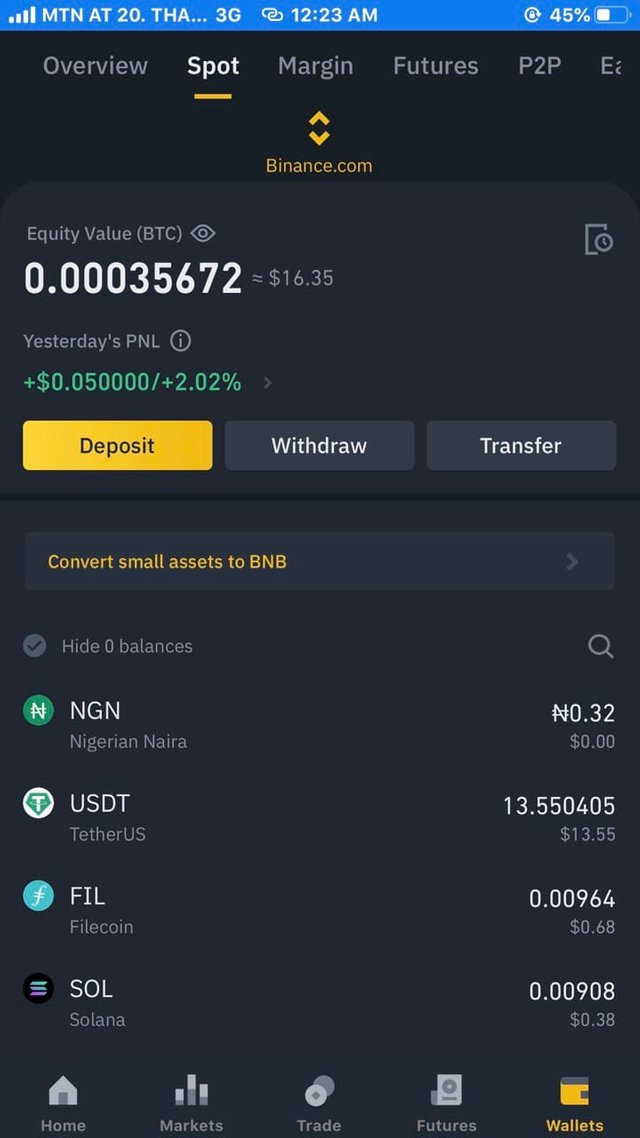
After drawing my fibnoacci realized that market was reacting from 0.788 level so i took the trade
AFTER 24 HOURS
I went back to the chart and this is what I saw
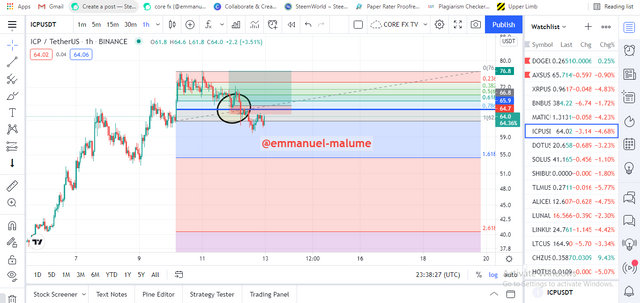
I saw that price had broken this level, even though I put a stop loss, cause I took the trade on the spot so I left the trade to run
AFTER 48 HOURS
I went back to the chart and it was a neat manipulation cause price started returning to the retracement level and was now going up

We can see how the price was reacting from this level and is now moving up showing the perfect function as a place to identify entry points in trend during their retracement moves during the trend

5) What is a Fibonacci extension?

This is one of the most used indicators used in trading by traders in analyzing stocks and different types of assets. As the name goes it is derived from the Fibonacci numbers and these numbers and then used to derive levels where a trending market after an impulse move corrects to (retraces) before it continues in its original direction.
In other words, we can say these levels are key support and resistance levels where the price is expected to react from during a retracement and then continue in its proper direction. These values are derived from the golden ratio and also another ratio which is derived by dividing a Fibonacci number by two numbers to the right of it which gives a constant value or a value close to 0.382.
These values are represented in percentages which are as follow:
0%
23.6%
38.2%
61.8%
78.6%
100%
50%
The reason I actually wrote is that the level is not derived from Fibonacci numbers but rather it's favored by lots of traders as a level where prices react often from

CONCLUSION

Fibonacci numbers have been an important part of history that has been used in various areas of life like art, structures and then was also used in generating golden ratio and the fact it is used in one of the most used trading tools which are used in combination with several other trading tools which can be used to take trades of trending market. it is good to know that the tool works best in trending markets.
Gracias por participar en la Tercera Temporada de la Steemit Crypto Academy.
Realizastes un buen esfuerzo, sin embargo, te falto agregar mayor informacion y extenderte un poco mas en tus respuestas.
Espero seguir corrigiendo tus asignaciones.
Downvoting a post can decrease pending rewards and make it less visible. Common reasons:
Submit