.png)

(1)Define Heikin-Ashi Technique in your own words.

There are different forms of charts used for analysis, example includes candlestick chart, baseline, line, area, Renko, Heiken-Ashi. Today we will be talking about a particular type which is the Heiken-Ashi chart.
Heiken-Ashi when translated means average pace indicator. This points out how it calculates data. This is a type of chart that uses previous data to print how the chart comes out. The chart uses previous close, previous highs, previously open, and previous lows. It takes a mean of these old data to print itself while working based on two-period averages. The unique thing about the chart is that unlike the Japanese candlestick where there are mixtures of green candlesticks and red candlesticks in an uptrend and also in a downtrend, with Heiken-Ashi, provided a trendline is there only a certain color is seen; green for uptrend and red for the downtrend. The color is dependent on you
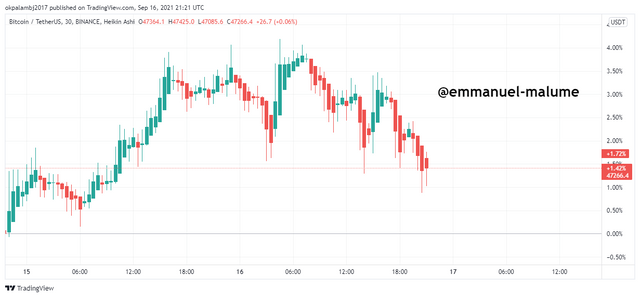
Unique Features
(1) It uses previous data
(2) It is simpler and smoother in the eyes than traditional Japanese candlesticks

- 2.Make your research and differentiate between the traditional candlestick chart and the Heikin-Ashi chart. (Screenshots required from both chart patterns)

CHART DIFFERENCE
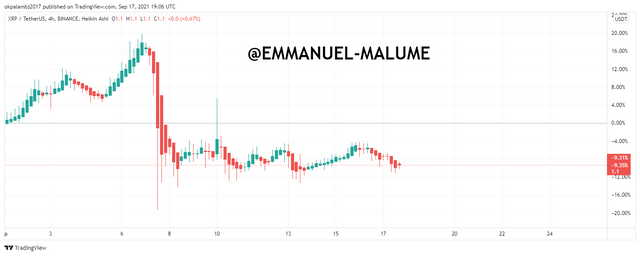
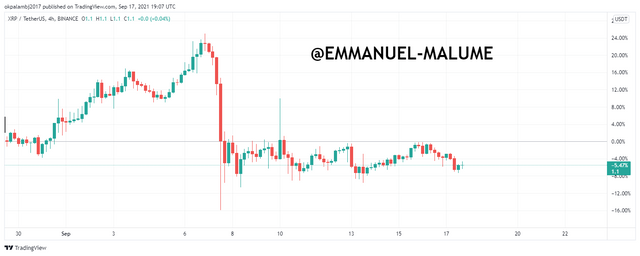
Both Screenshots taken from Tradingview
| HEIKEN-ASHI | TRADITIONAL |
|---|---|
| Closing of the candlestick Doesn’t mean that the next beginning of the next one Candle opens from there | The closure of a candle is the beginning of a next one |
| Takes an average of previous Data | Doesn’t take an average of previous data |
| Uses old data | Doesn’t use old data |
| Wicks of bullish candles are only above unless in an Indecision candle and below for red candles | Wicks can be either up or down on both normal bullish and bearish candles |
| Doesn't show gaps | shows gaps |
| Shows clear trend | doesn't show trend on its own |

3- Explain the Heikin-Ashi Formula. (In addition to simply stating the formula, you should provide a clear explanation about the calculation)

For each new candlestick, we will talk about how each part is calculated
1.Open of candle:
We are taking the average of the open and closing price by adding it up and dividing it by two
2.Close of candle:
We take an average of Open, close, high, and low of the previous candle and this means adding these values up and dividing by four
3.High of candle:
This is gotten by choosing the biggest value among (high, open and close of current candle)
4.Low of candle:
Lowest candle among current candle; high open and close

4- Graphically explain trends and buying opportunities through Heikin-Ashi Candles. (Screenshots required)

For taking entries using the technique we do the following:
Buy entries:
(1)We should wait for an indecisive move or compression in the market and then wait for the appearance of a very bullish candlestick and then we can take our entries.
(2)Provided we don’t see another compression, we can say we are still bullish
(3)It is good to set stop loss below wicks of compressions candles and then use proper risk to reward ratio for taking profits
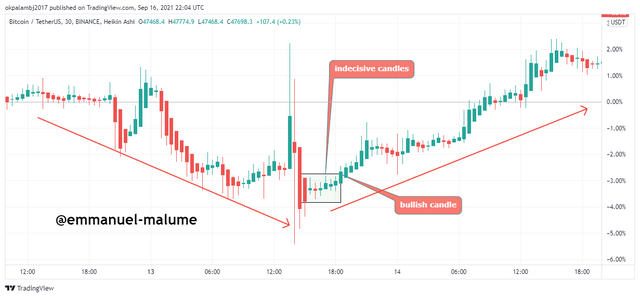
Exits
(1)Once we see indecision and compression
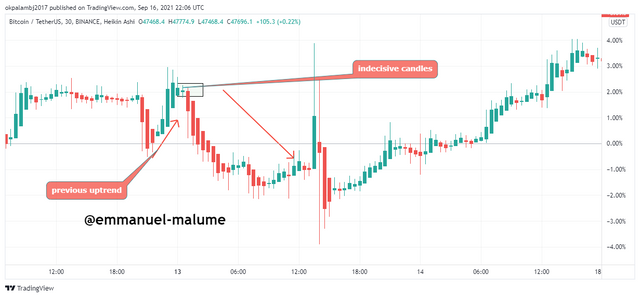
Sell entries
(1)After a good uptrend, if we see inclusive candlesticks, we watch this, and then on seeing a very good bearish candle with wide below we enter.
(2) We remain in the market unless we start seeing indecision exit
(3)set your stop loss above wicks of compression and indecisive candles
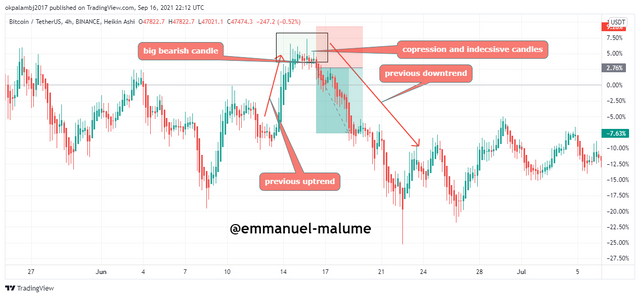
Exits
(1) Exit after seeing an indecisive phase we see a good bullish candle.
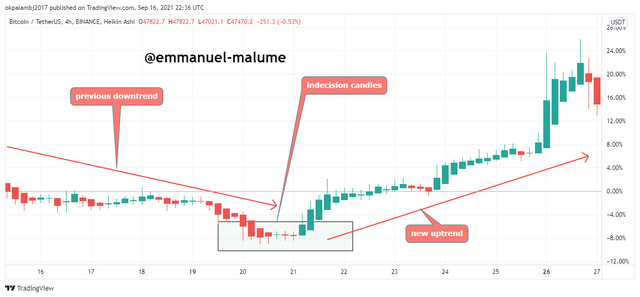

5- Is it possible to transact only with signals received using the Heikin-Ashi Technique? Explain the reasons for your answer.

Yes, it is possible to do this: The Heiken-ashi chart indicator shows trends in market value also helping to identify when these trends are probably ending using the indecision candle it prints.
how to do this?
We are going to be using the entry point I mentioned above with us monitoring the presence of indecision candles during a trend and watching to see how the next candles turn out whether it is a confirmed change in trend or not. Also with fact, this Heiken-ashi candle shows trend, one is a le to know what is going in the market with one look whether one is meant to be buying or selling

6- By using a Demo account, perform both Buy and Sell orders using Heikin-Ashi+ 55 EMA+21 EMA.

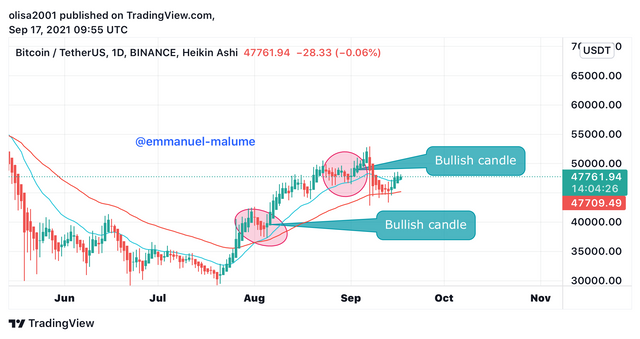
We are going to be using trading hire to take this order while loading the indicators on our charts and it will appear as below
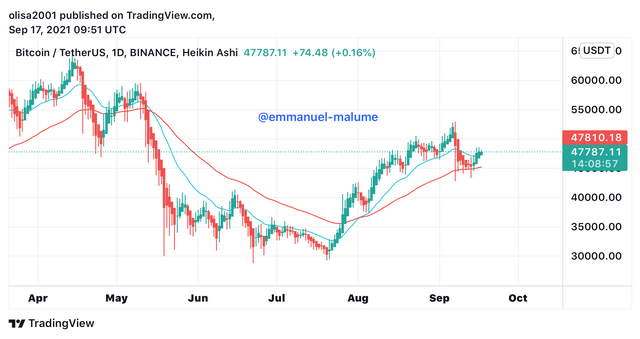
Let me talk about the strategy small before I take trades. The 21ema is the blue line while the 55ema is the red line and we take the trades like this:
BUY TRADE
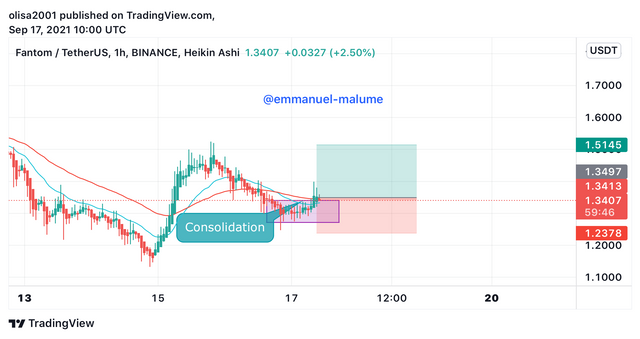
When the market is above the two indicators we can say we are in an uptrend and only look to buy and we buy after we see a good consolidation followed by a good bullish candle. An example is below :
An example is this buy trade taken in FTM
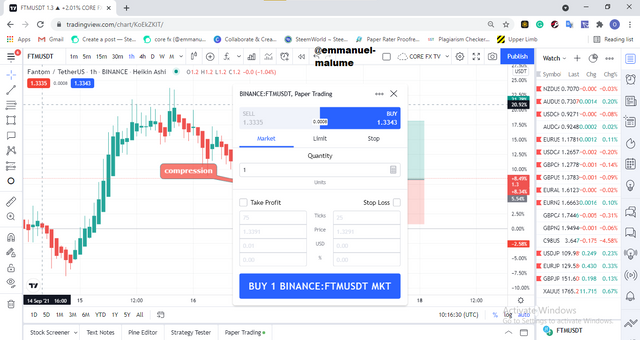
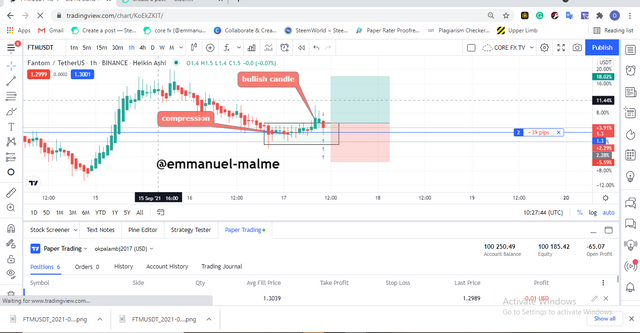
SELL TRADE
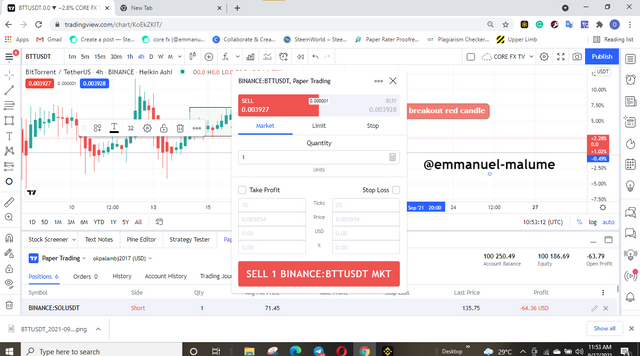
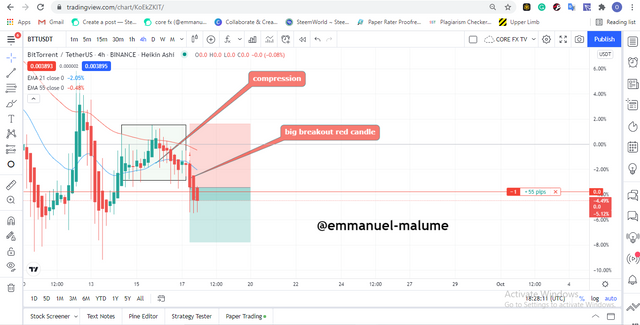
We will be using the bttusdt pair to analyze this with us identifying a consolidation followed by the candles being below the moving averages and then we see a big red candle

then we took a sell trade
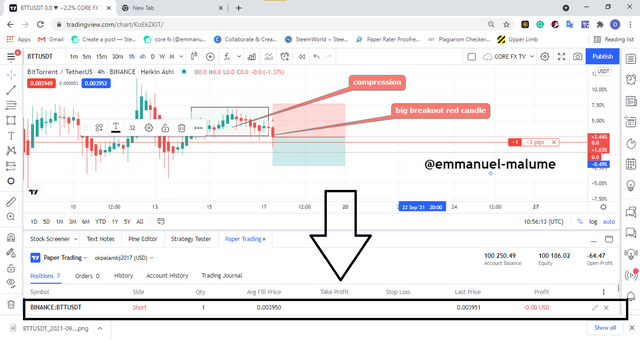
After a while,
I came back to the trade and we see trade moving in the proper direction.

CONCLUSION

The Heiken ashi candle trading strategy is a very unique candle that helps show clear trends in the market and using the two ema one can be able to verify these trends and know when to enter. the good thing about this candle is that it uses previous data to print out more candles.
Cc:
@reddileep