INTRODUCTION
This week, @sapwood delivered a lecture on the topic, On-chain metrics, and subheadings; Global In/Out of the Money and Large Transaction volumes. This delved into vital fundamental metrics required for a complete analytical outlook on any cryptocurrency.

1. What do you mean by Global In/Out of the Money? How is a cluster formed? Explain ITM, ATM OTM, etc with examples?

1.1 - Global In/Out of the Money
This on-chain metric is in the simplest possible terms; Measures the amount of individual wallets holding a token, that are making profit/loss or at a breakeven when comparing current price to the price at which the tokens were acquired. We all know that beyond the daily transaction volume, the holders in the background play a major role in the development of price. The GIOM is a smart way to monitor and predict possible actions to be taken by holders, and acquire an aggregate overview on the performance of the token.

The Global In/Out of the money
Momentum Deduced from GIOM
Changes in the ITM and OTM over a period of time can be used to check momentum in the market and determine whether there is a bullish or bearish pressure
Example

APR 20, 2021
PRICE = $2.39
ITM = 75.05k (69.91%)
OTM = 17.52k (16.32%)

Dec 13, 2021
PRICE = $2.41
ITM = 98.48k (64.77%)
OTM = 34.78k (22.87%)
At the same price range, we notice a drop in the percentage the number of wallets in the money early this year, but an increase in the number [showing more investors taking notice] and an significant increase in the number of wallets out of the money. This signifies there is currently a bearish momentum in the market, as more people bought high and this creates selling pressure.
1.2 - Clusters
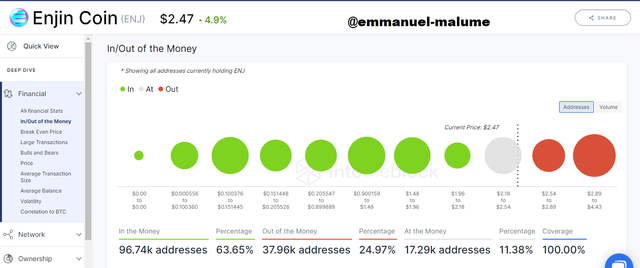
The GIOM cannot possibly grade all wallets at the exact price they acquired the token, this will be an over kill, so to make this work, the wallets are grouped into clusters. A cluster contains wallet addresses with different prices at which the tokens were acquired, within a close range. The difference in the range of prices is then used to determine the average price of the cluster. Clusters are based on the number of addresses/volume that acquired the token at a certain price range, and the size is dependent on the number of wallets found in the cluster. The larger these clusters, the more efficiently they serve as liquidity levels.

A CLUSTER
A cluster contains the following data;
PRICE RANGE
This is the range between minimum price of the cluster and the maximum price of the cluster. From the image above, the range is $0.900159 - $1.48AVERAGE PRICE
This is the mean price calculated from the price range, at which users acquired the token, within the cluster. The average price of this cluster is $1.26TOTAL VOLUME
This refers to the total amount of coins contained within the wallets in the cluster. This cluster has about 120.77 million Enjin tokens.NUMBER OF WALLET ADDRESSES
Every cluster has numerous addresses. This determines the size of the cluster. The number of wallet addresses in this cluster is about 180.04 thousand wallets.
1.3 ITM, OTM, ATM.
IN THE MONEY

This parameter refers to clusters with prices lower than the current price. This simply means all clusters made up of addresses that acquired the token at a price cheaper than its current price. From the image above we can deduce that 63.33% of the enjin wallets which comprises of 8 clusters and about 96.43 thousand wallets. These are people making profit from acquiring the coin.AT THE MONEY

This parameter highlights the cluster whose range encompasses the current market price. These wallets are said to be AT THE MONEY since they are not making significant profit or loss. From the image above, we can see the ninth cluster is AT THE MONEY, its range being $2.15 - $2.49, while price is at $2.32. In this cluster the maximum loss an address is losing is $0.17 per token and the maximum profit is also $0.17 per token.
[note: this is not always equal]
There are 16.07 thousand wallets in this cluster, and they constitute 10.55% of the addresses.OUT OF THE MONEY

These wallet addresses acquired their tokens at a price higher than the current market price and therefore they are at a loss, and as such are regarded as OUT OF THE MONEY. From the image above we have 2 OUT OF THE MONEY clusters. From the image above, we can see the numbers. These two clusters constitute 26.12% of the addresses in their metric, and this sums up to a total of about 39.78 thousand addresses. The figure from just 2 clusters might seem high but it is explained by the size of the last cluster, as it is the biggest of the lot, meaning a lot of people bought at/around the all time high.

2. Explain about Large Transaction Volume indicator with examples? What is the difference between Total and Adjusted Large Transaction Volume? Examples?

Cryptocurrency transactions involving amounts greater than $100,000 USD are labeled as large. This means, the Large Transactions Volume indicator measures the cumulative amount on the blockchain transacted in transactions with large volumes. It signals traders on the entry or exit of whales in the market.
There are two types of this indicator; Total or adjusted. The adjusted version excludes data from large transactions where the tokens were sent back to the original address. The total view does not omit data from such transactions. This means, if address X sends address Y 3,256 ENJ and address Y sends back the 3,256 ENJ to address X, the total view version of this indicator would show a large transaction volume of 6,512 ENJ, while the adjusted version would ignore these transactions and still show zero large transaction volume.

total LTV
From the above image we can see there were over 1.76 thousand large transactions recorded, within the last 24 hours

adjusted LTV
As soon as I applied the adjusted view, the noise was filtered and the figure dropped to just 761 transactions, which is less than half of the figure before the adjusted view was used.
Large Transactions Volume provides data on transactions from whales and institutions daily. Spikes on this metric indicates significant volatility from institutional players who are either buying or selling. For example, below, on Monday, April 12, 2021, there were 32.99 thousand large transactions recorded and the results can be seen as price briefly starts trading high, above the LTV line.


3. Analyzing dogecoin using GIOM and Adjusted Large Transaction Volume

DOGECOIN

First thing I look for while analyzing is support and resistance, and the GIOM is perfect for that. The clusters in the money serve as price support while clusters out of the money serve as resistance.
For dogecoin, support and resistance levels;
| Support | Resistance |
|---|---|
| $0.073961 (medium) | $0.178849 (very weak) |
| $0.023839 (medium) | $0.21172 (medium) |
| $0.002706 (really strong) | $0.254873 (medium) |
| $0.000725 (medium) | $0.302980 (strong) |
| $0.000170 (strong) | $0.479773 (strong) |
Currently, dogecoin is very close to a very weak resistance zone, and should have no problem clearing it with good momentum.

MOMENTUM

Jul 19, 2021
Price = 0.1878
ITM = 2.51m (65.27%)
OTM = 1.26m (32.75%)

Dec 13, 2021
Price = 0.1755
ITM = 2.37m (54.95%)
OTM = 1.85m (42.94%)
For just about 6 percent difference in price, there was a significant increase in the out of the money addresses and decrease in the ITM addresses. This signals bearish momentum.

January 2019 was the last recorded major spike in large transaction volume. However, a significant spike on february 2021 seems to have triggered a bullish price and this has continued, although is losing considerable momentum, spike within that range have occured periodically
In all, dogecoin seems to give bearish signs, although we should experience some bullish momentum, the $0.30298 resistance zone would pose a hard mountain to climb

CONCLUSION

The Global In/Out of the Money metric, and the Adjusted Large Transaction Volume are very nice on-chain metrics to use, and if combined with Technical analysis will dramatically increase trader's accuracy. I look forward to using this more regularly.