Introduction
Hello everyone, how are you all doing?
I welcome you all to steemit crypto academy S6 W1 homework task which is about the Starting Crypto Trading. Thanks to professor @pelon53 for his wonderful lecture on this course which helps in understanding more about the concept of the course. I will be submitting my answers to the questions that were asked.
1.- In your own words, what is fundamental analysis? Do you think it is important for a trader? Justify the answer.
2.- Explain what you understand by technical analysis and show the differences with fundamental analysis.
3.- In a demo account, execute a sell order in the cryptocurrency market, placing the support and resistance lines in time frames of 1 hour and 30 minutes. Screenshots are required.
4.- In a demo account, execute a buy order in the cryptocurrency market, placing the support and resistance lines in time frames of 1 day and 4 hours.
5.- Explain the “Hanging Man” and “Leaking Star” candlestick patterns. Show both candlestick patterns on a cryptocurrency market chart. A screenshot is required.
6.- Conclusion.
Q1. what is fundamental analysis?
Fundamental analysis can be said to be a method used to study the security value of market trade by studying the correlated financial and economic aspects like the microeconomic indicators, strategic initiatives, buyers and sellers behavior, etc, which also helps traders to know the direction of the market price is taking, we have other factors that can affect the direction the price takes, which can either be positive or negative factors to the given assets in the market.
With the fundamental analysis, traders were able to a better prediction, also using the coinmarketcal.com/en/, some traders were able to have a better idea about the market situation of some market assets.

The image above shows the layout of the site, which also helps us in getting more accurate information on the type of asset we are researching.

From the image above, we can see that there is some information written about the market asset, also the authenticity of the information provided is given with the amount of percentage provided on the asset.
Also, most traders make use of fundamental analysis because it's the best method that can be used to ascertain the actual value of an asset in the market, it also helps in searching for the assets that have a higher or lower price than their real market value. With the help of fundamental analysis, most traders were able to make better market predictions which also affect the market price fluctuations.
Do you think it's important for a trader
Yes, in my own opinion I believe so because with fundamental analysis, traders were able to make a better decision when making predictions on which direction the market will take, also as we all know, cryptocurrency is not a stable system that is static which means that we will always have fluctuations in the market price at any time either a rise in price or a fall in price.
And whenever there is a rise or fall of price in the market, we found out that the fluctuation is caused either because of some economic crises of a country which can also influence the financial situation of that country such as the interest rates, production, earnings, employment, GDP, manufacturing, management, etc, with outstanding knowledge on fundamental analysis, traders were able to make better preparation before the market experience any breakout, it also helps the traders in making any unnecessary loss while trading.
Q 2. Explain what you understand by technical analysis
Technical analysis can be defined as a method that is used to restraint and estimate the trading opportunities in the financial market, the technical analysis also helps traders in analyzing the market trends with the help of graphs and charts, with the help of the chart analysis, traders were able to have a better savvy when making their trade entry in the market, also it is necessary for traders to have a better knowledge on technical analysis before making any entry in the market because if a trader lacks the technical analysis knowledge, then that trader will not be able to make a good prediction of the market price fluctuation, which can also cause such trader a huge loss when he or she makes their entry.
there are different types of technical analysis tools that traders used to study the price fluctuation on the trading charts, which are the candlesticks patterns, drawing tools, and indicators which helped traders in making better analysis, for traders to have good market predictions, it's necessary for traders to have a better understanding on technical analysis before making an analysis, with a good understanding of technical analysis, traders were able to prevent falling on a loss.

From the chart image above, we can see that we have the technical Japanese candlestick, with the help of the candlestick, traders were able to have a better future prediction. With the right analysis, traders were able to determine the right direction the market price is taking easily, with the chart candlestick, traders were able to know when the market price is falling towards the downtrend or when the market price rises towards the uptrend.
Difference between Technical and Fundamentals Analysis
| Technical Analysis | Fundamental Analysis |
|---|---|
| 1• Technical analysis helps traders to study the past market price chart pattern that helps the traders to make better market predictions | While the fundamental analysis helps traders to study and evaluate the factors that can make an impact on the market asset so that they can understand the fluctuations in the market. |
| 2• Technical analysis is mostly used by traders that are trading in the market | While the fundamental analysis mostly focuses on investing. |
| 3• Technical analysis is mostly used by traders that focus on a short-term trade | While fundamental analysis is mostly used by traders who are more into a long-term trade. |
| 4• Technical analysis makes use of the past data for market prediction | While the fundamental analysis makes use of the present and the past data for its prediction. |
| 5• Technical analysis identifies the right time to make an entry or exit in the market | While the fundamental analysis focuses mostly on identifying the intrinsic value of the stock. |
Q3. Executing a Sell Order in the Cyprocuurency Market Using Support and Resistance
For this question, I will be using technical analysis, using the ADA/USD and the timeframe I will be using is around 4H for the analysis and trading.
ADA/USD Sell Order

From the chart image above, the first thing I did was to analyze the market price pattern by identifying the resistance level and also the support level in the market which helps me in identifying the areas where we have buying and selling pressure more. Watching the market trend for a while, I noticed that the market price is driven towards the resistance level after a sudden breakout on the support level. After a while, I observed that they are high chance the market price will be falling towards the downtrend, then I decide to take my sell position in between the support and resistance levels after I noticed that the price pattern will experience a breakout in price from the support to the resistance level after that I decided to make my stop-loss position above the resistance level. Also, I took my take-profit position at the nearest available support level which gives me the opportunity of making a profit than a loss.
Q4. Executing a Buy Order in the Cyprocuurency Market Using Support and Resistance
In this section, I will be performing a buy order trade, I will also be using the 4H time frame for the trade using the ADA/USD chart.
Buy Order Using the ADA/USD

From the chart image shown above, the first step I took was to set up my resistance and support level in order to study the market price fluctuation better, after that I noticed that the market price break the resistance level to support level which also shows that we have a high chance of the market price to have a reversal in the market.
Q5. Understnding 'Hanging Man' and 'Leaking Star' Candlestick
Candlestick is a type of chart pattern which helps traders to know and understand the direction of price in the market for certain period of time in the market, it also helps traders to have a better understanding of the market pattern. The data was collected by traders from the candle pattern are data that has been accumulated over time from market pressure and price fluctuations which helps traders to make a better prediction in the market.
The Hanging Man
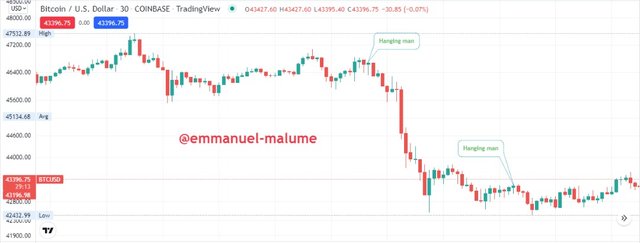
The hanging man candlestick is a candle pattern that is constructed at the top of an uptrend in the market. The hanging man also represents an imaginable reversal in an uptrend, Hanging man candlestick is illustrated as a single candlestick with a long lower shadow or wick with a small body, it mostly affects the trader's emotion regarding the price security, it also allow the technical traders to make a reasonable prediction on when to enter the market and the position that is most suitable for stop-loss in order not to make a huge loss while trading.
The hanging man pattern allow the traders to know when they is a strong fluctuation in the market price and when the bull signals loses control of the market, which also indicates that the market price will shortly fall towards the downtrend, after that, the market price won't be able to close above the high price of the hangman pattern. Also when the market price falls down the trend it signifies a long or a short position exit, with that indication the traders were able to make a better prediction when making an entry.

The Shooting Star
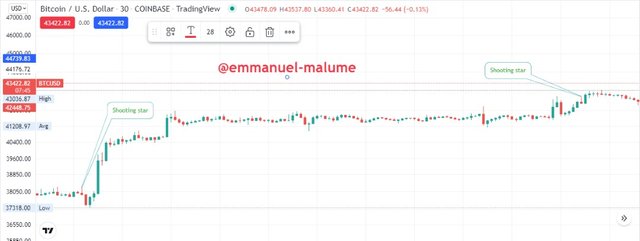
The Shooting Star candlestick pattern is a candle pattern that has a long upper wick with a little or no lower body, the shooting star is just the opposite of the hanging man candle pattern**, the shooting star normally appears after an uptrend in the market. The pattern mostly forms when the market experiences its highest uptrend in the market, after that the buying pressure will diminish considerably, then the brokers will decides to take over the market which will generate the price fall towards the downward trend.
The image below shows what the shooting star looks like in the market.

Conclusion
From all explanation, we can see how important it is for traders to have a sound knowledge on the fundamental and technical analysis before engaging in any crypto market trading, with a good understanding of those trading concept, traders will be able to avoid making much loss when trading.