.png)
Good day all, @asaj has taught us a lot today on the vortex indicator and how to use it. so lets dive into doing the assignments.

1.In your own words explain the vortex indicator and how it is calculated


The vortex indicator is an oscillator indicator that shows market trends direction, market reversals, and confirms trends. The indicator came into existence in 2010. It was created using TRUE RANGE the work of J. Welles Wilder, the man who also created RSI. This was done by Etienne Botes and Douglas Slepman
The indicator is made up of two lines: +vi line and -vi line when in default color settings when these lines cross each other we have a market reversal either from uptrend to a downtrend or from downtrend to uptrend and depending on which of these lines is above the other, we have a trend.
When the +vi line crosses the -vi line to be above we have a change to uptrend from the downtrend and when -vi line Cross +vi line to move above we have a change to downtrend from an uptrend
As much as the crossing and positions of these lines matter, the distance between the lines matter too, when the distance between the lines is large, we have a very strong trend but when we get a small distance or we see the indicators moving in the same direction, then we have a weak trend.

UNIQUE FEATURES OF THE INDICATOR

There are some important details we can point out about the indicator which include:
1.It uses old data for its calculation
2.It is made up of two lines:+vi line and -vi line
3.Distance between lines shows trend strength
4.If both lines on crossing start moving in the same direction it shows a sign of bulls and bears having equal powers leading to an indecision period

How is it calculated?

This is done by calculating the difference between lows and highs in a market during a particular period. The following steps are taken in the calculation of the vortex indicator
1.Choose a period time; the best period used for this indicator is 14 which includes 14minutes, 14 hours, 14 days, and 14 weeks. These periods were taken as the best period by J Welles wilder whose project true range was used for indicator creation. Although we can use 28 periods and 7 periods depending on market trends whether the market is ranging or trending clearly
2.Establishing trend: it uses the difference between highs and lows and which comes last after another. If a high comes after a low we have a positive price movement and if a low is coming after a high we have a negative price movement
3.Calculating time range(TR)
This is gotten by subtracting current low from current high and subtracting previous close from current High and from the current low too independently
Value-current High-current low
Value-current High- previous close
Value-current low - previous close

2.Is the vortex indicator reliable? Explain

The vortex indicator is reliable in trend detection but once the market starts ranging, we see the indicator having problems giving false information due to high volatility in ranging markets, and also no indicator is perfect working alone
To solve this problem, there are several things a trader can do
1.Changing the setting of the indicator depending on the type of marker we are in. In a normal trending market, 7 period is advisable to use as the period since it gives faster market in a trending market but when in a range, 30 is advisable cause it helps eliminate error due to volatility in prices
2.we use it together with another indicator: indicators when used together give more accuracy and vortex indicators are not excluded. We can use it with MACD for trader confirmation

3.How is the vortex indicator added to a chart and what are the recommended parameters? (Screenshot required)

1.Firstly we go to the site Trading view and click on charts
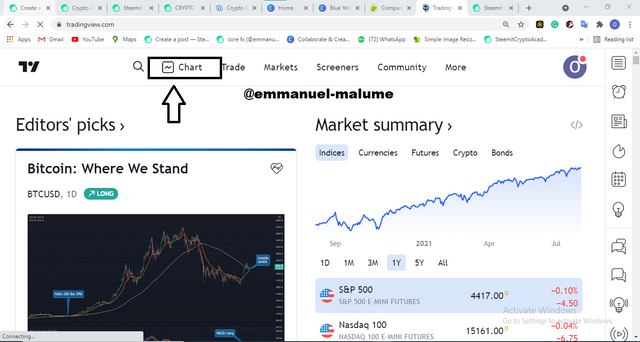
2.Click on the f sign and we see an indicator list dropdown

3.Then I searched for vortex indicator then clicked on it to load the indicator
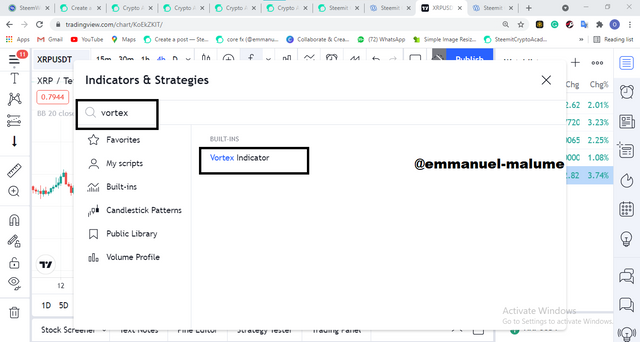
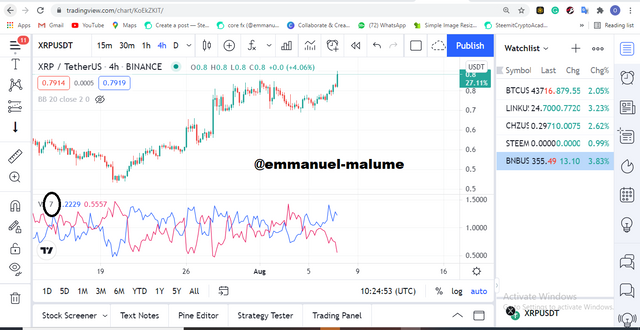
4.Look at how my chart looks after loading
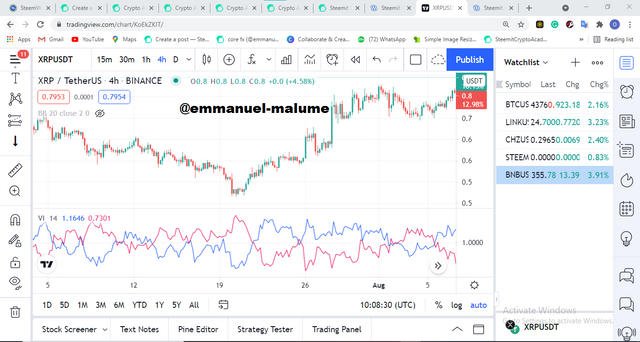
5.Now we edit the indicator by changing the parameters used to length-7. so first of all we click on the settings sign i marked below
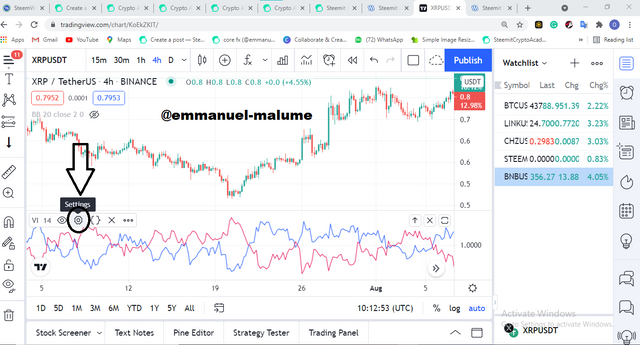
6.If we look below we can see various things I can change which input, visibility, and style(color or appearance)
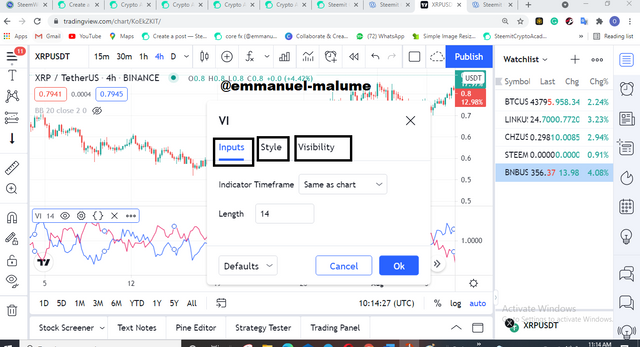
7.I am changing the period setting to 7 as we can see below
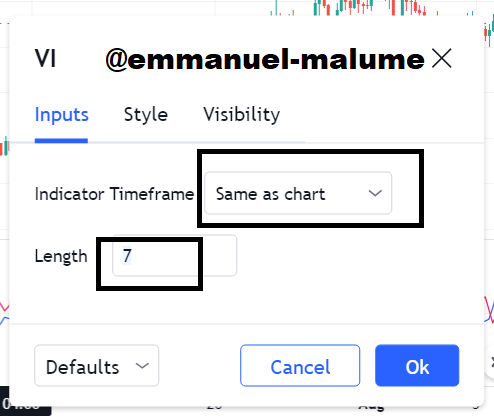
8.we see a change have occurred in the indicator and also make sure the indicator time frame is the same as with the chart
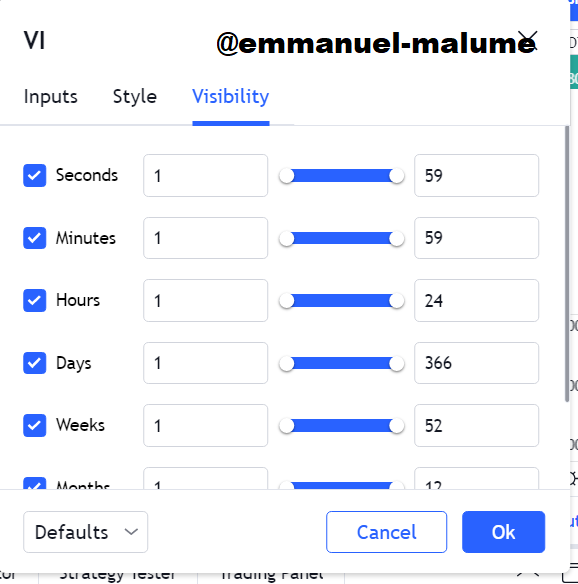
- for its visibility we are given options of time frame where we can see this indicator, you can edit it if you want
10.We can change how the lines appear in the style section too. we can see the color of the lines can be changed from here
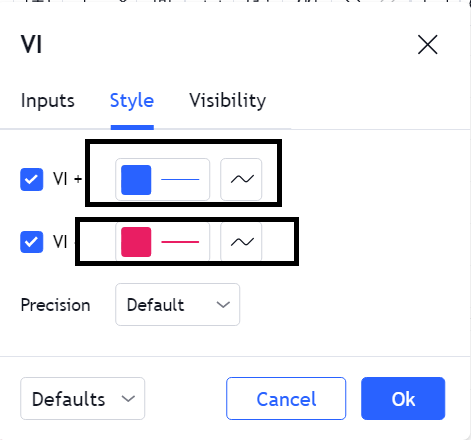

REASON FOR CHANGING THE PERIOD

The indicator has a default 14-period setting which like I said above was deemed perfect by Welles but we want fast signals that react to market change so we can enter early and not late making 7 a good period to use when we come to ranging market, 30 is preferable to cause the volatility in ranging market is high and when we use 7 we might be caught in this volatility and then enter wrong signals so we use longer periods is 30

4.Explain in your own words the concept of vortex indicator divergence with examples. (Screenshot required)

Divergence is a trading technique where the price is moving in a different direction from the indicator used in the reading price example; Price is moving upward and indicator direction is moving downwards. Divergence often lead to market reversals
There are two types of divergence:
1.Bullish divergence: Here +vi trendline making clear highs while the price is moving downwards. This is a clear guy signal for taking trades
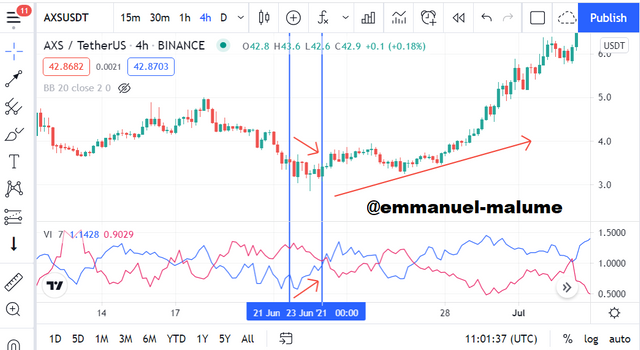
in the AXSUSDT chart, we saw price make lower highs and we see the +vi making higher high and what followed was a rise in price
2.Bearish divergence: here we see the +vi trend line moving downwards but the price is moving downwards. This is a sell signal
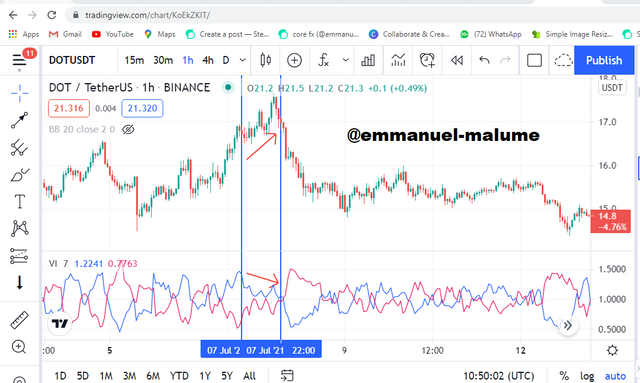
In this DOTUSDT chart above, we saw price moving upwards but our +VI line was making clear lower highs and what happened afterward, we saw price drop from there

5.Use the signals of VI to buy and sell any two cryptocurrencies. (Screenshot required)

SELL SETUP ON CAKEUSDT
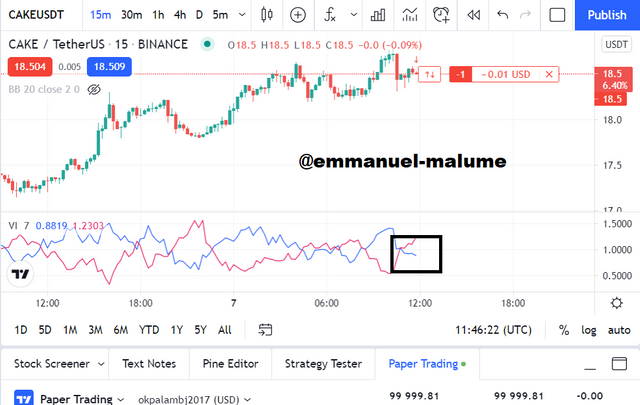

In the chart above, we saw a cross between the +vi and -vi lines, and then I put my sell trade which was triggered, and cause I am using a very low time frame, its a getting and get out the setup. I also took trade cause we can see the wide gap between the two lines after they crossed.
BUY SETUP IN DOGEUSDT
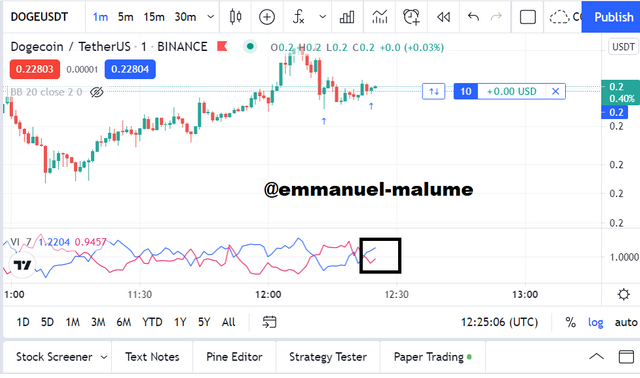

In the chart above we saw a cross of both lines with +vi line crossing to move above -vi line and I took a sell trade while also considering the distance that we see clearly between the lines. I am already in profits cause price started buying immediately from that point.I would be exiting the trade cause I am using a lower time frame so I am scalping in the actual sense

CONCLUSION

The vortex indicator is actually a good indicator taking trades but a beast when combined with other indicators too. the divergence trading is something worth learning to avoid been confused when one sees and to catch those early entries before market reversals.
Cc:
@steemitblog
@asaj
Good job @emmanuel-malume!
Thanks for performing the above task in the sixth week of Steemit Crypto Academy Season 3. The time and effort put into this work is appreciated. Hence, you have scored 6 out of 10. Here are the details:
Remarks
You have shown a good understanding of the topic. However, this work could use a bit of more originality. Also, your response to task 5 could use a bit of more depth.
Downvoting a post can decrease pending rewards and make it less visible. Common reasons:
Submit