Hello everyone, it's yet another great week in the steemit crypto academy, and happy new year to all of us.
I welcome you all once again to the last week of the fifth season in the crypto academy, which I could say I have had an amazing season so far, today I will be taking a course offered by professor @utsavsaxena11 on the topic: Trading the ultimate oscillator

Question 1:What do you understand by ultimate oscillator indicator. How to calculate the ultimate oscillator value for a particular candle or time frame. Give a real example using chart pattern, show complete calculation with accurate result.

This is an indicator that works under the system of overbought and oversold, divergence to help one get the momentum of ta crypto asset. It is a momentum indicator that can be found in the family of rsi, stochastic, and co. Produced by Larry Wiliams, it considers three periods when calculating to give one result which makes it different from other momentum indicators. This indicator produces a fewer number of signals and this can be attributed to the fact that it considers three periods instead of one /. This indicator is a single line indicator moving within the range of 0-100. It has the following regions its overbought and oversold region.
overbought=70-100
oversold=0-30
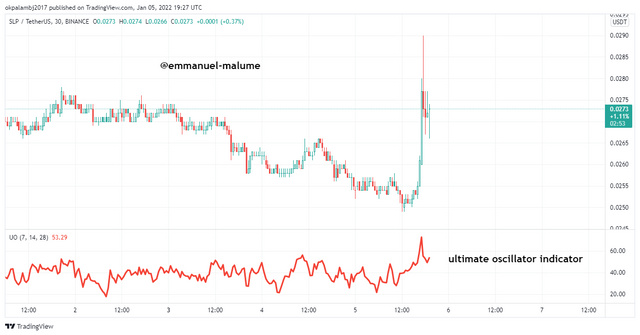
The indicator gives off two types of divergence: bullish and bearish divergence. An image of this indicator can be seen below:
Calculation of Ultimate Oscillator
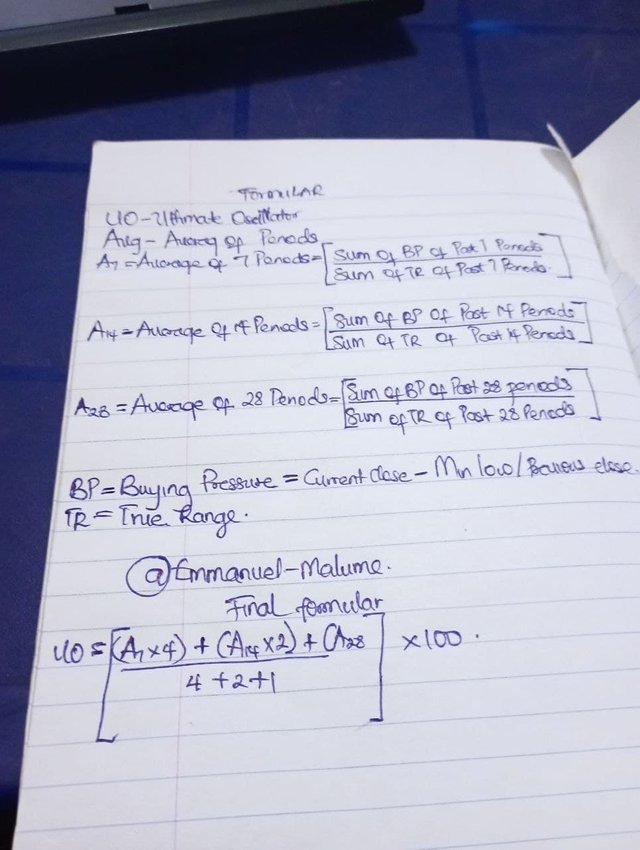
Usually, the three-period considered in this calculation is 7, 14,28. I would use a piece of paper to show the calculation and post
REAL-TIME EXAMPLE
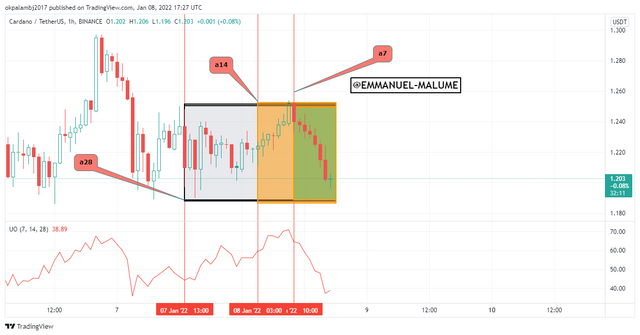
Looking at this ADAUSDT chart below, I am going to take the ultimate oscillator value of this last 28 candles and give a value return
ULTIMAT OCILLATOR VALUE IS 38.74
| periods | buying pressure | True range |
|---|---|---|
| 1 | 0.002 | 0.024 |
| 2 | 0.005 | 0.017 |
| 3 | 0.002 | 0.013 |
| 4 | 0.003 | 0.008 |
| 5 | 0.005 | 0.015 |
| 6 | 0.005 | 0.009 |
| 7 | 0.007 | 0.020 |
| 8 | 0.020 | 0.017 |
| 9 | 0.003 | 0.008 |
| 10 | 0.009 | 0.012 |
| 11 | 0.010 | 0.012 |
| 12 | 0.008 | 0.008 |
| 13 | 0.010 | 0.015 |
| 14 | 0.012 | 0.016 |
| 15 | 0.009 | 0.010 |
| 16 | 0.008 | 0.015 |
| 17 | 0.019 | 0.021 |
| 18 | 0.010 | 0.013 |
| 19 | 0.004 | 0.014 |
| 20 | 0.003 | 0.005 |
| 21 | 0.009 | 0.013 |
| 22 | 0.015 | 0.017 |
| 23 | 0.007 | 0.022 |
| 24 | 0.009 | 0.017 |
| 25 | 0.042 | 0.044 |
| 26 | 0.019 | 0.038 |
| 27 | 0.020 | 0.023 |
| 28 | 0.013 | 0.031 |
SUM OF BP FOR 7 PERIODS =0.027
SUM OF BP FOR 14 PERIODS=0.099
SUM OF BP FOR 28 PERIODS=0.286
SUM OF TR FOR 7 PERIODS=0.106
SUM OF TR FOR 14 PERIODS=0.088
SUM OF TR FOR 28 PERIODS=0.371
A7=(SUM OF BP FOR 7 PERIODS/SUM OF TR FOR 7 PERIODS)=0.25
A14=(SUM OF BP FOR 14 PERIODS/SUM OF TR FOR 14 PERIODS)=1.125
A28=(SUM OF BP FOR 28 PERIODS/SUM OF TR FOR 28 PERIODS)=0.77
UO = [[((A 7X4) + (A 14 X 2) + (A 28 ))/7] X 100]=57
The value is far different from value gotten but there is error from picking these values making it better to use an indicator which makes the work easier and we have seen how volatile the market is

Question 2 :How to identify trends in the market using ultimate oscillator. What is the difference between ultimate oscillator and slow stochastic oscillator.

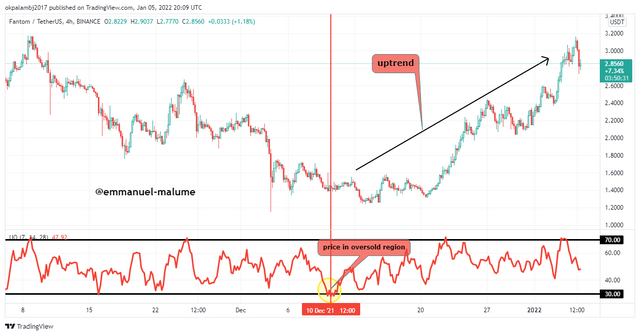
Identifying trends using this indicator we would be using the overbought and oversold regions. Using these regions we wait for the market to meet certain conditions to identify where a new market trend starts. let's look at some examples below:
UPTREND:
Here we need to see the price at the oversold region to show us of an imminent uptrend cause traders in the market feels that price has moved too low and then the influx of buyers comes in leading to an uptrend and change in market direction. we can see an example below;
DOWNTREND :
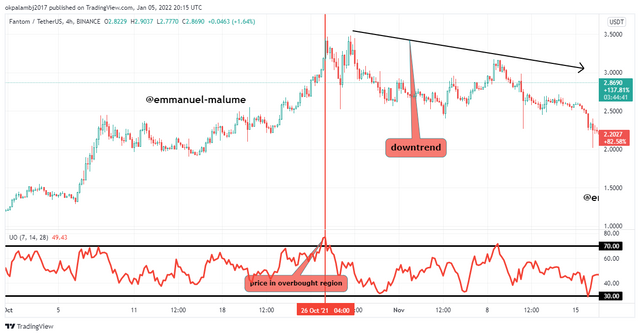
Here we use the overbought region with the market reacting from there to move and we see a downtrend with us seeing people dumping the project cause they feel that the price of the asset has moved too high leading to a drop due to the influx of sellers
Differences between the ultimate oscillator and slow stochastic oscillator
| Ultimate oscillator | Slow stochastic oscillator |
|---|---|
| It considers price in more than one period(3) when calculating. | It considers price only within a period before giving a result |
| it doesn't have the %k and %d component | it has %k and %d component |
| It was produced by Larry Williams | produced by George lane |
| Its overbought and oversold region is 70 and 30 | Its overbought and oversold regions are 80 and 20 |

Question 3:How to identify divergence in the market using ultimate oscillator, if we are unable to identify divergence easily than which indicator will help us to identify divergence in the market.

Divergence trading is one of the ways to trade the ultimate oscillator or should I say the best way to utilize the ultimate oscillator when trading buys and sells. A divergence occurs when the direction of the market is opposite to the direction to the direction o the indicator. So in trading divergence using the indicator we have bullish and bearish divergence and I would be explaining how to identify and trade the divergence effectively
BULLISH DIVERGENCE
This occurs when the market is making or should I say we see lower lows in the market but we see the ultimate oscillator making higher highs. Another condition is that we need to see that a lower low has been made within the oversold region. With these conditions already met, we can see the market move upward from there. We can see an example below:
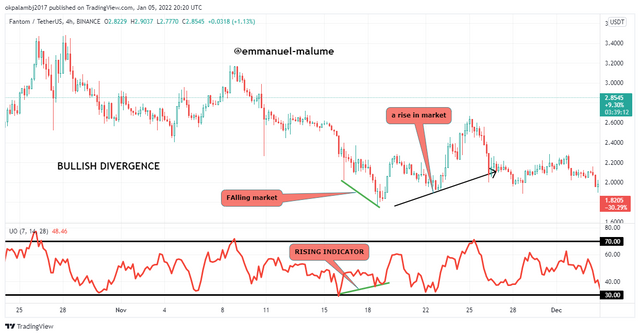
In the FTM USDT chart above we can see how price started divergence from the oversold region and then made a higher high while the market was making a lower low creating divergence and we see how price reacted and moved up from there
BEARISH DIVERGENCE
This occurs when we see a rising market[higher highs have been made]and a falling indicator. unlike the bullish that we see that low occurring in the oversold region but in this situation, we need to see that high been made in the overbought region of 70. we should now see the indicator moving below the high too.
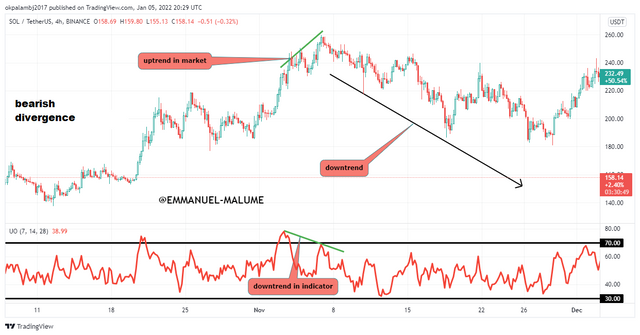
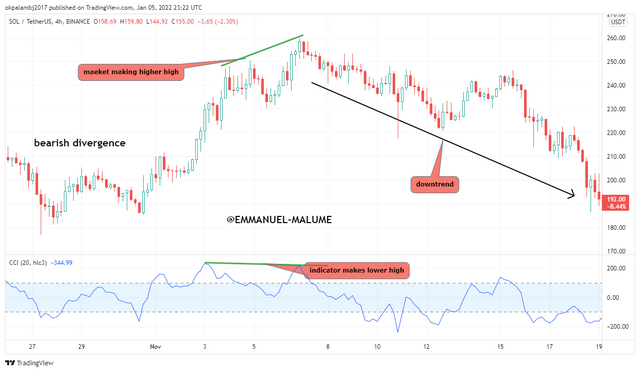
Another indicator we can use to help us identify divergence is the CCI(COMMODITY CHANNEL INDEX) indicator and this functions when we modify the setting and also use the overbought and oversold region. We can see an example below where the indicator shows a BEARISH divergence

[4]what is the 3 step- approach method through which one can take entry and exit from the market. Show real example of entry and exit from the market.

From what the professor said, using 3 steps one can easily take trade using this indicator for both buy and sell trades so now I will be showing the steps for both buys and sells differently
BUY TRADE
For a buy trade we need a bullish divergence to buy
like I said about the divergence it has to have its first low formed within the oversold region which is below the 30 level mark.
We need to see the ultimate oscillator form a higher high now above the oversold region and then we can make our entry. we can use candlesticks for confirmation times
EXAMPLE
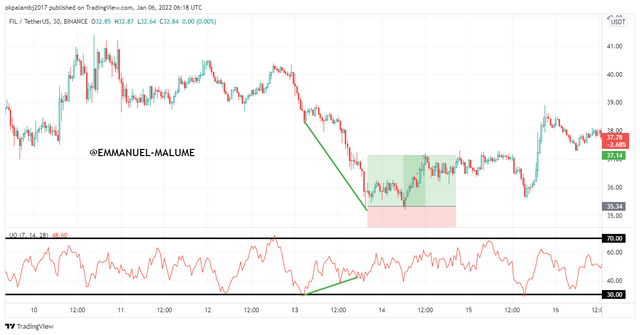
About when to take profit, I would advise taking profit or close partials when one has seen a 1:1 R: R when using this indicator, one can decide to target the overbought region as take profit or 5 levels depends on you an always use a stop loss
SELL TRADE
Here unlike bullish trade we need a bearish divergence to occur
We need to see the higher low been formed in the overbought region which is above 70 level which gives a kind of confirmation that we are seeing a potential downtrend
Then we need to see the indicator move below the overbought region to form the lower high and then we can take our sell trade while targeting either the oversold region
EXAMPLE
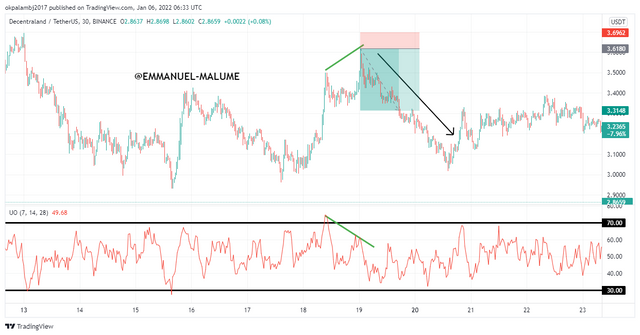
In the MANAUSDT chart above, we saw a bearish divergence starting from the overbought region and we took our sell trade-off there while targeting a 1:1 R; R target cause of what is mentioned above

5.What is your opinion about the ultimate oscillator indicator? Which time frame will you prefer how to use the ultimate oscillator and why?

the indicator is a unique oscillator but like all indicators, if backtested we see some errors and I feel that the best timeframe this indicator can be well utilized would be higher time frames like 4hr. My reason is that in using higher time frames we eliminate a lot of noise in the market and thereby increasing the chances of generating more accurate signals and also if an indicator that helps to show entry can also be added to add more accuracy it will go a long way. Another thing I noticed about the indicator is that it also lags a lot so one would enter trades later when using this indicator meaning that one may be caught in the market when there is a change it maybe not get enough profit.

CONCLUSION

the ultimate oscillator indicator is a momentum indicator which and one can use the principle of overbought and oversold to trade the indicator. Another way used to trade there is a divergence which can be bullish or bearish. The indicator although generates fewer signals making its accuracy higher, lags a lot which is a bad characteristic of the indicator but the indicator is quite okay to be used for trading when be used in a higher time frame cause there is less noise in higher time frame markets.
Thanks for the wonderful class @utsavsaxena11 on ultimate oscillator hope to see you next season if there is another one
