Edited using Inshot
In the market, the first thing to know is that prices tends to move in patterns. These patterns are identified by looking at past/historical data and spotting recurring trends or shapes. One example is the "trend line" which is a line drawn on a chart connecting the high or low points of a price series. This can help one to determine if the prices are moving up, dow or even sideways.
Closing the Window for Season 15 of the Steemit Engagement Challenge, we're been presented with an interesting topic to discuss about by the Steemit Crypto Academy which is Chartist Analysis. The Chartist Analysis is a type of technical analysis that can be used to predict future price movement and make trading decisions.
Are you ready to dig a little deeper into this concept of technical analysis? With the aid of the contest tips, here is a well detailed post explaining the "Chartist Analysis"

edited using pixellab
Chartist analysis is a technique used to analyse price trends and predict future price movements in the financial market using charts and patterns. The basic idea is that price moves in trends (which I mentioned above), and these trends can be identified by analysing historical price data.
Chartists believe that by identifying patterns in the chart, market data can provide insight, clues prediction about future price movements. By understanding these patterns, it is made easier for chartist to make better investment decisions..
The importance of chart patterns
One of the main reason chart patterns are of importance is that they can help traders identify possible buying and selling opportunities as well determining when to enter and exit trades. By making analysis of the patterns, traders can attempt to decide whether the market is likely to progress in it present direction or reverse course.
Chart patterns are also important because it can help to indicate when a market is experiencing an overbought or oversold condition, which can be useful in determining positions to take.
Chart patterns are also important because they can provide traders with clues about the strength or weakness of a trend which can help traders to make decisions about the suitable risk/reward ratio for their trades.
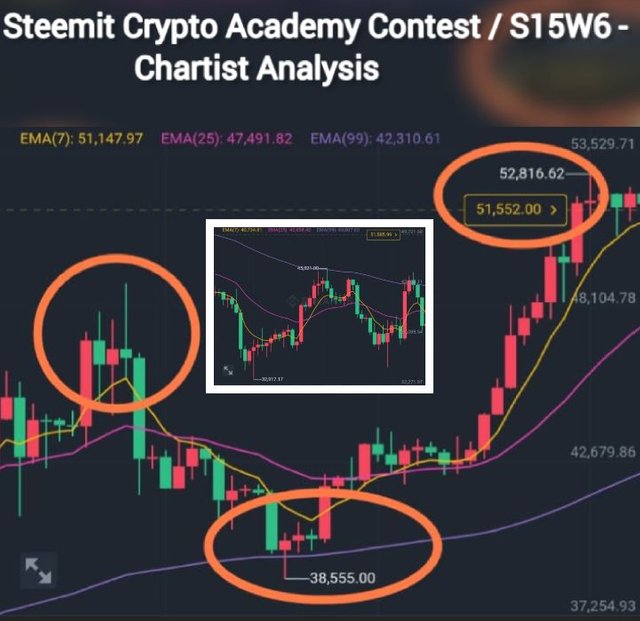
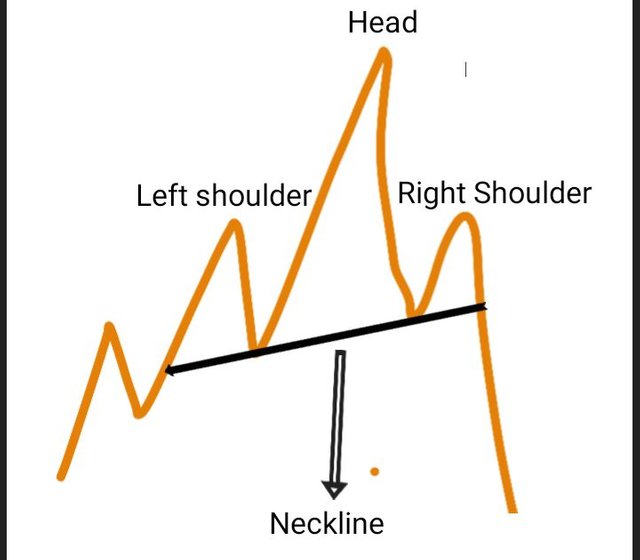
The shoulder head shoulder pattern is regarded as a reliable reversal indicator, which means that it is often used to identify when the market is about to take a change in direction(bullish-to-bearish trend reversal). The shoulder head and shoulder pattern is made up of three peaks. The first peak is known as the left shoulder, the second peak is called the head and the third peak is described as the right peak.
The shoulder head and shoulder pattern forms when an assets' price rises to it peak, and decline back to the base of the former up move. The "head" is formed when the price rises above the previous price state and then falls back to the original state.
This pattern is confirmed when the neckline, - the line connecting the first peak(left shoulder )and the second peak (right shoulder) has the price breaking below. When this occurs, it is considered a signal that the market is about to reverse direction.
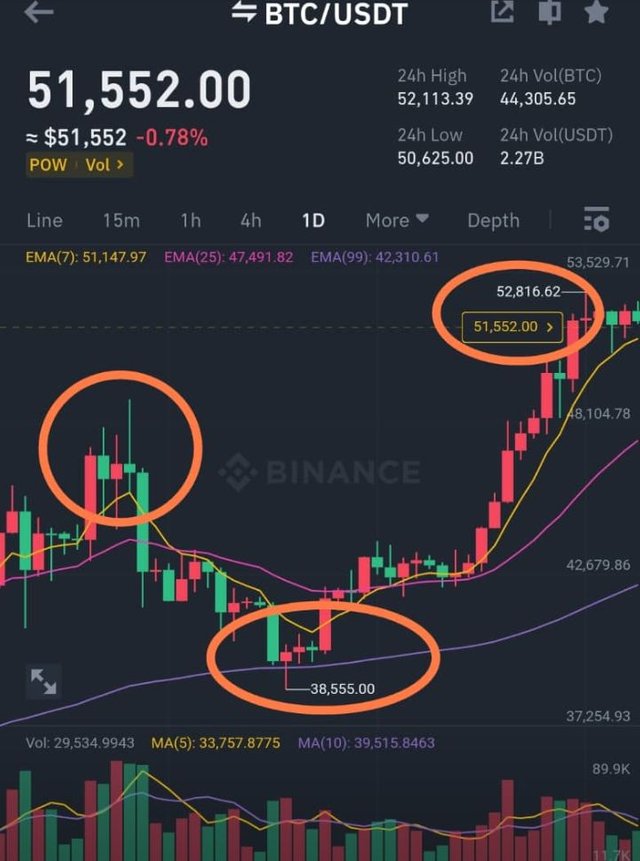
 Screenshot from tradingview app
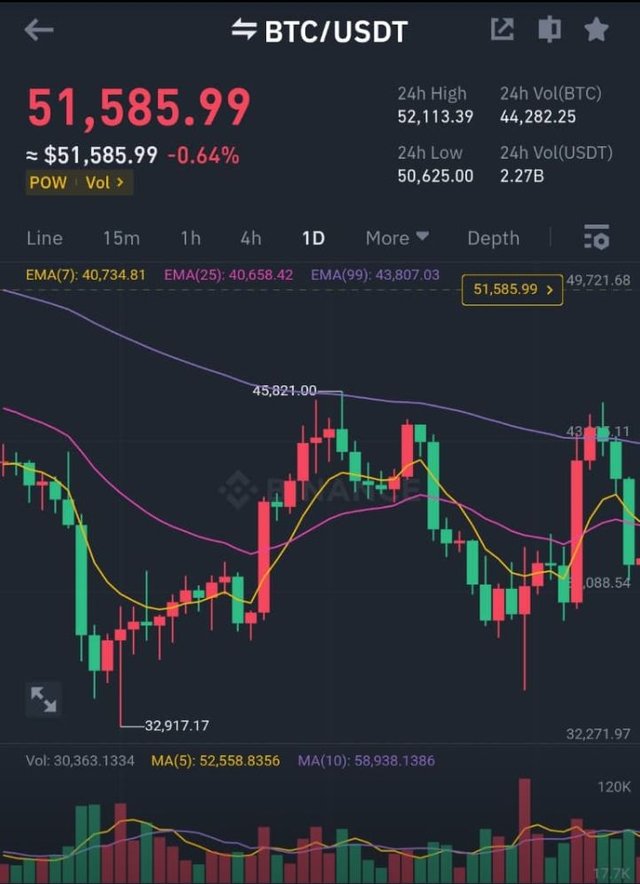
An inverse head and shoulder pattern is simply the direct opposite of a correct head and shoulder pattern. It is formed during a downtrend and is usually accompanied by an upward reversal. The formation of the inverse head and shoulder pattern begins with a low, that is followed by a higher low, forming the left shoulder (first peak). Then, the price moves up to from the head, followed by another move down to form the right shoulder (third peak).
In an inverse head and shoulder pattern the neckline is the line connecting the top of the two outer peaks. In confirmation of the inverse head and shoulder pattern, the price breaks above the neckline. Once this occurs, there shall be an upward trend in the market.

Screenshot from tradingview app
Analysing the price of Steem as well as other cryptocurrencies can be done by the aid of technical analysis using chart patterns. Chart patterns can be useful for identifying trends and predicting upcoming/future price movements. Chart patterns can be helpful because of possible identification of buying or selling opportunities as well as entry and exit decisions in trades. The importance of chart patterns above as answered in the second question is enough reason already.
However, it is very important to keep in mind that these patterns are not always to be relied on and can sometimes give out false signals. Therefore, it's important to use other forms of technical analysis such as moving averages, support and resistance levels and indicators like Relative Strength Index(RSI), and Moving Average Convergence Divergence (MACD), in addition to chart patterns. Combining this tools can help to get a more complete picture of the market and make informed decisions.
In conclusion, while chart patterns can be useful in technical analysis of STEEM and other altcoins, they should not be exclusively relied on. The past performance or price movement of an asset is not an assurance for future results, and even the most well-developed patterns can fail.
Thanks for reading
Thank you, friend!


I'm @steem.history, who is steem witness.
Thank you for witnessvoting for me.
please click it!
(Go to https://steemit.com/~witnesses and type fbslo at the bottom of the page)
The weight is reduced because of the lack of Voting Power. If you vote for me as a witness, you can get my little vote.
Downvoting a post can decrease pending rewards and make it less visible. Common reasons:
Submit
Upvoted. Thank You for sending some of your rewards to @null. It will make Steem stronger.
Downvoting a post can decrease pending rewards and make it less visible. Common reasons:
Submit
I love the way you differentiated your definition of the shoulder head shoulder and the inverse. Chart analysis is actually a very useful tool as most crypto traders use it to analyse trades and take up signals for trades. Wishing you best of luck in this challenge and looking forward to reading more of your posts.
Downvoting a post can decrease pending rewards and make it less visible. Common reasons:
Submit
Your detailed article is very dedicated about chartist analysis. You have clarified the importance of chart patterns and explained it comprehensively. The importance of using chart patterns has been explained in detail in your answer. You have shared extensive information through your article.
Downvoting a post can decrease pending rewards and make it less visible. Common reasons:
Submit
Greetings friend,
Like you've rightful shared, Chartist analysis is all about using charts and patterns to predict future price movements in the financial market. By analyzing historical price data, chartists can identify trends and make better investment decisions. Chart patterns are important because they help traders find buying and selling opportunities, determine when to enter and exit trades, and assess the strength of a trend. They're like a secret code that guides traders to make smart moves in the market. Good luck in the contest, all the best.
Downvoting a post can decrease pending rewards and make it less visible. Common reasons:
Submit
Hello Your participation in the Steemit Crypto Academy Contest on Chartist Analysis is impressive. Your explanation of chartist analysis is thorough highlighting its significance in identifying trends entry/exit points risk management and market sentiment. The inclusion of visual aids such as the head and shoulders pattern in the BTC/USDT pair adds clarity to your presentation. The inverse head and shoulders pattern is also well-explained with informative screenshots. Your insights into the technical analysis of Steem emphasizing the use of Smart Money Concept showcase your trading experience. Great job and best of luck in the contest!
Downvoting a post can decrease pending rewards and make it less visible. Common reasons:
Submit
Great reading your article. You have mentioned and explained to my understanding what chartist analysis is and how it can be useful to traders.
One it's importance mentioned by you is that it helps to show how strong or week a trend is. This is definitely true.
It also help to show the direction of the market unless if there is a news's or cash injection into the market, that changes it temporarily.
Your explanation fo the head and should and its inverse form is highly commendable.
Wishing you the best in this contest.
Downvoting a post can decrease pending rewards and make it less visible. Common reasons:
Submit
Hey friend this is such a lovely article and I really commend your good job this good job should not be stopped instead he should be improved to make you go faster on this our lovely platform and nin the world in general
Please also engage on my article https://steemit.com/hive-108451/@starrchris/steemit-crypto-academy-contest-s15w6-chartist-analysis
Downvoting a post can decrease pending rewards and make it less visible. Common reasons:
Submit