Hi everyone! This time I want to try to participate in a task given by professor @wahyunahrul from the Steemit Crypto Academy community. The professor gave several questions related to about a technical indicators called Fear and Greed Index.

Question 1
Explain why emotional states can affect cryptocurrency price movements?

Emotional condition is something that is definitely attached to a person, this also often causes a person to make decisions based only on his mood at that time. For example, if there is a moment where a person is walking in a mall and he sees a watch that comes from a famous brand, and at that time he has a mediocre money which if he buys the watch then he will run out of money and at first he not interested in buying the watch.
But there was one of his friends who instigated him to buy the clock because according to his friend the clock would make his rank higher and would be seen by many people. Because of his friend's words, he decided to buy the watch because his emotional state had changed from not being interested in buying to being interested.
From this we can see how emotional conditions can affect a decision that will be the result of something. And this also happens in the cryptocurrency market, emotional conditions can affect the cryptocurrency market which can make the price of a cryptocurrency increase or decrease. This can be caused again because the living beings who participate in the cryptocurrency market are humans who have moods and emotions that can change.
The example we see most often today is when the CEO of Tesla and SpaceX called Elon Musk makes a Tweet on his Twitter account related to cryptocurrency, it will affect the price of the cryptocurrency significantly.

Recently on October 4, 2021, he tweeted about his pet dog which is a Shiba Inu breed, this suddenly made the crypto market excited and the result was that the price of Shiba Inu (SHIB) tokens increased by almost 400% (more to be exact as much as 335.12%) in just 4 days.

This can happen because many people who are in cryptocurrency begin to experience excessive emotions and enter a FOMO condition which makes them compete with each other to buy this SHIB token to make the price of the token increase very drastically. From this we can see how emotional conditions can affect the price of a cryptocurrency.

Question 2
In your personal opinion, is the Fear and Greed Index a good indicator of the market's emotional state? if not, try to give reasons and examples of other similar indicators for comparison
Before I give my opinion about the Fear and Greed Index whether this indicator is good or not, I will first explain what the Fear and Greed Index is briefly.

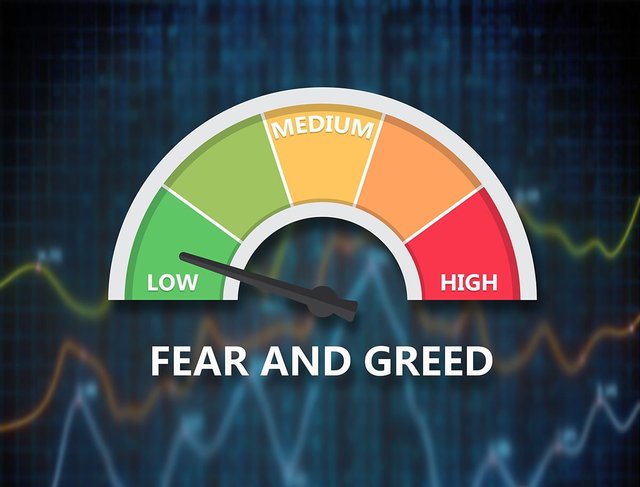
Fear and Greed Index is an indicator that shows the emotional state of a cryptocurrency market. The appearance of this indicator is slightly different from the indicators we often see on cryptocurrency charts because it has a display with a needle that will show the number where the number will represent market conditions at that time. According to the discussion made by professor @wahyunahrul, this indicator is updated every 24 hours which proves that this indicator is a daily indicator.

In my opinion, the Fear and Greed Index is a very good indicator in showing the emotions that occur in the cryptocurrency market, we can see this in the historical image of the Fear and Greed Index for Bitcoin where in the last 1 week there has been 2 times of emotional increase towards Greed and 1 time decline in market emotion towards Fear.

Then if we look at the chart of Bitcoin in a 1-day timeframe, we can see that the price movement of Bitcoin is almost exactly the same as the emotional movement shown by the Fear and Greed Index. From this we can see how accurate the Fear and Greed Index is and this indicator will be very good to be used as one of the indicators used as a benchmark in making trading and investment decisions.

But even so, we must always pay attention to using several other supporting indicators so that the decisions we take have a high percentage of accuracy and can minimize losses. There are several other indicators that we can use, such as the Average Directional Index (ADX) indicator which has been explained by professor @wahyunahrul on the topic of discussion, then there are the Exponential Moving Average (EMA) indicators, Moving Average Convergence Divergence (MACD), etc. All of these indicators are momentum indicators that we can combine with the Fear and Greed Index in making trading and investment decisions.

Question 3
Give your personal opinion on what data should be added to the Fear and Greed Indicator
As we already know from the learning topic given by professor @wahyunahrul that the Fear and Greed Index is made based on a collection of several different data, including:
- Market Volatility: 25%
- Volume and Momentum: 25%
- Social Media: 15%
- Surveys (currently paused): 15%
- Domination: 10%
- Trend: 10%
Of the six data, in my opinion, it is very suitable to be used as a reference that will be used by the Fear and Greed Index. But there is an addition that can be added to the above data types, including:
1. Social Media Data
On this data, the Altrnative.me platform takes data from Twitter as well as Reddit, which is pretty good actually. But in my opinion there are several other social media that can be used as a reference for the data, such as Instagram, Youtube, and maybe the Steemit platform.
On Instagram, there have been a lot of fan pages about cryptocurrencies that have sprung up, this can be taken into consideration that the cryptocurrency community on Instagram has started to grow and is starting to affect many people. This has also happened on Youtube, where many youtubers have created channel accounts to discuss cryptocurrencies, especially Bitcoin, and the number of views is quite large.
Then a platform similar to Reddit, namely Steemit, can also be used as additional data on social media data because there have been many communities related to cryptocurrencies that have been created, for example the Steemit Crypto Academy community.
2. Trend Data
Furthermore, trend data, in this data which is taken as a benchmark is how many search results are carried out by many people through Google with a keyword from cryptocurrency. I think this can still be improved by taking data from trend data that actually occurs on the graph of a cryptocurrency.
As we know that there are 2 known trends in the crypto market, namely the Bullish trend and the Bearish Trend, the Alternative.me platform should technically analyze the graph of a cryptocurrency and see which direction the trend is going, whether it is Bullish or Bearish.

In addition to the two data that can be improved, there are several things that should also be added to the Fear and Greed Index, including:
Added Cryptocurrency Type
Until now, the only type of cryptocurrency that supports this indicator is Bitcoin, this is actually a shortcoming that must be corrected immediately, because with the number of types of cryptocurrencies that continues to increase and many people are interested in Altcoins compared to Bitcoin, not everyone can use this indicator.
Added more variation of Time Frame
Then Fear and Greed is still an indicator that is updated once a day, this makes investors and traders who are long-term and short-term less suitable to use this indicator. We recommend that Fear andGreed should be able to add several other timeframes such as those on the indicators on the TradingView platform.
Cooperate with other platforms
Until now, the creator of the Fear and Greed Index, Alternative.me, is a separate platform, so to access this indicator you have to go through the official website of Alternative.me, this is actually not lacking because the Alternative.me platform should work with other platforms such as TradingView and CoinMarketCap which is a well-known website and is often visited by many people and is related to the world of cryptocurrencies.
If all these platforms can work together, then everyone can easily access the Fear and Greed Index from any platform that cooperates, especially on TradingView where everyone always visits the platform to check the price movements of cryptocurrencies. So this indicator will be very easy to access without having to bother opening two different websites.

Question 4
Do a technical analysis for 2 to 3 days (maybe more) using the Fear and Greed Index and the help of other indicators. Show how you made the decision to enter the cryptocurrency market and explain the results of your trade (Screenshot Required)
Now I'll trade using the Fear and Greed Index on Bitcoin with the BTC/USD market. Because this indicator is a daily indicator, I will use a smaller timeframe of 5 minutes so that the price movement of Bitcoin will look more varied.
Then as an additional indicator, I will use the Exponential Moving Average (EMA) indicator, this indicator I chose because in my opinion it is an indicator that is able to show the average price movement of a crytocurrency very well. Then if we combine them into 2 indicators with varying lengths, then we will be able to see the current trend in the market, whether the trend is bullish or bearish. The length variations of the EMA indicator that I will use are 50 and 100.
To make this trade, I will be doing it on a Demo account of Paper Trading which is on the TradingView platform.
Trading BTC/USD 5 Minute Timeframe
As we can see in the image below that the Fear and Greed Index on that day showed the number 74 which states that the emotional condition of the market is experiencing Greed emotion, which means that currently there are many people who have made purchases of Bitcoin who have made it possible. the price of Bitcoin is currently too high (Overbought).

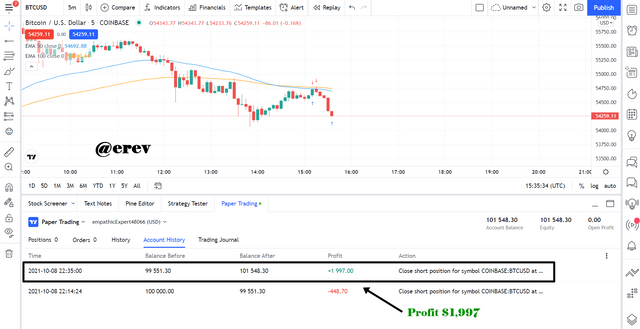
Then I re-analyzed the BTC/USD chart using the help of 2 Exponential Moving Average (EMA) indicator lines with lengths of 50 and 100 respectively. And from the analysis results, it can be seen that market conditions at that time had improved from a Bullish to a Bearish trend, this was marked by the intersection of 2 EMA lines which made the 100 EMA line already above the 50 EMA line which is called a Death Cross and an indication of a decline. the price of Bitcoin is already very large.

Then I decided to make an entry in the Sell position because I think the two indicators currently used have given a strong signal that Bitcoin will decline and the price of Bitcoin is too expensive to buy.

I made a sell entry at $54,693.41, with a take profit level at $54,295 and a stop loss at $55,097 which is the same as the resistance level. The Risk/Reward ratio that I use in this trade is 1:1.
Then after a while, the trades I made on my demo account paid off where I managed to get a profit of $1,997 using the Fear and Greed Index and also the Exponential Moving Average (EMA) Indicator.

From this we can see that the Fear and Greed Index can really be relied on as one of the benchmark indicators for making trading decisions, with a note that it must be combined with other auxiliary indicators.

Conclusion
The Fear and Greed Index is a very good momentum indicator and can be used in making trading decisions on the cryptocurrency market. Although this indicator has drawbacks, such as only being able to show the emotional state of the market within 1 day, the conditions provided are sufficient for some types of traders. And the accuracy is quite satisfying and often right on target
Then for the types of cryptocurrencies that support this indicator, it should be added quickly, because it's quite a shame that such a good indicator can't be used on cryptocurrencies other than Bitcoin where we know the cryptocurrency market is already very large and the types of cryptocurrencies circulating are already very large.
Even so, I personally highly recommend to anyone to use this indicator as a guide in trading on Bitcoin, because the level of accuracy is very good, and the type of display that is easy to understand will make this indicator easy for anyone to use.
I thank professor @wahyunahrul who has given lessons on a very unique topic like this, I really get new knowledge from this given topic.