INTRODUCTION
Good morning crypto academy,
Its always a great time in steemit crypto academy.
I am Okore Ezekiel Precious. Username @ezege11 on here.
It is always a pleasure to learn from our renowned professors especially professor @lenonmc21.
To the topic Trading Strategy with the VWAP indicator I'll be performing the given task below. Hope you enjoy your reading.

QUESTION 1
Explain and define in your own words what the "VWAP" indicator is and how it is calculated (Nothing taken from the internet).

The acronym VWAP stands for Volume-Weighted Average Price. This indicator is one of the multiple indicators that helps guide traders in making perfect market decisions. VWAP depends on price and volume and gives the trading price's average of any pair.
VWAP indicator like moving average is a single line that moves along the direction of chart price. VWAP gives trader a hint of the market moves and direction as well as asset's value at a given time.
VWAP is peculiar in the sense that it maintains the same appearance in all time frames unlike other indicators that changes form in different time frame. i.e in 15min, 30min, 1hr, 4hr, time frames, VWAP maintains the same form.
Although VWAP is similar to moving average but it differs from it in the sense that moving average measures the sum of closing price divided by the given period while VWAP measures the product of the price sum and volume divided by total volume.
How To Calculate The VWAP indicator.
VWAP have three vital components which are incorporated in the name Volume-Weighted Average Price.
The components are;
- Volume of traded asset
- Number of daily candles
- Price
To calculate VWAP you add the price traded over a given period of time and the volume of the trades asset and divide it by the number of candle in the day.
Statistically,
- VWAP = (price + Volume of traded asset)/ Number of daily candle

QUESTION 2
Explain in your own words how the strategy with the VWAP indicator should be applied correctly (show at least 2 examples of possible inputs with the indicator, only own charts)?

Before i explain how to use VWAP indicator on chart, I will explain how you can add the indicator on the binance chart.
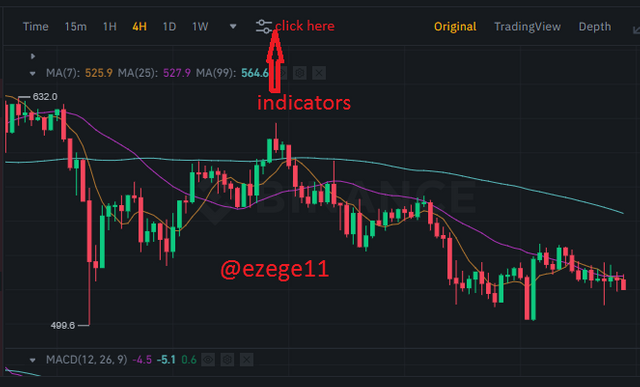
- Visit www.binance.com and open the chart of your choice pair, locate the indicator icon and click on it.
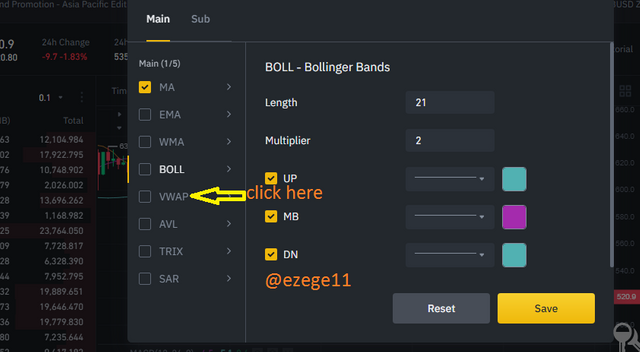
- You'll see indicator page on your screen then click on VWAP and "save" to add it.
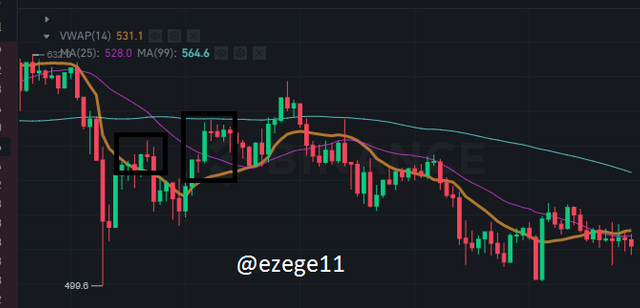
Once you've done that, VWAP is chosen and it will appear on the chart.
Directions to follow for accurate execution of VWAP indicator
Below are the steps to follow in order to correctly use VWAP indicator;
- Check for bullish or bearish break out: using the current market trend, you have to identify the last low or high and wait for a break out in this low or high.
- Retracement to the VWAP using fibonacci: when you've discovered the breakout the next thing to check out for is price retracement. After an impulsive leg that break the previous trend, price is expected to retrace.
We then watch as the price traces back to the VWAP indicator. Then, using fibonacci retracement we measure from top of the impulse to the bottom or from the bottom to the top as the case maybe. Then we monitor levels 50% and 61.8%, these are the two entry level for the VWAP indicator.
Screenshot from tradingview.com
- Risk Management: when making a trade, the risk to reward ratio should be at least 1:1.5 or at most 1:3.

QUESTION 3
Explain in details the trade entry and exit criteria to take into account to correctly apply the strategy with the VWAP indicator?

Making an entry and exit using this indicator quite simple provided that the above listed steps have been met. They include;
We must make sure that there is a breakout in the trend. i.e the old high or low must be broken, this is a very important one because without the breakout, the strategy may not turn out good.
We must make sure we monitor the retracement closely. We must wait to see price coming back to the point from which it broke out.
Using the fibonacci retracement, we join the low level to the high level of the impulsive leg, which is the cause of the breakout.We must maintain a healthy risk to reward ratio. A risk to reward ratio of at least 1:1.5 to 1:3.
Below are examples of buy and sell orders;
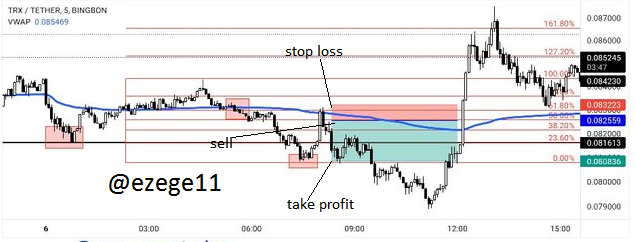
Sell order of TRX/usdt pair on tradingview.com
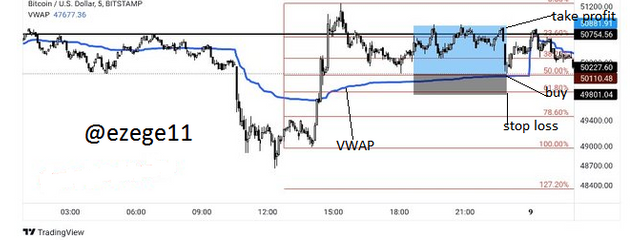
Buy order of btc/usdt pair on tradingview.com

Question 4
make two entries (one bullish and one bearish), using the strategy with the VWAP indicator. These entries must be made in a demo account, keep in mind that it is not enough to just place the images of the entry, you must place additional images to observe their development in order to be correctly evaluated.

This is the practical aspect of this assignment and I will make two entries here (a buy order and a sell order)
Buy Order
Using the VWAP strategy I'll be making a buy order on the BTC/USDT pair. The first thing to look out for when using this strategy is the Break out from the trendline. On opening BTC/USDT chart i saw a breakout.

Then i placed my trade.
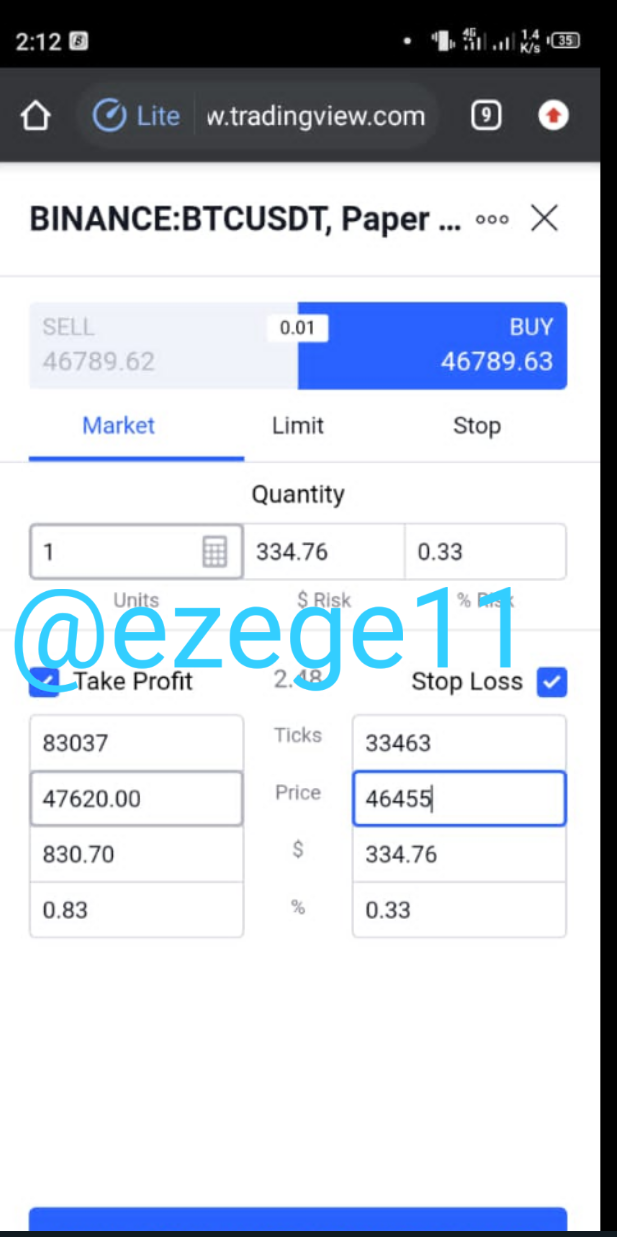
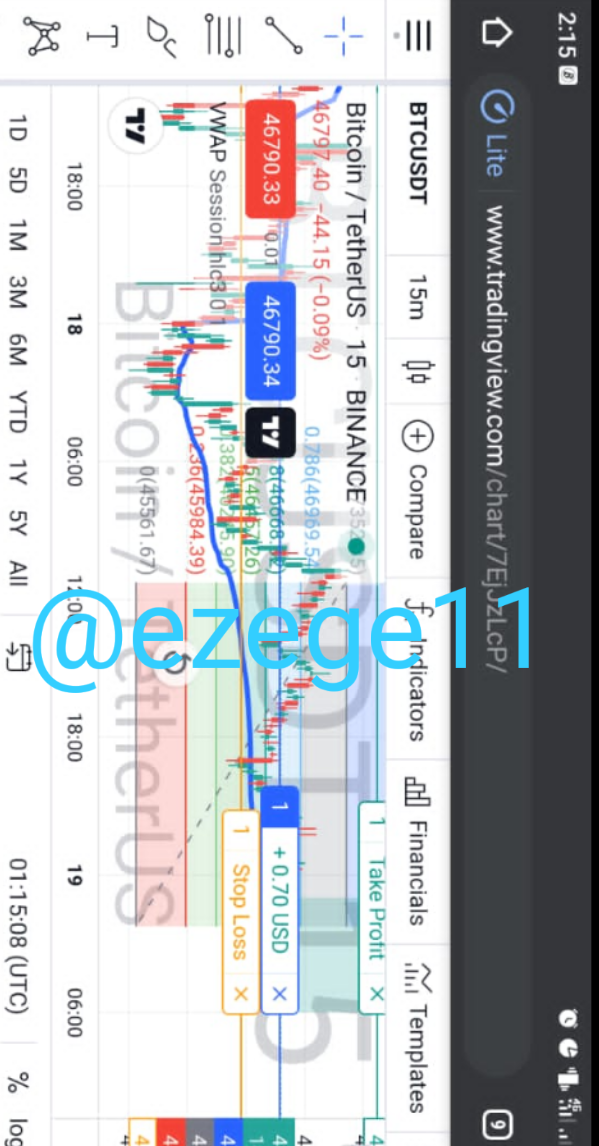
Below shows the progress of my trade and I'm on profit.
Sell order
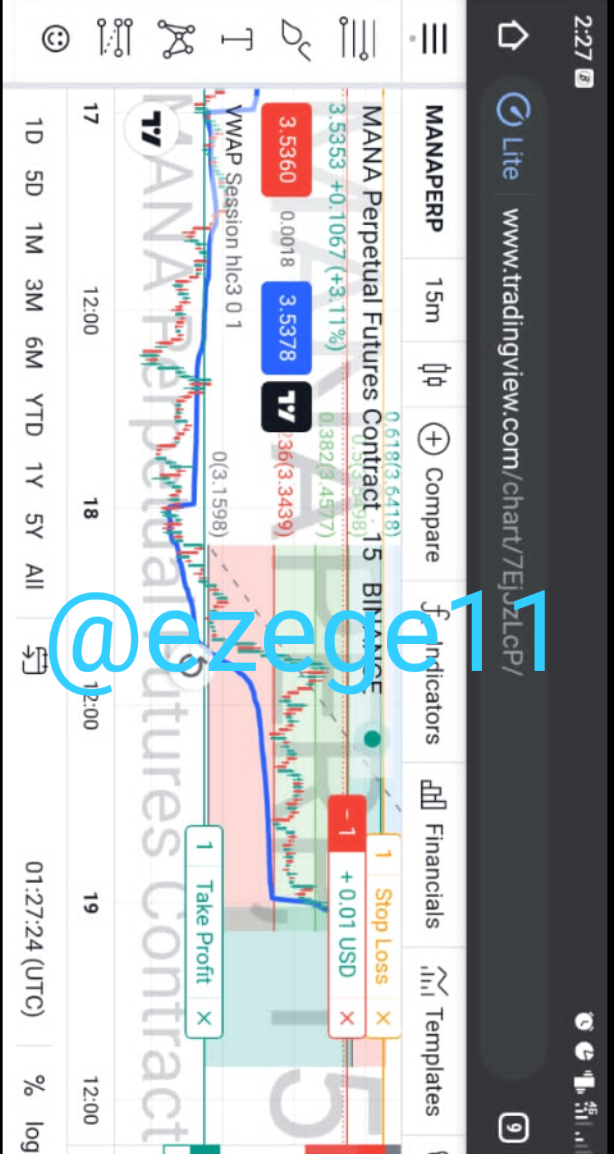
I'll be making me sell order using Mana/usdt chart.
And from the screenshot below we can see that the market obeys the let down rules or criteria which I listed earlier.

Then i placed my trade
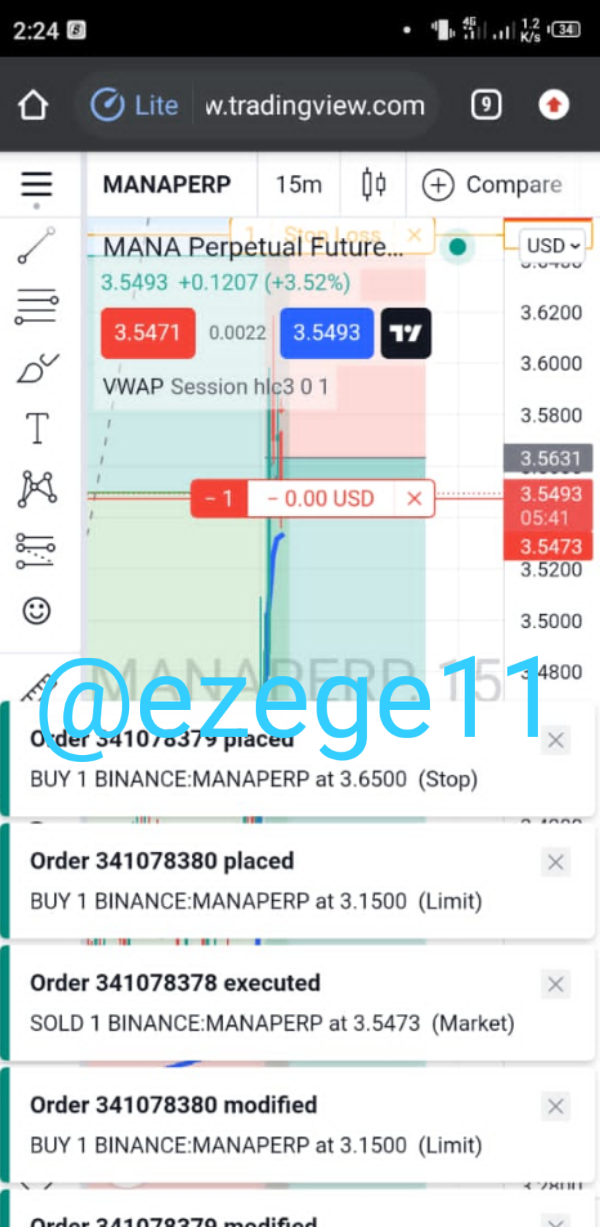
And i waited for few minutes for my trade to enter profit and below is the progress of my trade.
Note: all untitled pictures in the above task were gotten from tradingview.com

CONCLUSION

All thanks to prof. @lenonmc21 for this great lecture on vwap indicator.
It is a very interesting one I must say.
