INTRODUCTION
Greetings crypto academy,
Its my pleasure to be part of the season 5 week 4 steemit crypto academy class.
The topic Trading using rectangle pattern. by prof. @sachin08 is a very interesting one.
This blog by me @ezege11 is my response to the task given by the professor to ascertain my participation in the lecture.

QUESTION 1
Explain rectangle pattern in your own words.
Traders in the crypto space makes use of different patterns and tools in making market decision. It is believed that a market id either trending (uptrend or downtrend) or ranging. In a ranging market, the market is in a state of indecision, but in a trending market, the move is clearly in a particular direction, either bullish or bearish.
In a trending market, at a point it consolidates and forms different trading patterns including rectangle pattern.
It is important to note that in a rectangle shaped pattern, the length is always greater than the breadth and at such it can't be seen in a trending market.
In this rectangle pattern, the horizontal line placed at the top serves as the resistance while the horizontal line below serves as the support.
Rectangle pattern gives the trader a hint of where the market will be going depending on the point the pattern forms. We have rectangle top (if it forms above or in an uptrend) and a rectangle bottom ( if it forms below or in a downtrend).
In a nut shell, rectangle pattern is a pattern that occurs when a pair is ranging, it doesn't occur in a trending market.
Rectangle pattern entails that both buyers and sellers are struggling to take over the market without any of them having full control of the market. As the price tests the resistance line, sellers tends to pull the market down, and when the price touches the support line the buyers pushes the price upwards. A breakout occurs (which can be upwards or downward) depending on who gains control of the market.
The rectangle pattern in the diagram above is a bullish rectangle pattern.

QUESTION 2
How to identify rectangles. Explain with screenshots.
Rectangle pattern seemingly is among the hardest patterns to denote in a chart, but it is very essential when found in a chart.
To make rectangle pattern identification easy, there are few simple but important steps to take
Step 1 - determination of market trend: to successfully identify a rectangle pattern, you must be able to determine the market trend because rectangle pattern only occurs during a pause in an uptrend or in a downtrend.
To determine a market trend, you should first determine the formation the price is making. (High high, high low, low high, low low).

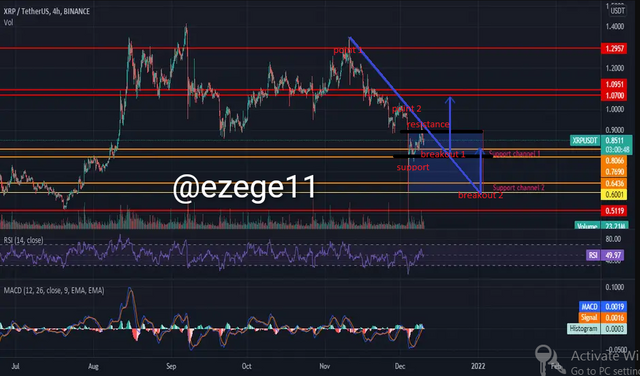
In the picture above we noticed that from point 1 that the market begun a downtrend with point 2 showing a lower high, and between the resistance and support the rectangle pattern formed.
Step 2 - identifying a pause in the trend: it is important to know that a pause in a trend could bring about rectangle pattern. So for that reason, we should look out for for this point.
Step 3 - Confirmation of support and resistance: the last but not the least step in identifying a rectangle pattern is confirming the support and resistance zones.
We do this by joining at least two to three highs to form the resistance and joining two to three lows to form the support.
The picture above shows what a resistance and a support zone looks like in a market.

QUESTION 3
Can we use indicators with this pattern to get accurate result? Explain with screenshots.
Rectangle pattern is a very good pattern and i must say we can use it to get an accurate result.
Although patterns can be faked sometimes, to that effect to confirm the authenticity of a pattern, indicators should be used.

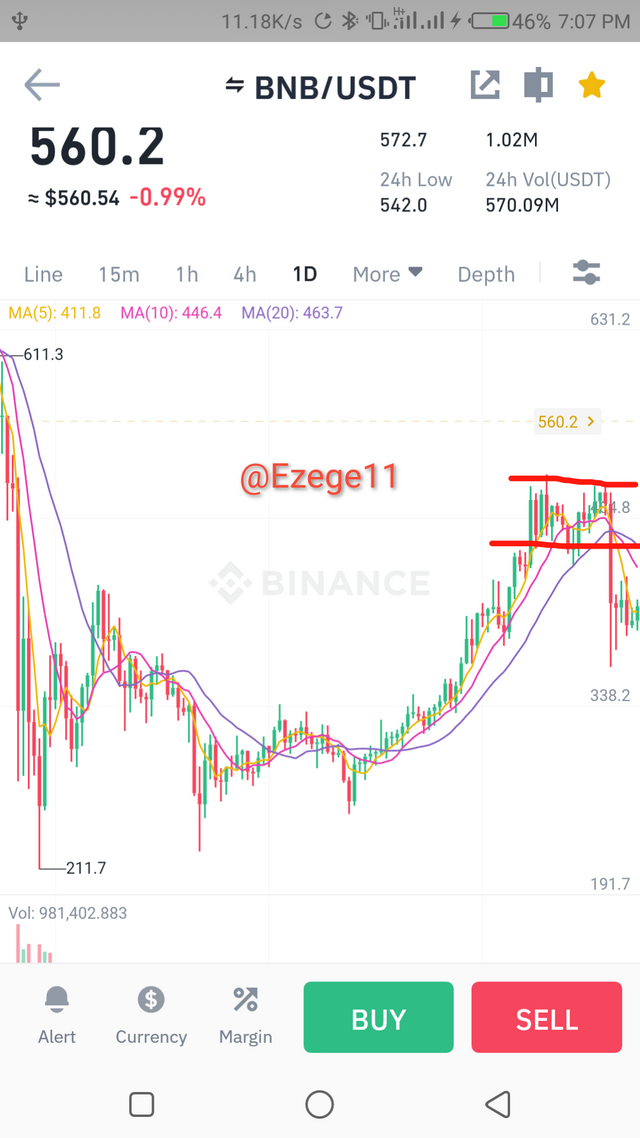
Bnb/usdt pair fromSource
The above screenshot is a daily chart of bnb/usdt where i spotted my rectangle pattern after a bull run. In confirmation of the pattern i used the moving average indicator.
The next trend is bearish and that is why you can see that the yellow line crossed the purple line in a downward direction. And with this confirmation from the moving average indicator, i can place my sell order.

QUESTION 4
Explain rectangle tops and rectangle bottoms in your own words with screenshots of both patterns.
In identifying a rectangle pattern there are two important horizontal lines to use. This lines must be parallel to each other, these horizontal lines are the support and resistance lines.
The support and resistance must be gotten from joining at least two points.
When a rectangle pattern forms on the top of a trend it is a rectangle top and when it forms in the bottom of a trend it is known as a rectangle bottom.
Rectangle Top
This rectangle pattern forms after a bullish run and the price goes in from the bottom.
The first point to be established here is the resistance point which pushes the market down to form the first support point.
From the picture above, you can believe that the rectangle top forms after a bullish run with the red and green lines indicating the resistance and support respectively.
Rectangle Bottom
The opposite of the rectangle top is the rectangle bottom. Here, the rectangle forms after a downtrend. The price enters from above and forms the first support then goes up to form the first point of resistance.

Source
From the above image you will notice the rectangle formed after a long bearish trend.
The bearish trend run from the point 1 to the point the first support point was formed.

QUESTION 5
Show full trade setup using this pattern for both trends (entry point, Take profit, Stop loss and breakout)
Buy trade setup using rectangle pattern.
.png)
Xrp/usdt chart from [Source](trading view.com)
The picture above displays my setup for XRP/USDT pair. My break points were identified and labelled in the chart, I also put my stop loss and take profit into consideration.
The parallel horizontal lines serves as the support and resistance lines, and the breakout in the support line shows a new trend movement.
Sell Trade Setup Using Rectangle pattern.
.png)
Btc/usdt daily chart from source
The picture above is a chart of btc/usdt pair which I used in setting up my sell order. I was able to identify my stop loss, take profit, my entry point and the chart breakout.
The breakout shows a bearish signal that was why I placed a sell order at that point.

CONCLUSION
Trading patterns as well as indicators are very important in making trading decisions.
Rectangle pattern when spotted well can be profitable to a trader.
In this blog, I've been able to exhaust my knowledge about rectangle pattern including easy ways of identifying It in a market.
My appreciation goes to my amiable prof. @sachin08 for this lecture. It was really helpful and educating.
CC: @sachin08

.jpeg)
.png)