Hi, my friends. I hope you are well and the COVID-19 condition is under control at your side. As we know, a significant effort is the new three levels Crypto Academy system. I write my work for a lecture by @kouba01 as part of the advanced level professor, an Ichimoku Kinko Hyo indicator. As Professor discussed the subject appropriately, I'm also trying my best to cover all the questions correctly.
Question No. 1:
What is the Ichimoku Kinko Hyo indicator? What are the different lines that make it up? (screenshots required)
What is the Ichimoku Kinko Hyo indicator?
It's a trading strategy that operates with every Period and every tool. This indicator offers companies a solid understanding of the various markets and helps them identify several business possibilities with a strong chance.
It's a form of graphing from Japan and a method of technical analysis. That's why the most acceptable Ichimoku strategy is a series of technical indicators used to evaluate the markets. This innovative method offers a different grade trading signal. A variety of graphical elements on a single chart is shown in the indication.
What are the different lines that make it up?
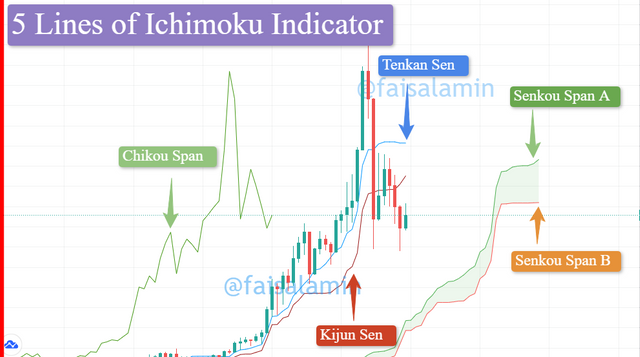
Only five lines make this indicator a bit difficult when the indicator is applied to the diagram. Let us now strive to know what is the purpose of each line on the default setting.
| Line No. | Japanese Name | English Name | Color |
|---|---|---|---|
| 1 | Tenkan Sen | Conversion Line | SKY BLUE |
| 2 | Kijun Sen | Baseline | DARK BROWN |
| 3 | Chikou Span | Lagging Span | DARK GREEN |
| 4 | Senkou Span A | Leading Span A | LIGHT GREEN |
| 5 | Senkou Span B | Leading Span B | ORANGE |
1: Tenkan Sen (Conversion Line)
It is often called the conversion lines but seems to be the highest and lowest low for the last 9-Periods. It is calculated by averaging the highest high price and lowest low price over the last nine periods. So, you add the highest price of the previous nine periods and the lowest price of the previous nine periods and divide this sum by 2.
2: Kijun Sen (Baseline)
It is the central point of the 26 last day divided by periods of trade. These 1,2 lines Tenkan Line and Baseline use fast and slow moveable averages in the same way. It the same as Tanken but use the last 26-Periods than 9-Periods. The Baseline generally tracks the equilibrium price over the last 26-Periods while the Tenkan Line tracks the equilibrium price over the previous 9-Periods. It naturally means that the Tenkan Line moves faster than Kijun, which is why we called the Kejun as the Baseline and Tenkan as the Conversion Line.
3: Chikou Span (Lagging Span)
Chikou Span, also known as Lagging span with GREEN colour, is plotted with this calculation (Closing prices calculated 26 times behind the asset's most recent closing price). It is intended to enable traders to visualize the connection between present and past trends and the possible variations of the movement. It is plotted by shifted the current price 26-Periods back. So this indicator is plotted by going back 26-Periods.
4: Senkou Span A (Leading Span A)
It is the centre point between Tenkan Line and Baseline but has been tracked by 26 days divided by periods before the current time of the Period.
Senkou Span A forms the first part of Kumo cloud. If prices are above this, then it acts as a support and when the prices are below the prices then it acts as the resistance. Link
5: Senkou Span B (Leading Span B)
It has a 52-period high to the 52-period low, middle point and is planned for 26 days divided by Period. Because it uses a long time period it can be used as support and resistance for the price trend.
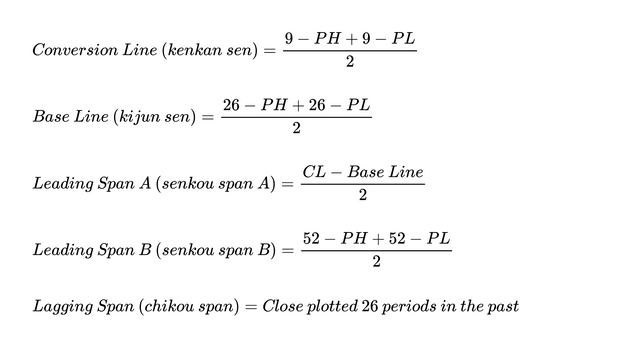
where:
PH = Period high
PL = Period low
CL = Conversion linesource
Question No. 2:
How to add the Ichimoku indicator to the chart? What are its default settings? And should it be changed or not? (screenshots required)
To add the Ichimoku indicator to the chart, I used tradingview.com for my homework. I used pair of ETH/USDT. To add this indicator to the chart, we need to click on the fx as shown in this screenshot.
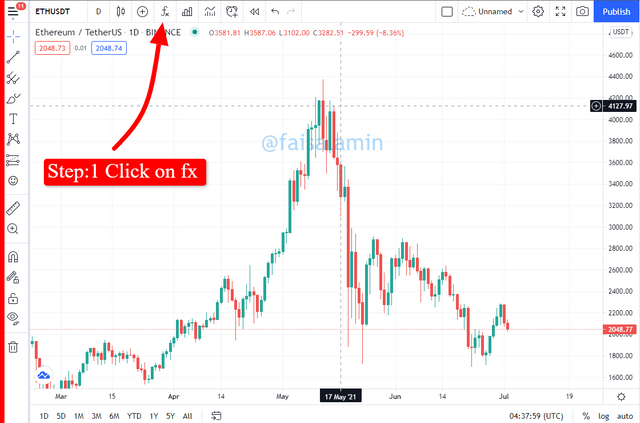
fx is used to add any strategy and indicator apply on the chart. You can also write and apply your script to the chart by using this button. We will use the Ichimoku indicator in this homework, so we search for it and click on it, as shown in this screenshot.
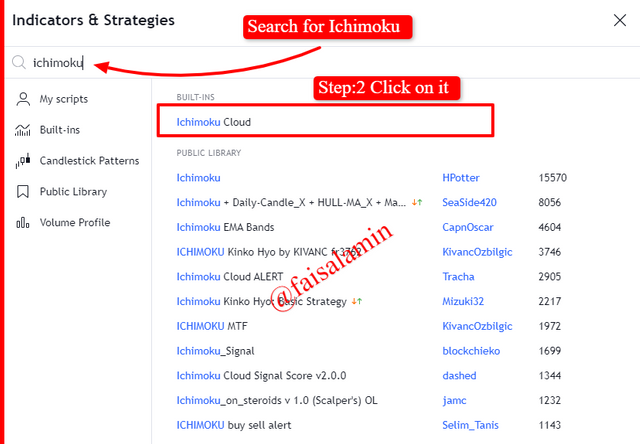
Now close the popup window, and you can see that the indicator is applied to change the setting to find the setting button on the indicator tray, as shown in this screenshot.
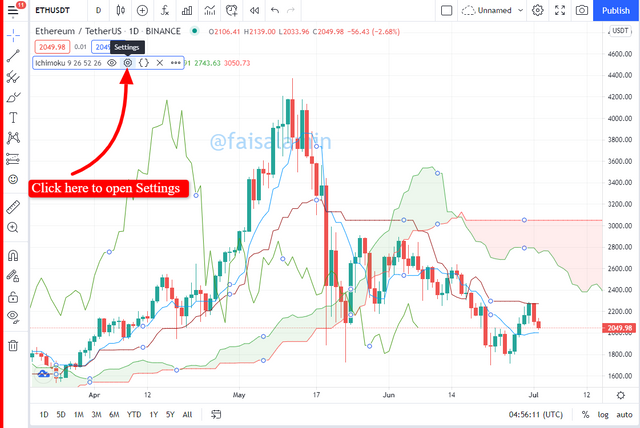
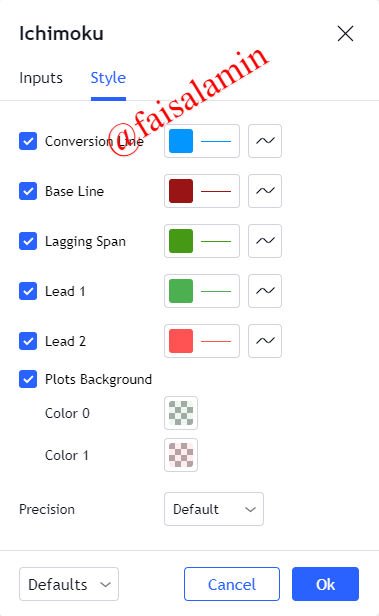
A default setting menu popup can see the default inputs and default style by clicking on the Settings button. You can always change it according to your strategy or requirement.
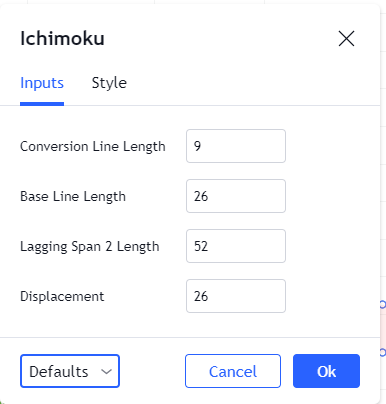
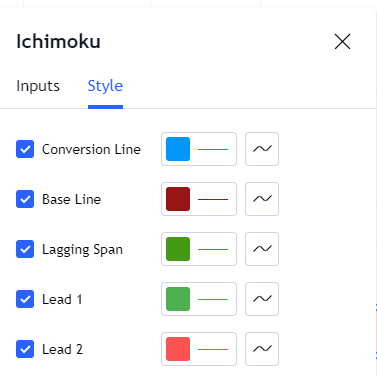
The default input settings are 9-26-52, and you can modify it for the five-day strategy to 8-22-44. There is no limitation to change the setting according to your plan. Many traders use settings for trend markets include 2-24-120 or 9-30-60. As Professor also have that
Among the most popular are the basic settings (10, 30, 60) or (20, 60, 120).
Question No. 3:
How to use the Tenkan Sen line? How to use the Kijun Sen line? And How to use them simultaneously? (screenshots required)
How to use the Tenkan Sen line?
Tenkan Sen Line (Conversion Line)
Tenkan line is also known as Conversion Line. It is calculated by averaging the highest high price and lowest low price over the last nine periods. So, you add the highest price of the previous nine periods and the lowest price of the previous nine periods and divide this sum by 2.
As per the Professor, provide the simple statement formula:
(Higher over 9 periods + Lower over 9 periods) / 2
We can understand the importance of the Tenkan Line with an example.
For example, if the price is going up, you will see that the Tenkan Line is also going up.
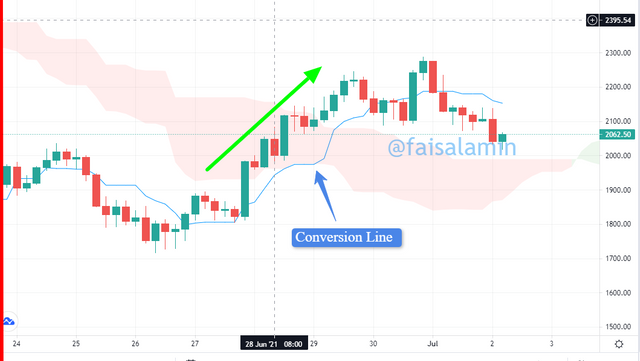
Now suppose if the price suddenly goes sideways. It would mean that the market would stop making new highs, and so in this scenario, the Tenkan Line may start going flat for a brief period. This Tenkan Line action when it goes flat could indicate that the market is entering a brief consolidation.
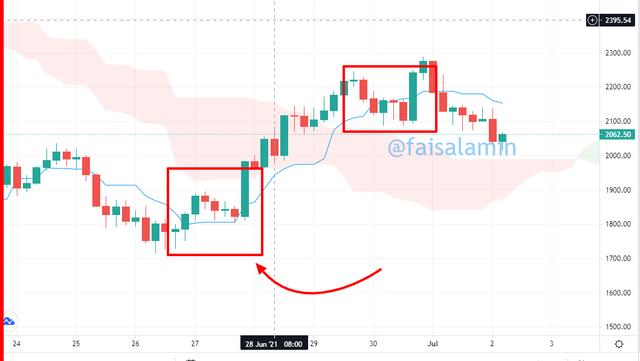
In such a scenario, either the prices may come down to touch this Tenkan Line or after 9-Periods what will happen is Tenkan Line starts moving up, and ultimately the prices would touch the Tenkan Line. So the Tenkan (Conversion Line) Line act as a magnet for the prices, and typically, you will find that the prices do not go very far away from the Tenkan Line for an extended period.
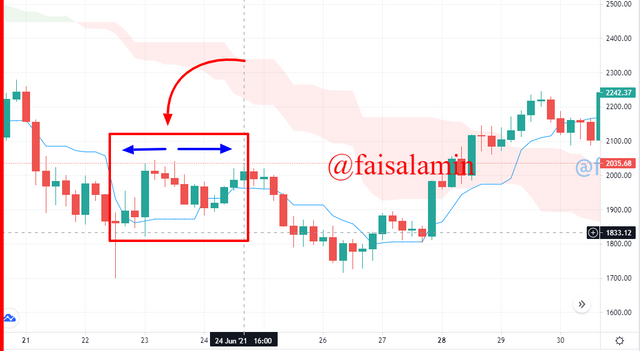
For example, we see that when prices jump and start moving sideways for 3-4 days, we see that the Tenkan Line goes flat. However, the prices do not fall on the Tenkan Line. Instead, what happened to the Tenkan Line started moving up.
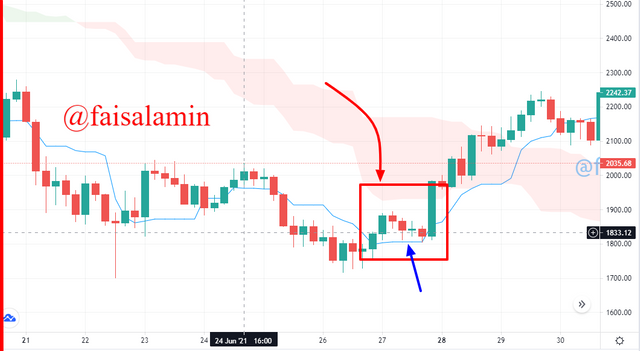
Now we see the prices consolidate, so the Tenkan Line again goes flat, but this time what happened that the prices fall to the Tenkan Line and then they take to support near this Tenkan Line, and then the prices head back up.
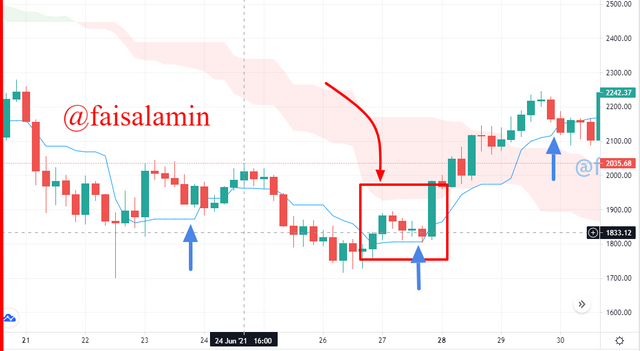
So, the Tenkan Line proves to be a strong support line multiple times on this chart, as shown in the screenshot. So, the Tenkan Line was the first component of our Ichimoku trading system. Usually, we do not use Tenkan Line alone for doing any trading. We have to combine it with other features of the Ichimoku indicator.
How to use the Kijun Sen line?
Kijun Sen (Baseline)
Kijun, also called Baseline, is the highest and lowest low of the last 26-Periods. Remember that in Tenkan Line, it's the average of highest high and lowest low of last 9-Periods. The only thing that changes with the Kijun is the number of periods so, we can imagine the Kijun as the slow-moving average while Tenkan as the fast-moving average.
The Baseline generally tracks the equilibrium price over the last 26-Periods while the Tenkan Line tracks the equilibrium price over the previous 9-Periods. It naturally means that the Tenkan Line moves faster than Kijun, which is why we called the Kejun as the Baseline and Tenkan as the Conversion Line.
Kijun Line can also go horizontal once the market stop is making new highs or lows and once the prices begin a consolidation. Now, let us understand what information Kejun Line provides us.
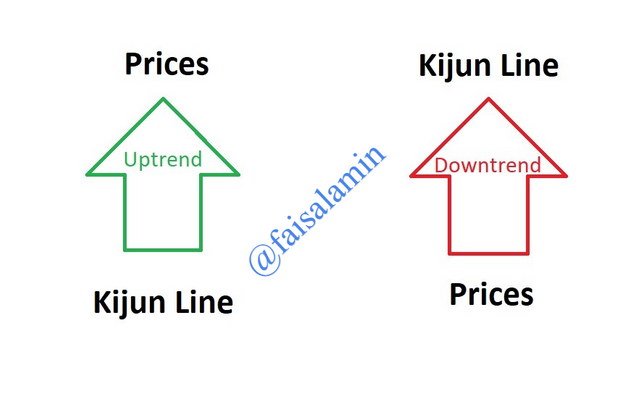
Typically, if you see that the prices are above the Kijun line, the trend is bullish. Similarly, if the price below the Kijun Line, then the trend is said to be bearish.
However, We should not use the Kijun Line alone to determine the trend, and we should not use it to determine if the trend will continue. We should combine it with other components of the Ichimoku indicator to make any trading decision. You may use Kijun Line with some other technical indicators to devise different trading strategies.
Kijun Line acts as solid support for prices in an uptrend, and it also acts as strong resistance to prices in a downtrend. As long as the prices do not close beyond the Kijun Line, we can assume that the support and the resistance near the Kijun Line are holding up. This nature of the Kijun Line, where it acts as strong support or resistance. It means that we can use Kijun Line for placing Stop-Loss in trading. Kijun Line also moves with the price. It means that if the price goes up, the Kijun Line will go upward, and if the price goes down, the Kijun Line will go downward.
How to use them simultaneously?
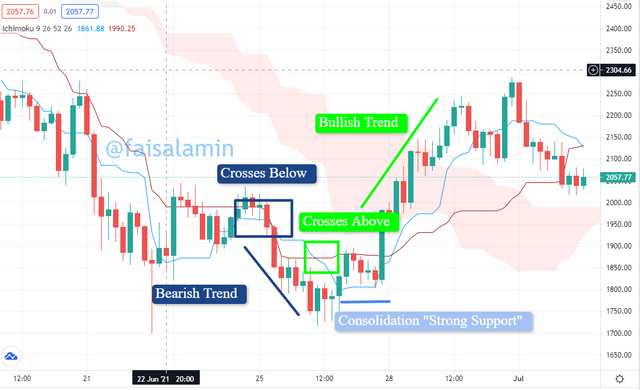
Traders use the Kijun Line and Tenkan Line to get better decisions for long-term and short-term strategies.
- They can go for the long-term if the Tenkan Line crosses above the Kijun line.
- Traders can go for the short-term if Tenkan Line crosses below the Kijun Line.
- Using the Tenkan and Kijun lines will indicate the future support and resistance levels.
Question No. 4:
4- What is the Chikou span line? And how to use it? And Why is it often neglected? (screenshots required)
What is the Chikou span line?
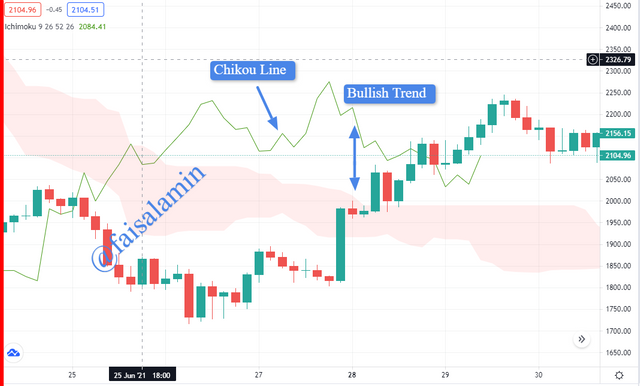
Chikou Span is also known as Lagging Span. It is plotted by shifted the current price 26-Periods back. So this indicator is plotted by going back 26-Periods. By comparing the Chikou Line with the price of 26-Periods ago, we can quickly find out the current trend.
how to use it?
- Chikou indicator can be used to indicate Uptrend and Downtrend.
- If the Chikou is above from 26-Periods ago, then the current trend is said to be Bullish/Uptrend.
- If the Chikou is below from price of 26-Periods ago, then the current trend is said to be Bearish/Downtrend.
The most important use of the Chikou span is in the form of a momentum indicator. When the Chikou Span is in an open space where it is unlikely to run into prices, then we can expect that the trend emerges it is not going to encounter any resistance. We can assume that the trend is likely to sustain when this happens because of a lack of resistance.
Let us go with an Example.
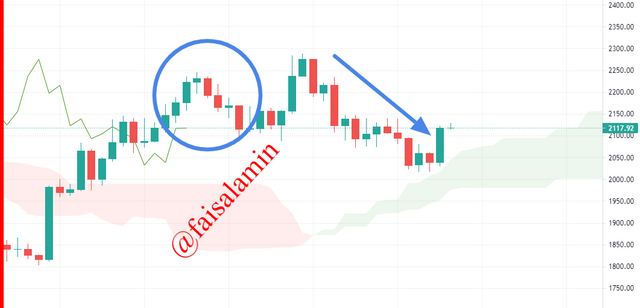
Here we can see that some downtrend is developing if the prices turn up from the end, the Chikou SPan will go up and face some resistance due to the candles shown in the circle. However, if the prices start going down in the next candle, then Chikou Span will also move down sharply, and it won't face any resistance to downfall as it would not run into any price candle below. So in this scenario, we can say that the Chikou is an open space if a downtrend emerges.
Why is it often neglected?
- When the Chikou Span line crosses the asset's price in both bullish and bearish trends simultaneously, it is often neglected because there are no evident signs of a trend.
- A false signal may be produced while crossover above or below the price of 26-Periods ago. The price and the span of Chikou are regularly crossed without a significant price move or trend change. Therefore, in conjunction with the other aspects of Ichimoku Cloud, the indication needs to be utilized.
- When the Chikou Line crosses above and below the price at the same period, with no clear sign of a trend, it's usually ignored.
- As when Using the Tenkan and Kijun lines together will indicate the future support and resistance levels. As a result, Chikou is usually ignored.
- It is based on previous data as we learn about the previous 9-Periods and 26-Periods calculation, however, two of the data points are predicted into the future.
Question No. 5:
What's the best time frame to use Ichimoku? And what is the best indicator to use with it? (screenshots required)
What's the best time frame to use Ichimoku?
The Ichimoku indicator, in general, can be used in any time frame. The indication is automatically calculated based on the system you're applying, and it changes every time you alter the time frame. As a result, it all depends on the type of trader you are. If you're a day trader then you can apply Ichimoku on a shorter time frame, starting with a 1-minute chart and keeping your head up to six hours. Long term traders can go for daily to weekly time frames.
To obtain a clearer idea of market trends, it often helps to zoom in and out of time frames. When analysing the markets, keep in mind that you should never depend on just one signal.
What is the best indicator to use with it?
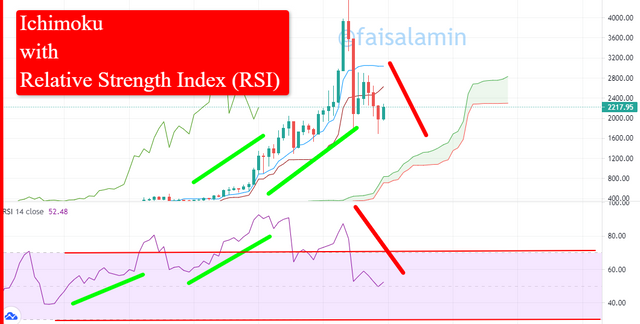
Ichimoku indicator can use independently as it provides a detailed trend analysis but for better and safe decisions traders preferred to use Ichimoku combined with the Relative strength index (RSI).
The Relative strength index (RSI) is the ideal indicator, and it properly matches the Ichimoku. When tracking trends with the Ichimoku indicator, it's critical to know when the trend is gone and when a possible reversal signals a trade exit.
Conclusion
As we cover the three components of Ichimoku which are Tenkan, Kijun and Chikou Span Line we conclude that:
- The first thing that we covered is that the Ichimoku Indicator consists of five components which are the 5-Lines that we have discussed in detail in questions 1,2. Each of them is providing information on price movements.
- Chikou indicator can be used to indicate Uptrend and Downtrend.
- If the Chikou is above from 26-Periods ago, then the current trend is said to be Bullish/Uptrend.
- If the Chikou is below from price of 26-Periods ago, then the current trend is said to be Bearish/Downtrend.
- If the prices are above the Kijun line, the trend is bullish. Similarly, if the price below the Kijun Line, then the trend is said to be bearish.
- When the Chikou Line crosses above and below the price at the same period, with no clear sign of a trend, it's usually ignored.
- For better and safe decisions traders preferred to use Ichimoku combined with the Relative strength index (RSI).
▀▄▀▄▀▄ T̳̿͟͞h̳̿͟͞a̳̿͟͞n̳̿͟͞k̳̿͟͞s̳̿͟͞ ̳̿͟͞f̳̿͟͞o̳̿͟͞r̳̿͟͞ ̳̿͟͞R̳̿͟͞e̳̿͟͞a̳̿͟͞d̳̿͟͞i̳̿͟͞n̳̿͟͞g̳̿͟͞ ▄▀▄▀▄▀
🅱🅴🆂🆃 🆁🅴🅶🅰🆁🅳🆂
Dear @faisalamin
Thank you for participating in Steemit Crypto Academy Season 03 and making efforts to complete the homework task. You got 8.5/10 Grade Points according to the following Scale;
Key Notes:
We appreciate your efforts in Crypto Academy and look forward to your next homework tasks.
Regards
@cryptokraze
Downvoting a post can decrease pending rewards and make it less visible. Common reasons:
Submit
Thanks brother for your valuable feedback. I will implement the suggestions in next work.
Downvoting a post can decrease pending rewards and make it less visible. Common reasons:
Submit