You can use many technical indicators, and if you ask different traders, you will notice that everyone has their own favorite list of indicators they use. More advanced traders even create their own indicators.
In the previous blog post, we have introduced you to candlesticks patterns. If you haven’t read it yet, we suggest you do it now. This article will focus on five technical indicators that we believe will help you become a better trader.
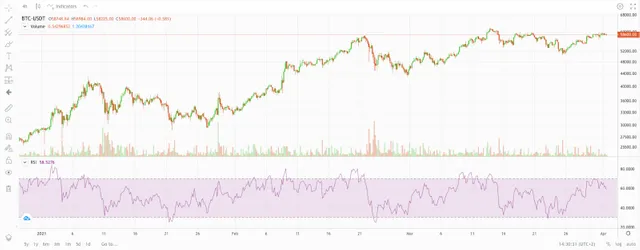
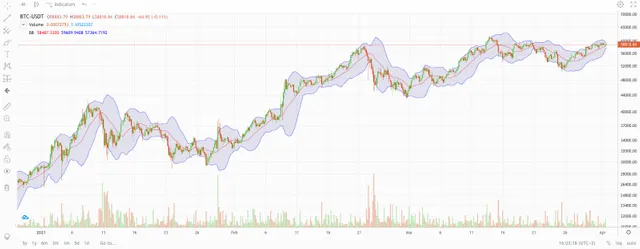
- All pictures are from NiceHash Exchange (BTC - USDT pair). The time period is between January 2021 and April 2021.
- Relative Strength Index (RSI)
J. Welles Wilder developed this indicator. The Relative Strength Index (RSI) is a momentum oscillator that measures the speed and change of price movements.The RSI uses a formula to determine if an asset is overbought or oversold. The formula returns a value that fluctuates between 0 - 100 and can be presented using an oscillator.
Formula: RSI = 100 – [100 / ( 1 + (Average of Upward Price Change / Average of Downward Price Change )
The RSI calculation is usually based on 14 periods, which is also the default suggested by Welles Wilder.

- Bollinger Bands (BB)
John Bollinger developed this indicator. Bollinger bands indicate whether the market has high or low volatility and overbought and oversold conditions.This indicator consists of an upper band, a middle band, and a lower band. The middle band is a simple moving average that is usually set at 20 periods.
Middle line: 20-day simple moving average (SMA)
Upper band: 20-day SMA + (20-day standard deviation x2)
Lower band: 20-day SMA – (20-day standard deviation x2)
The two outer bands expand (move away from the middle line) when volatility is high. When the bands are squeezed (move closer to the middle line), the volatility is low.
