Designed in Canva
It's great that I had the opportunity to take part in a lesson on "Mastering Steem Market Volatility Using Bollinger Bands" organized by Steemit Crypto Academy, this has frankly broadened my horizons about crypto trading and how to do it well by familiarizing me with a tool called Bollinger Bands.
Explain the Components of Bollinger Bands
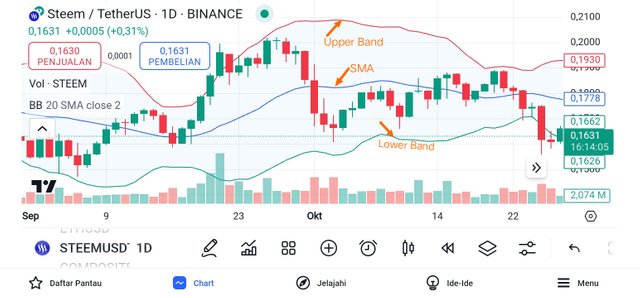
When it comes to crypto trading analysis the Bollinger Bands indicator plays a role. It consists of three lines that indicate the price conditions of the asset, under scrutiny.
These components include:
- The center line represents the 20 day Simple Moving Average (𝑆𝑀𝐴). The SMA refers to the average value movement over the past 20 days.
- The line, above the Simple Moving Average (Upper Band) showing a deviation, from the value. The upper band is calculated as the sum of the 20 day moving average and twice the standard deviation.
- The line positioned beneath the Simple Moving Average also known as the Lower Band represents the level of deviation. The lower band is calculated by subtracting twice the deviation, from the 20 day moving average.
Analyzing Market Conditions with Bollinger Bands
Utilizing Bollinger Bands can be advantageous, for traders, in the Steem market as it merges moving averages with price volatility measurements to offer guidance on price shifts and market conditions like overbuying or overselling.
When the price hovers, around the levels and Steem seems overextended it could signal a need for a price adjustment ahead.When the price reaches the levels. Steem appears undervalued it could suggest a possibility of an upward movement, in the future.
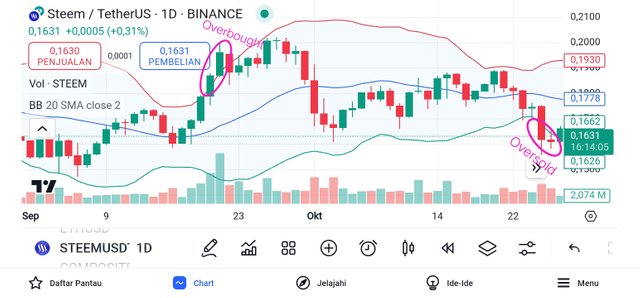
This can determine the market strategy for traders, whether to make short-term or long-term investments, with traders going long when the price hits the lower boundary and short when it hits the upper boundary. However, when Steem is moving in a strong trend, this signal may not work as well. Trending prices may continue to “walk” along the upper or lower boundary for a long time (neutral)
Identifying Volatility Patterns with Bollinger Bands
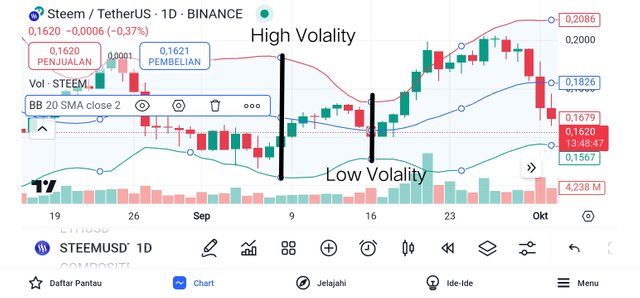
When mentioning the Bollinger Bands, it will help to be a navigator that guides traders to determine the direction, by showing the radar in the form of volatility. The way to play volatility is to look at the distance between the Upper Band and the Lower Band, if the distance is far then it is a sign of high volatility and likewise when volatility is low, it can be seen from the distance between the Upper Band and the Lower Band which becomes closer.
Based on the graphical data presented, when the price moves up near the upper band or even breaks through the upper band, a trader uses the indicator as a signal to sell, and vice versa, when the price moves down near the lower band or even breaks through the lower band, it becomes a sign to buy. So, Volatility can be seen as a statistical measure that describes price fluctuations, high volatility signifies greater risk, but also higher profit opportunities.
Identify Volatility
I exemplified how there are two lines on the Bollinger Bands, the first line is longer, which is a sign of high volatility, and the second line is shorter, which indicates that there was low volatility on Steem in that period.
Developing a Trading Strategy with Bollinger Bands
In terms of trading, it allows traders to study and anticipate potential price reversals or continuations by observing how prices interact with the picture presented by the chart. This helps traders to plan potential trade entries and exits.
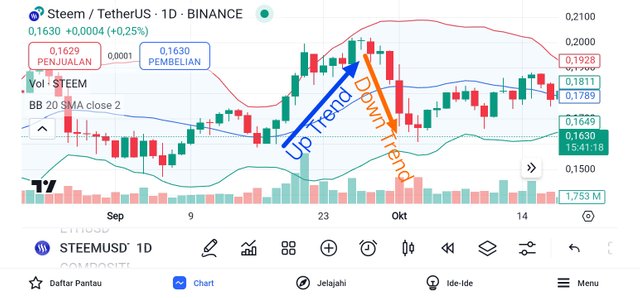
Buy and Sell Signals
I can illustrate where an upward arrow approaching the Upper Band line means an uptrend, which should be taken as a condition to prepare to sell, and where as I illustrate a downward arrow approaching the Lower Band, which signifies a downtrend which is a potential signal to consider buying.
Predicting Price Movements with Bollinger Bands
Support refers to the price level where demand is strong enough to prevent the Steem price from falling further, while Resistance refers to the price level where there is sufficient Steem supply to stop or reverse the uptrend. Support and resistance are core technical analysis concepts that are widely used by traders to understand market trends and potential reversals. Support and resistance are used to identify key price levels where the prevailing trend may find buying or selling pressure.
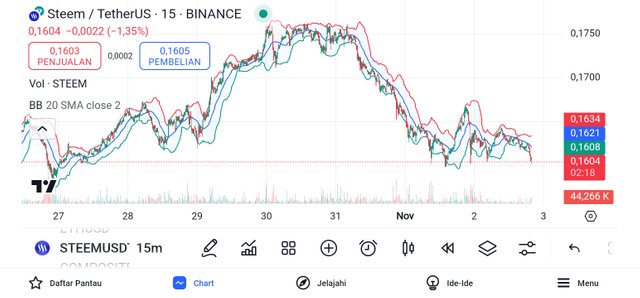
Price Limitations
Steem's current price condition on the 15m chart is crossing the Lower Band line (0.1608), which can be considered a price boundary support level. I think times like this are a good opportunity for you to decide to make a purchase, because when the moment a candle touches the Lower Band line, there will be a great bounce.
