Hello Traders 😀
I would like say thanks to everyone who takes their time to make this course series. Ans i specially thanks to crypto professor @shemul21 for giving us this homework tasks.

Question No 1 : What is Moving Average ?
In this, there are many technical indicators or strategies that are used to generate great analysis for making profit. The moving average is also one of the most technical indicators that is mostly used by lots of traders for trading. It is help to traders for understand the crypto market. In crypto market or trading, the price is continues it's movement according to the direction of different trends in market. Moving average is very important indicator because it plays very major role to identify the movement of price. In crypro market or trading, the technical analysis is very important because it is helps traders to understand the price direction according to trends. And as you know, now traders get a big range of technical indicators and the moving average can be considered as of the big and important ones.
Now in this, understanding about the actions of trders is very important. The Moving average is provides us the price of old and recent candles. Moving average is used to identify some other useful information such as for help in higihlight trends, like spot trends, reversals trends and provide trade signals are very important. It is helps us to understand the trends without any information. Because it's make less confusing.
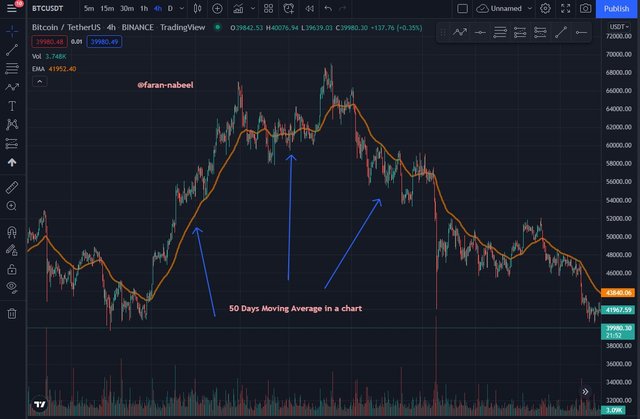
Let's see in the upper picture in this, look at the my technical analysis aspects of this. For example, if any assets price is above then 50 days moving average then that is show the buyers are more active then any sellers in the crypto market. In this condition, if we want to trade in tbia crypto assets then you can consider its as a buying opportunity and then we can enter in a long position. In tbis candlestick chart, you can see the moving average is represented with the price as the form of a dynamic line (price line) that's change position over time. So, now we understand about the moving average. This is very useful and important indicator.

Question No 2 : What are the different Types of Moving Averages?
Moving Average are calculates the average price of a recent numbers of candles according to the calculation (Formulas) methods, there are most useful moving average types that are traders are used to generate profits..
First One,
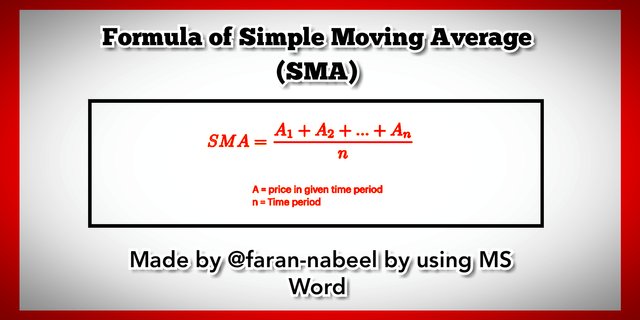
Simple moving average is used to calculate the average price of an asset for a set of data. The simple of moving average takes all prices into consideration equally without addition of any weight to it, enabling investors shifts its position whenever a new candle is showing. Let's see the formula of simple moving average in the below picture.
2ud is,
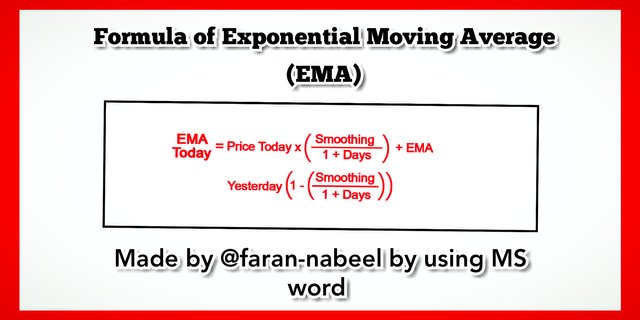
In this, Exponential moving average is used as more advanced calculations to give more weight to the most recent or closely price changes. As a result, the EMA give a more accurate price predication in the price reversals and suddenly price fluctuations than the the simple moving average because it uses only a set of data without any weight to it. exponential moving average are ideal for every traders who trade in the short term. The simple moving average and exponential moving average is combined are used to find both short-term and long-term price directions at the same time. Now let's see in the below picture the formula of exponential moving average.
3rd is,
In this, The weighted moving average is statistical measure that is gives greater weight to the most recent prices and less weight to the previous prices. The weighted moving average is multiplies the price of each bar by the weighted factors in order to account more weight on the most recent data. In which the sum of the weights will be equal one, or hundred percent. The weighted moving average ia algorithm is supposed to be more descriptive than the simple moving average algorithms. You can also see in the below picture this is the formula of weighted moving average.
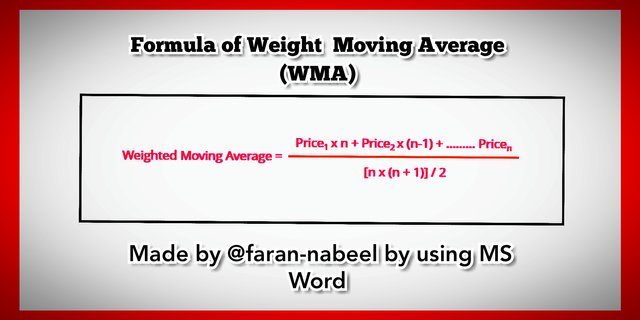
Difference between SMA, EMA, & WMA are shown below
I am discussing about the difference between SMA, EMA & WMA in the below table.
| Simple Moving Average (SMA) | Exponential Moving Average (EMA) | Weight Moving Average (WMA) |
|---|---|---|
| In which SMA the average price of a period poltted continuously | In which EMA is calculates using today's value. | The WMA is used the most recent price. |
| This is used for the average value over a period of time. | In which the new data is given priority by this | This is tbe shows the importance of reducing recent data. |
| In which a higher duration is more reliable. | In which this is lower duration is more reliable. | In which both are higher and lower duration are reliable. |
| SMA is really good for detecting long-term trends. | EMA is really good for short-term price reversals and trading. | WMa is really good when recent data is more valuable. |

Question No 3 : Identify Entry and Exit Points Using Moving Average.
Here in the below i will use as an example an exponential moving average is (20) , on the ADA / USDT pair in a 5 minutes time period chart. We are in search of places where price breaks the EMA line, those breakout places represented entry and exit zones depending on the occur and the context where they occur. In the simple the moving average is represent the average value of the price in the last periods, so a highlight feature 9f moving average is they functions as dynamic supports and resistance, and but when there is a break of supports and resistance are represent and very important trade level.
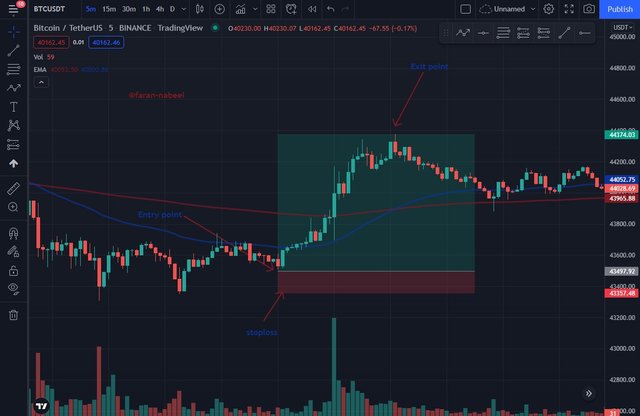
We must see the market in the downtrend. Second, the price of the market break the EMA line and may be boom. The following candles are expected to move away from the EMA in a bullish trend. We can see the bearish trend converted into bullish trend. There is a good chance to take long entry.
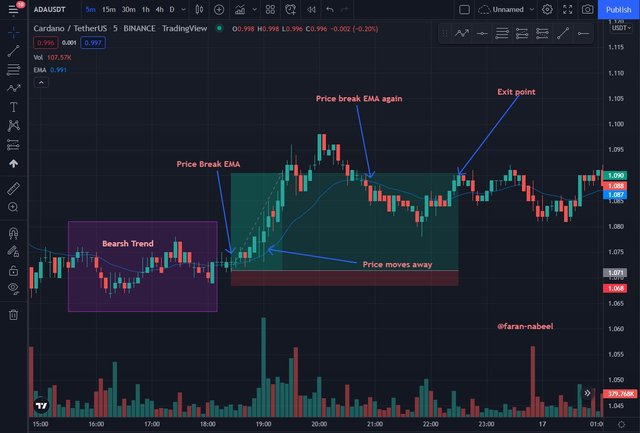
Now the exit will be occur when the price ia breaks the exponential moving average again, ans this time in the opposite direction, we from the top of the bottom. Then we must wait for the followings candlestick to move away from the EMA in bearish directions.
In this method, we must be in an up trend. Next, when the price is expected to break the EMA line from above downwards, and the following candles are expected to move away from the EMA in bearish directions. This represents a trend is change from bearish. And therefore, a good point for a short entry.
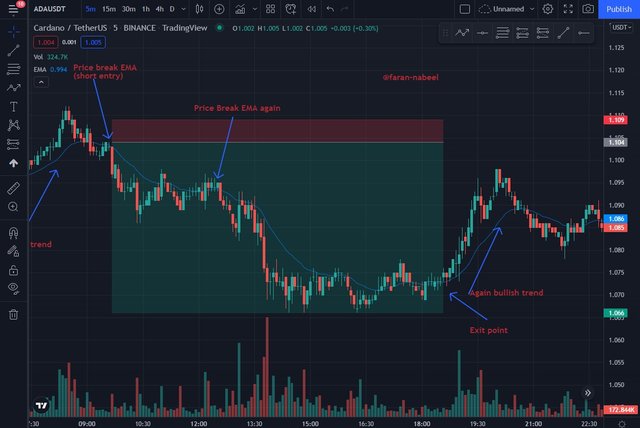
Now the exit will be occur when the price again breaks the EMA this time in a down up direction. And now we should wait for this candlestick to move away from the EMA in a bullish direction. This ia the exit points of our trade.

Question No 4 : What is Crossover?
In thia answer, the moving average crossover is different from standard moving average. It is uses two moving averages instead of a one moving average. For example, let's combine a 50 day exponential moving average with a 100 day exponential moving average. The shorter 50 days moving average is also referred to faster moving average because it moves more fast.
The slower 100 day of moving average is the longer moving average only needs a smaller amount of data points for draw a chart. And the the longer one is neefs more data.
Now in the below i am also showing a chart that how to show the tow moving averages line up when they are located into a daily candlestick.
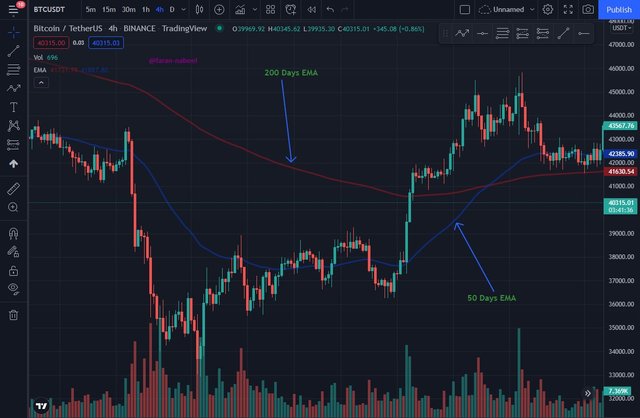
Now we can also see the blue line is 50 day EMA line is closer to the current market price then the red 200 days EMA line. The traders normally use the crossover system for in order to smooth out the entry and the exit points. By doing this we win the rate of our trades gise high.
The Rules for the Entering and Exiting in the Crossover System
Now in the below these are some basics rules for the entering and exiting in to the crossover system.
When the short term is moving average exceed the long term moving average we can easily enter into a new long position.
When the short term moving average become less than the long term moving average, we are exit the long position and take profit easily.
Now i will use a BTC/USDT price chart with 50 EMA and 200 EMA as the moving average.
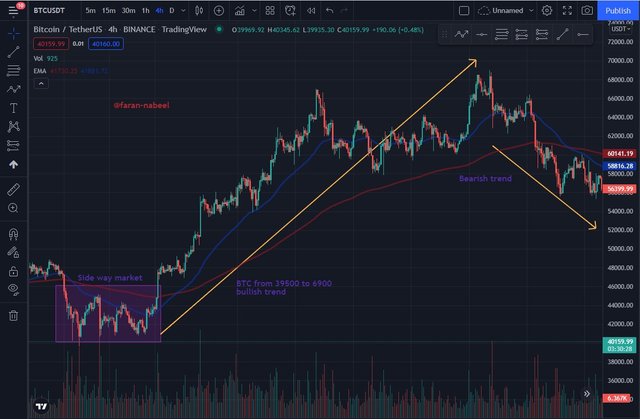
Now in the below you can see most popular swing trading combinations in order to create and moving average crossover system for sideways market are listed below.
9 day EMA Combine with 21 days EMA is give us short term trade and up to few trading sessions.
25 days EMA is combine with 59 days EMA is give us midterm trade and up to in few weeks.
50 daysEMA is combine with 100 days EMA is give us lonf term trades and up in few months.
4 100 days EMA is combime with 200 days EMA is give us long term trades and over in a year or more.
Longer time period of chart, the number of trading signals becomes lower. In order to identify daily trading opportunities. And we can use the 15 to 30 minutes crossover. A 5 to 10 minutes crossover is good for aggressive trader.
The illustration of a buy & sell signals for an one day trader in a 5 minutes chart of ADA/USDT chart are shown below.

Question No 5 : What is the limitations of Moving Average?
For in this answer, it is the understandable how tp beneficial moving average is to trades. No indicator is 100 % perfect.
The moving average is also same. The limitations of moving average are written in the below. I hope you can understand.
In which the some situations of moving average is dose not respond to a little crypto market fluctuations or arbitrary moment of price.
And at the some sudden moves from price movement and little price is retracement, the moving average indicator can give false signals.
Now it is eady to understand as it is eliminates noise in a price movement, but it also eliminated some sensitive price signals.
The moving average is only works bests in trending crypri markets , in a case of ranging phase the indicator are show false signals.
The moving average is very sensitive and with the period length and in case trader choose a period with the wrong time period of chart. When the indicators give a false signals.
In this the conclusion of our homework task we can say a Moving average is a very common indicator and it is can also use as a standalone indicator as well. The combination of multiple indicators are called moving average. Moving average is in trend following system. Moving average is work best.
When we apply it's correctly then they provide a quick insight into the direction, abd tge rate of of trend are change. Moving average have crossover tastics , on the other and completely available for people who prefer to trade price reversals.
And now at the end of my post i would like say thanks to Prof @shemul21 for making this wonderful and useful homework tasks for members. And i also got a lot of new things about crypto trading through his lecture.
Thank you so much for reading and visiting on my post.

Publisher : Faran Nabeel
Discord : farannabeel#8111

Cc,
@shemul21 sir please check my club5050 eligibility.
And guide me i am eligible or not ?
Downvoting a post can decrease pending rewards and make it less visible. Common reasons:
Submit