I hope our all members of steemit will be fine and happy. I am also fine and happy and enjoying my healthy life. This is very honor for me to be a part of steemit and this fantastic program here in this wonderful community is steemit crypto academy. And now we are entered in the the third week of season 6. This week our most respected prof @pelon53 is make a very significant lecture for our crypto traders. His lecture is talk about Support and Resistance Breakout. On this post i attempted all question with my answers. So, let's go to our topic.
.jpg)

01. - Explain in detail the advantages of locating point support and resistance on a chart before trading?
Here l, These are some important advantages of locating support and resistance on a chart before our trading can be never be overemphasized l, here is because this points are significant points thats the trader use of in other for make his profit from any trade.
Points of support and resistance break Out are usually the points of trend reversal. Here ,Now let's try to understand about support and resistance levels clearly before we proceed.
Here, if the price of an assert is moving in an the upward direction, then it will get to a point where the upward movement will be stop i.e the buyer will be start losing her interest in the asset, that the points where the assets stop moving upward so it is called the Resistance level. Once that are happen the trend will be revers and start moving in downward.
Here, if the price of an asset is moving on a downward direction, the it will be get to the point that then the downward movement will be stop. at this point where the movement in downward will be stop is called Support level. And the once that are happens the trend will reverse and the upward movement will be start.
And the points of resistance is where in a form of bullish movement of an asset are ends then a reversal to the bearish movements begins. And in the same way , the points of support is a point same point where bearish movements of an asset are ends then a reversal form the bullish movement is start.
Here the another importance of identifying of support and resistance on a chart before trading is where this point that are serve as over entry and exit points. And for buyer, he/she enters the market at the support zone or level and then he/she exit the market at resistance level. For the same way, for seller, his trade entry is usually done in the resistance level and then he exit of the trade done at the support level or zone.
Where a trder is used this concept or idea, for the chance of making profit because very high and also for the probability of losing becomes low.
Here now also more, another importance of the support and resistance before trading is that it is helpful for traders to know about the momentum or the strength of the crypto market. And the strength of the market is tell us to traders about of the trends os going to breakdown are not. The knowledge of support and resistance is very important because the knowledge of support and resistance will be enable traders to accumulate asset at the same and right time.

02. - Explain in your own words the breakout of support and resistance, show screenshot for the breakout of a resistance, use another indicator as a filter?
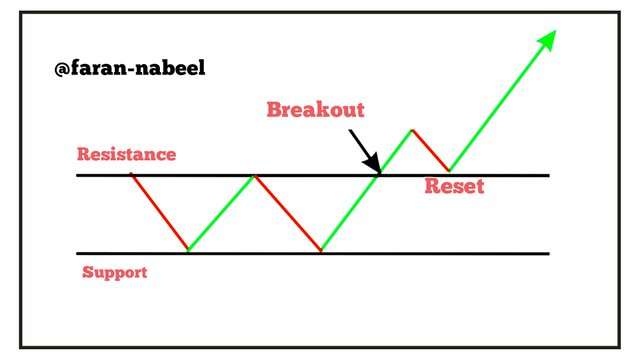
Here let's start my answers of second question for my prof , the breakout in support and resistance refers to the continually movement of the market trend are going to upward or downward direction. And in the case of the breakdown of resistance, it is simply refers to the continuous movement of market price in an upward direction above the initial zone of resistance. Where ever the price is moved above the previous point of resistance, then we say that a breakout in resistance has taken place.
First of all , the breakdown of resistance can occur and then the price will be reset and back to the initial resistance level and at this point the initial resistance level will be serve as a support level and the after hitting that point, the trend then moves upward in the direction of the initial Breakout. You can also see in the below picture this is the good example.
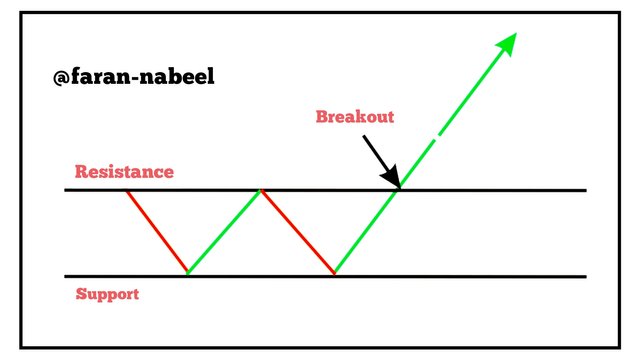
An the other breakdown of resistance is the one that does not reset to to the initial resistance point and the trend moves upward continuously after breaking of resistance. You can also see in the below picture this is a good example of this.
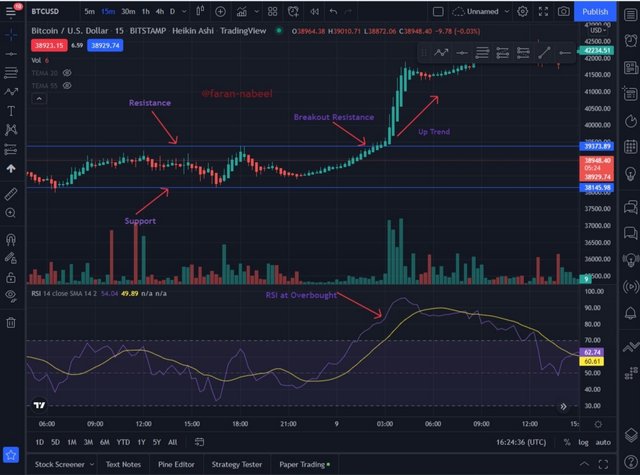
Another to confirm the breakout of resistance, i have applied the RSI indicator on my my chart. And the resistance breakout, we can see the asset is seen above the upper upper level. By using the RSI indicator, from threshold of 70 and above is an a over bought region and we have see in the chart below where the the breakout of resistance took us on the region. And the indicator is clearly see on this below screenshot.

03. - Show and explain support breakout, by use additional indicator as filter? show screenshots.
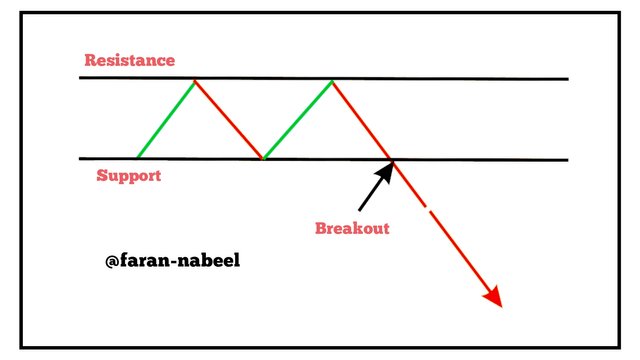
In this case the support breakout, it is simply refers to the continually movement of price in the downward direction and below the initial points of support where the price are moves below the previous support point, then we say that a breakout in support has take place. Now we are also discuss about the tow ways when the support breakout take place.
First of all, the support breakout is the one that does not be reset to the initial support points instead the moves of market trend on downward to continuously after breaking of support. You can also see in the below picture this ia a good example for this.
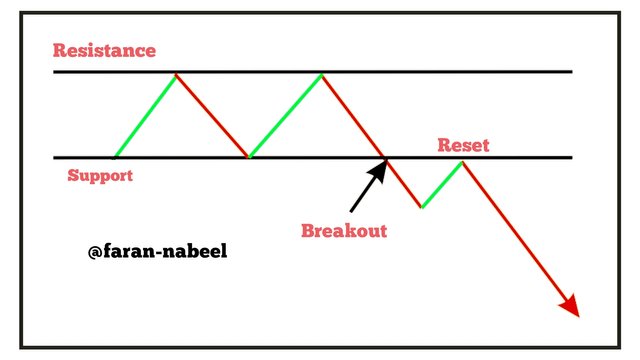
The support breakout is the one that is dose not reset to the initial support points instead the market trends moved to downward direction after the breaking of the support. You can also see in the below picture this ia a good example of this.
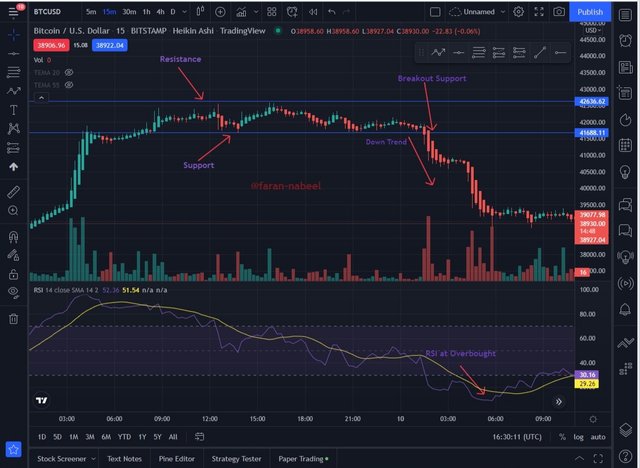
Hers in which i also use the Rsi indicator to my chart. Here you see in the resistance breakout, we can see the assets is showing over bought as the RsI indicator, form threshold 30 above is an the over bought region and in which we have seen in the chart below where the resistance breakout is took us the place. The indicator are clearly see in the below screenshot.

04. - Explain what a false breakout is and how to avoid trading at that time? Show Screenshots.
Here we are answer my question no 4 is about false breakout. And the false breakout as the name implies of FALSE and a simple meaning a breakout that it is not genuine i.e a breakout that is not real or correct. Because sometimes we see the false breakout at the resistance level. Where ever this breakout surface are not continue. It's movement in the movement of direction it broke instead it moves up q little in this case of false breakout in the support level and then it is revers. The false breakout is normally cause by whales in the market, they will provide a lot liquidity and sometime they will notice traders coming into the market, then they will then withdraw their assets leading the small traders who have been received by the breakout to a very big loss for his.
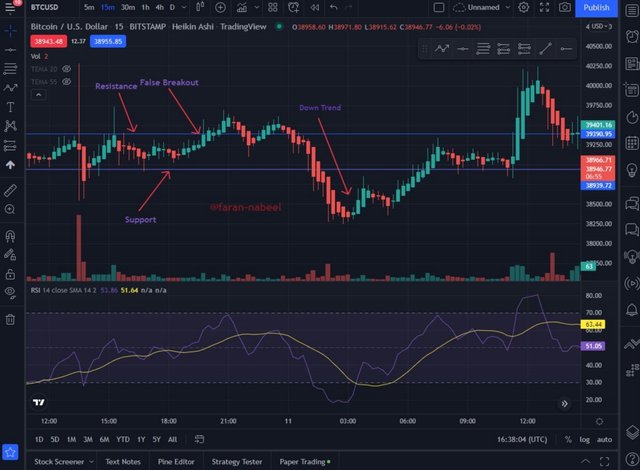
In the upper screenshot we see a false breakout at the resistance level. Form the chart to above , the points of resistance has been marked and price will be broke to point and moved in upward direction but did not carful and wait for the clarification of the breakout will enter the breakout at this point and they will cause a lot of loss to them as they are predicting that they market price will be suppose to move upward direction but it is risky.
For to avoid trading at the time of false breakout, all we need to do the for to wait for clear breakout before entering in trade. In the addition to waiting for the breakout to be very clear, trades need to make us to use of two or more indicators in our trade to filter out this false signals. This is the criteria are taken into consideration, then we will be able to avoid from entering trade at the time of false breakout.

05. - On a demo account, execute a tade when there is a resistance breakout, do your analysis? Screenshots are required.
For this question i decide to use Heikn Ashii chart for the traditional candlestick chart. Here the pair of BTCUSDT was traded as you can also see in the below. I see and observe careful and notice the previous resistance level to broken then i wait for the trend to be see in clear enough to avoid false signals. In this case i used i used the RSI indicator fro confirm the direction of the trend and form the chart you can also see in the below the RsI indicator is also move in upward direction. A buy entry is made and stop less and a take profit level was also taken. Here risk reward ratio of 1:2 is taken for the trade. you can also see in the below screenshot the analysis of the demo trade.
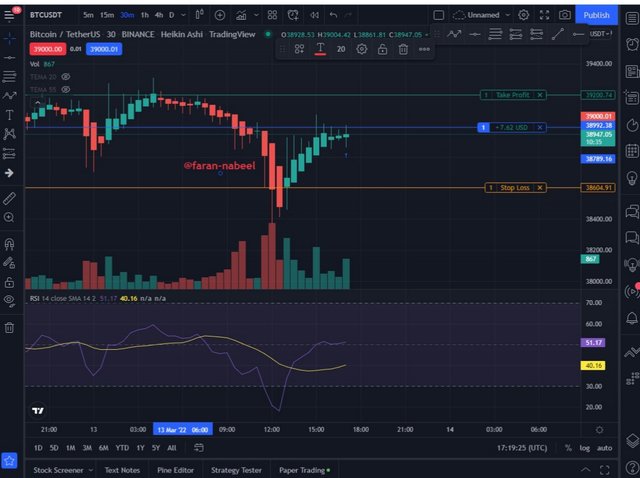
The trade was a executed using tardingview demo account. As i have a predicated, the price is continued moving in an upward direction and the RSI indicator is also confirmed the upward direction as well. Now you can also see in the below screenshot the result of my trade.


06. - In a demo account, execute a trade when there is a support break, do your analysis? Screenshots are required.
For the answer of this question i also decided to used Heikn Ashii chart of the traditional candlestick chart. And the pair of WAVEUSTd was using for trade and you can also see in the below screenshot was take from tradingview website. In which i also observe careful and notice the previous support level are broken then i again waiting for the trend to be see clear enough to avoid from false signals. In this case e i used the RSI indicator for the confirmation of direction of trend and from the chart you can also see in the chart the RSI is also moving to the downward direction. Hera in which also the seel entry was made a stopless and also take a profit level. A risk reward ratio of 1:2 is taken from this trade.
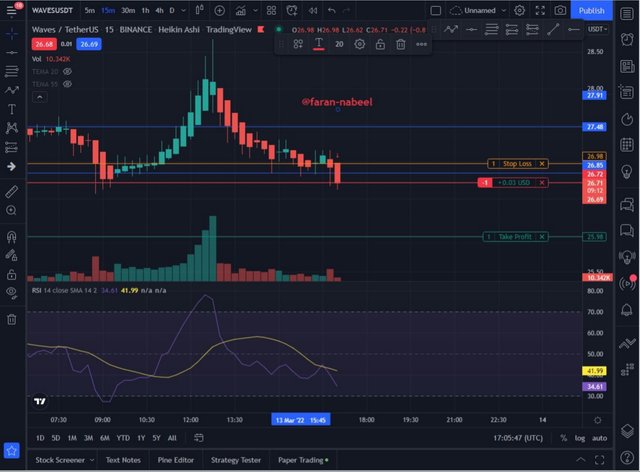
Here in the trade was executed by using my tardingview demo account. As i have also predicated. And the price is continued moving into downward direction. And the RSI indicator is also confirmed the downward direction. You can also see in the below picture this is the result of my trade.


Conclusion 😀
For this post i got a lot of new things about crypto and for any trader to become successful on crypto market the Knowledge of support and resistance out is very important. Support and resistance is main key of crypto analysis. In which we are discuss about the some advantages of support and Resistance and also discuss about the false breakout. The knowledge of support and resistance is very important for every traders for to minimize loss and make maximum profit.
And now finally my today's task is complete and i am very thankful to our beloved prof @pelon53 for spending his time to make a good lecture for us. It is really informative and full of a valuable knowledge for everyone. I hope in the future i got more new things from your lecture.
Saludos @faran-nabeel, pero tu publicación llegó muy tarde.
This task will run until 23:59 on March 12, 2022, UTC. (19:59 Venezuela time)
Espero ver tu publicación esta semana.
CALIFICACIÓN: 0,0
Downvoting a post can decrease pending rewards and make it less visible. Common reasons:
Submit