Bonjour everyone,
Welcome once again to another week of exciting assignment posts. Today, we shall talk about the amazing Williams Percent Range Indicator. Professor @kouba01 had already detailed us on almost all there is to know about this interesting indicator and how to make the best use of it in our market charts as crypto traders. Without much further talks, let's get straight to the task given us.
Q1. Explain The Williams %R Indicator By Introducing How It Is Calculated, How It Works? And What Is The Best Setting? With Justification For Your Choice:
The Williams %R Indicator (WPR) is one of the most used indicators in the cryptocurrency ecosystem market by traders for effective trading strategies. This average momentum indicator was designed and implemented in 1973 by Larry Williams, hence it's name. Sir Larry Williams is also known to be a good author for his writing skills. He has also developed other types of trend indicators, but he's well known for his works on WPR. It is expressed in percentages with values ranging between 0 and -100%. Thus qualifies it to be referred to as an oscillator. It provides traders with powerful options to profit from trades with a bit of ease as compared to some other indicators.
One of the most prominent advantages of this indicators is the ability to be able to identify overbought and oversold patterns very conveniently on a price chart. By doing so, we can also easily figure out very good entry and exit points.
Overbought portions on a chart lies between the ranges of 0 to the -20% mark whereas the oversold portion lies between the ranges of -80% to the -100% mark.
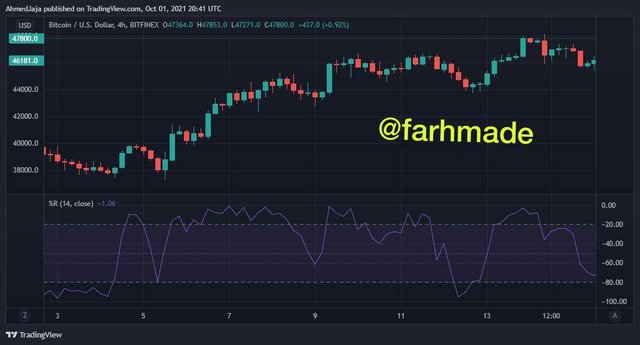
From the image of the BTC/USD chart screenshot above, we can see clearly how the Williams Percent Range Indicator appears. We can also spot the portions of the chart above and below the -20% ad -80% marks, explaining what we mentioned earlier.
Calculations Of The WPR:
Mr Williams developed the WPR indicator based on certain mathematical calculations. The %R is calculated based on the number of periods of trade in the market by using the following expression:
%R = (HP - CP) / (HP - LP)
where;
HP = Highest asset price in the previous"n" periods of trade
CP = Closing asset price in the last n periods of trade
LP = Lowest asset price in the previous n periods of trade
Calculation Example:
For instance, if we wish to calculate the %R of a given chart for an observatory period of 14 days, with a highest asset price of 96 within this period and a lowest price of 79 and a 91 closing price in the last 14 day-period,
W%R = (96-91) / (96-79) * -100%
= 5/17 *-100%
= -29.4%
How It Works:
The nature of the %R indicator helps traders to easily identify current trends and future ones to best make properly informed decisions. The oscillating feature of it makes this possible. When the trend line of the oscillator shifts towards the 0 to about -20 range, it implies the price has been in a selling position for too long and therefore it is highly possible for a trend reversal into the opposite direction.
The same way, if the trend line of the oscillator shifts towards the -100% range, it implies the price has been in a buying position for too long and hence it has higher probability of reversing to the opposite trend direction. In this way, traders are able to point out profitable entry and exit points during trade.
The Best Setting:
To customize the settings of a %R indicator on your chart, you must launch it into the chart. To illustrate, when you open any chart on say tradingview.com,
- Click on the Indicators button and search for Williams%R indicator and click on it
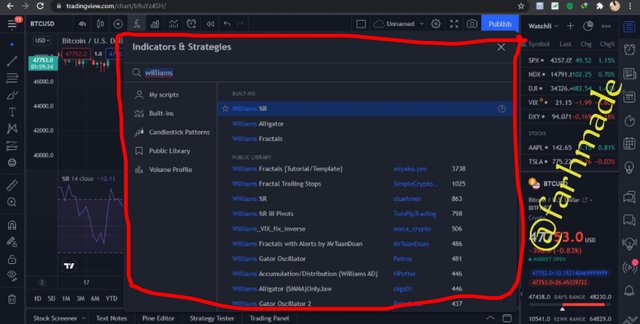
- The indicator will be added to your chart automatically
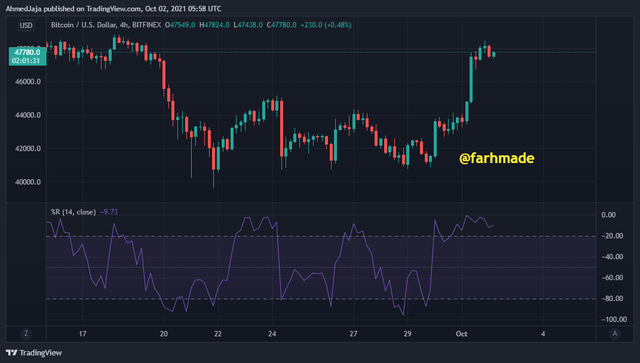
Then click on the settings tool of the indicator where it will take u to the customization screen
Here, you can alter the length, timeframe, fontstyle, visibility, etc depending on your preference.
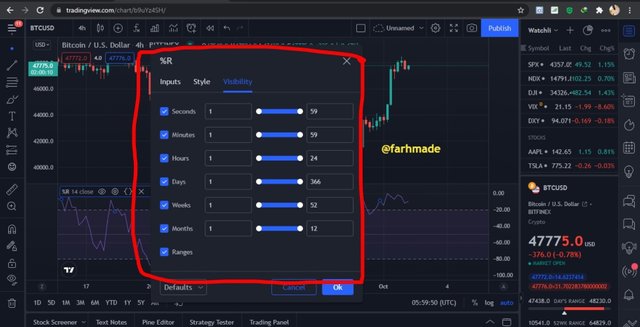
- The default length setting of the indicator is 14, so I choose to work with it
Justification For My Choice:
The default period for observation settings of the %R indicator is 14, as preferred by Williams. However, depending on the type of trading one does, he/she can opt for better options by customizing it to better suit them.
As a short term trader, I'd prefer to use smaller periods of observation inorder to be able to get quicker signals and impressions in my charts. As a long-term trader, I'd prefer to use longer periods of observation and higher settings so as to help adjust the fluctuations of the indicator momentum during price changes.
Using the default(medium) settings is a far better choice in most cases, as it will be more applicable in market charts by providing more prominent entry and exit points as compared to settings with extreme values.
Q2. How Do You Interpret Overbought And Oversold Signals With The Williams%R When Trading Cryptocurrencies (Screenshot Required):
The ability to identify and interpret overbought and oversold signals in a market chart gives traders a much needed advantage. W%R is a perfect indicator in this regard.
Overbought Signals:
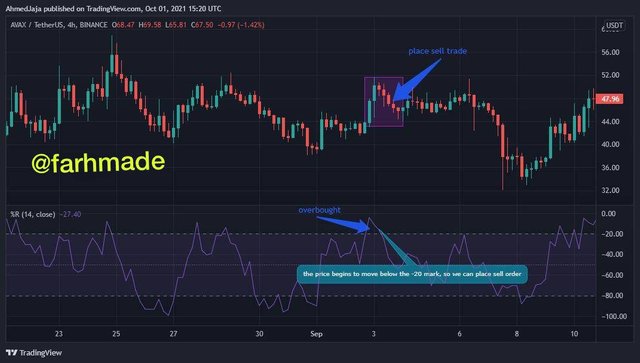
The asset prices are said to be overbought Signals when the indicator trend lines lie between 0 and -20% as shown in the chart you're working with. Prices are expected to take a trend reversal after an overbought signal. When the prices begin to give the signal, we wait a while to confirm that the price clearly begins to fall before we input sell order
Oversold Signals:
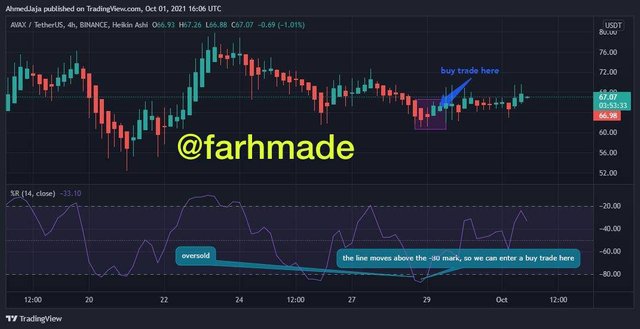
The asset prices are considered to give oversold signals when the indicator trend lines lie between -80% and -100% as shown in the chart you're working with. Usually, prices are expected to take a trend reversal after an oversold signal. When this occurs, we should wait a little longer until we see the prices begin to move up clearly, with a strong bullish signal.
Q3. What Are "Failure Swings" And How Do You Define It Using The Williams%R?(Screenshot Required):
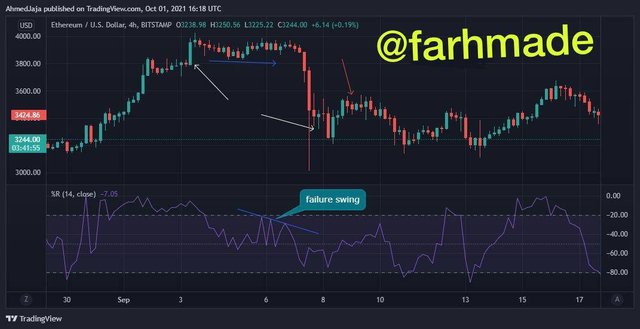
Well, failure swings basically refers to situation where the indicator lines fail to clearly move above or below the overbought and oversold margins. In such instances, it is very difficult depicting the next trend patterns that'll take place. For example, in the WPR indicator, a failure swing occurs when the indicator does not move above and below the -20 and -80 marks respectively.
This weak momentum in the market prices shown by the WPR indicator is a bit tricky in a sense that, when a trend is moving in say a bullish direction, one may as well expect it to continue towards and above an overbought margin before placing sell order. However, it reverses before breaks the mark.
To best acclimatize to the occurrence of failure swings in a market, when we identify a weak momentum in price value in a bearish trend, it fails to cross the -80 mark before reversal, indicating an uptrend, hence a buy order can be made. The same way, when the indicator fails to break above the -20 mark in a bullish trend before reversal into a downtrend, it indicates a buy order can be made.
An example of a failure swing can be seen in the chart image below where the indicator fails to cross the -20 mark as it weakens, and reverses sooner.
Q4. How To Use Bearish And Bullish Divergence With The Williams %R Indicator? What Are Its Main Conclusions?(Screenshot Required):
The appearance of bullish and bearish divergence signals are key to identifying good entry and exit points in a market. These divergence patterns enable traders to highly predict and place trades at good profitable points.
Bearish Divergence With WPR Indicator:
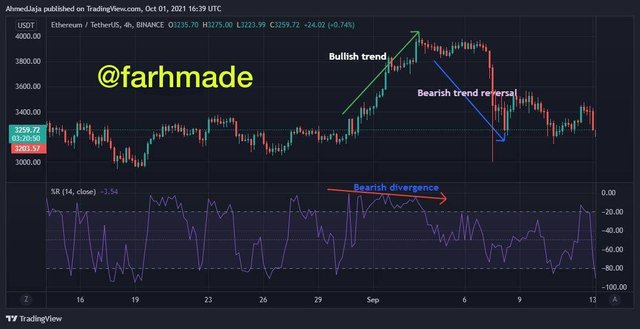
A bearish divergence usually indicates a good signal for placing sell orders. On a WPR indicator, it is generally represented by a slight downward movement of prices in the overbought section even though the prices continue to increase in the actual market chart.
Considering the screenshot of a Ethereum/TetherUS chart below, we can clearly see a good example of a bearish divergence where there's a slight downward direction of the indicator in the overbought region while there a continuous increase(ie; higher highs and higher lows) in the price movement. This gives a great opportunity to input a sell order.
Bullish Divergence With WPR Indicator:
A bullish divergence usually indicates a good signal for buying. On a WPR indicator, mostly represented by a slight upward movement of prices in the midrange/oversold sections even though the prices continue to decrease in the actual market chart.
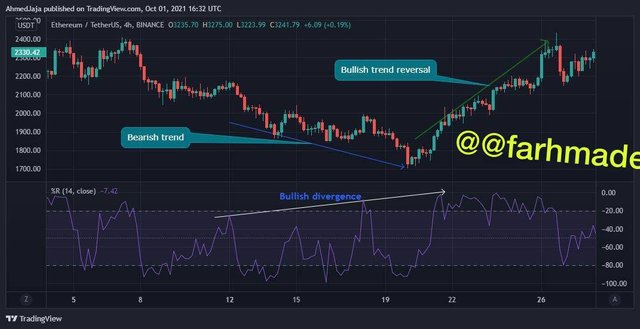
From the screenshot of a ETH/USDT chart above,we can clearly see a good example of a bullish divergence where there's a slight upward direction of the indicator in the midrange region while there's a continuous decrease in the price movement. This gives a great opportunity to input a buy order.
Q5. How Do You Spot A Trend Using The Williams%R? How Are False Signals Filtered?(Screenshot Required):
As mentioned earlier, the Williams Percent Range Indicator is very useful in determining strong trends as well as trend reversals. We established already that asset prices are said to be overbought when the indicator line moves above the -20% mark, while it is oversold when the indicator line moves below the -80% mark. The WPR indicator is also noted for its ability to display very strong bearish and bullish trends in a market chart.
For instance, a strong bullish trend is said to occur when the indicator line lies above the -50% mark, whereas a strong bearish trend occurs when the indicator line lies below the-50% mark.
The WPR indicator is best used with other technical analysis indicators so as to completely filter out market noise that may give false signal impressions.
1. False Signals:
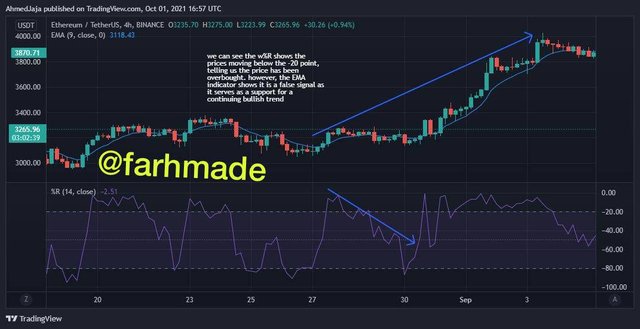
To illustrate this, let's consider the ETHUSDT chart below. We shall use the WPR with the EMA indicator best filter out false trend signals.
In the chart, we can observe the WPR indicator moving below the -20% mark, indicating a trend reversal. However, after we filter out the noise with the EMA indicator, we observe that the price continuous to move upward in the overbought region.
2. Correct Signals:
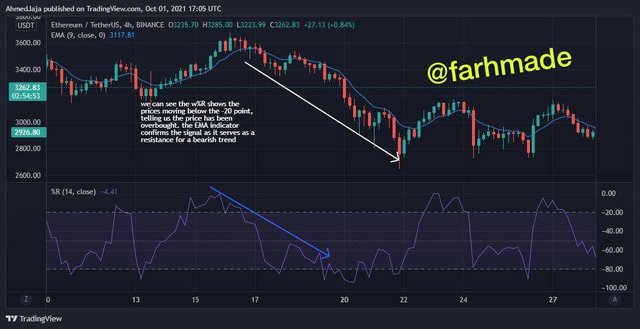
In the chart below, we can observe that when the WPR indicator line began to move below the -20% mark, it was confirmed by the EMA indicator which serves as a resistance indicating a bullish trend reversal.
Q6. Use The Chart Of Any Pair(STEEM/USDT) To Present The Various Signals From The Williams%R Indicator.(Screenshot Required):
Buy Signal:
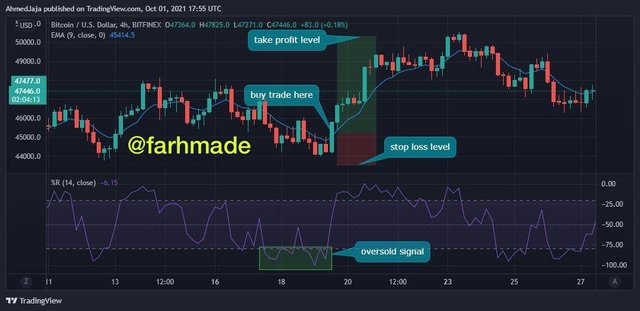
By using the Williams%R, one can easily identify signals and enter into trade. When the indicator line move above the -80% mark on the chart, we get a signal of a pending uptrend after the prices have been in an oversold region for a while now. At this point, I can enter into trade by buying.
To demonstrate this, consider the BTC/USD chart below. We can see the indicator line as it moves above the -80% point. This indicates a very good buy option. However, to be safe, I apply the EMA indicator as well so as to filter out fake signals.
After seeing the price level is above the EMA indicator line too,which serves as a support, I go ahead and place my buy order
Sell Signal:
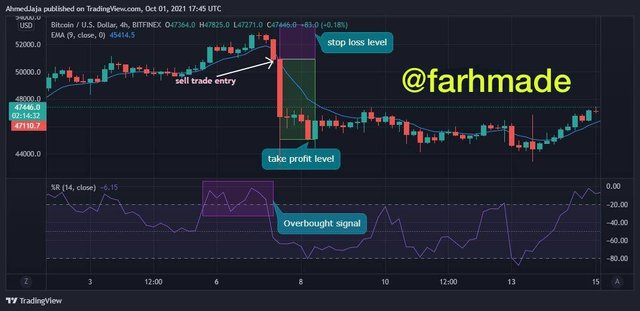
Similarly, the WPR indicator also gives a good approximation of a sell entry when the indicator line moves below the-20% point. This indicates the prices have been in an overbought position for a while now and a trend reversal is imminent.
From the image below, we can observe as the prices begin to move downward after a strong bullish trend.The indicator line lies below the -20% mark, giving a good bearish impression. However, to be on a safer side, we employ the EMA to filter out any fake signals.
Once we're clear, I can then place a sell order just after it breaks the EMA indicator.
In conclusion, it is fair to say Larry Williams deserves good praises for the work he's done concerning W%R Indicator. It is one of the best indicators I've come across so far and I look forward to using it consistently in my crypto trading. It is a very good technical analysis indicator and helps to traders to easily analyze and identify good trade entry and exit points especially when used in conjunction with other good technical indicators.
Thank you very much for reading my post guys. I hope you enjoyed reading this post as much as I enjoyed Professor @kouba01's own. I look forward to hosting you with another assignment post next week. Until then, do have a wonderful time.
Hello @farhmade,
Thank you for participating in the 4th Week Crypto Course in its 4th season and for your efforts to complete the suggested tasks, you deserve a Total|7.5/10 rating, according to the following scale:
My review :
Good work in general in which the answers differed in their analysis and interpretation, and these are some notes.
Thanks again for your effort, and we look forward to reading your next work.
Sincerely,@kouba01
Downvoting a post can decrease pending rewards and make it less visible. Common reasons:
Submit
Thank you very much professor
Downvoting a post can decrease pending rewards and make it less visible. Common reasons:
Submit