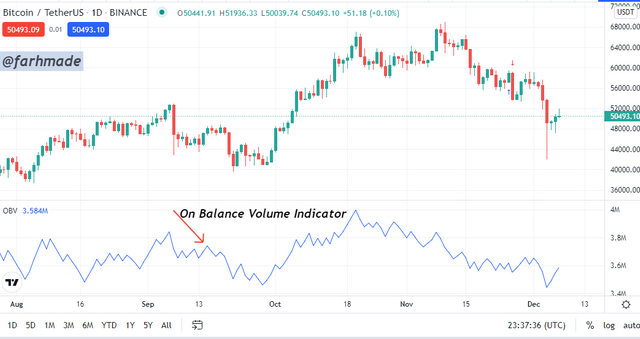
In your own words, explain your understanding of On-Balance Volume (OBV) Indicator.
Day in day out, we do have a lot of technical gadgets in the crypto ecosystem that helps us to able to make predictions as to the direction of the trend or the prices of various crypto assets. These technical tools come in the form of indicators which our noble professor has taken as another great indicator for us to go through and learn everything we need to know about it.
The On-Balance Volume Indicator (OBV) is another great technical indicator found in the crypto world which was brought to the limelight in the year 1963. This indicator was invented by Mr. Joseph Granville, a great technical analyst, and was of great help to the crypto market. The inventor of this indicator thought wise that, the price of various crypto assets in the market was influenced by the volume on it. That is to say, this indicator works in such a way that, it gives the trend or direction of the price of various crypto assets depending on the volume of it been sold or bought. We all know that the more a crypto asset is been demanded, it will increase the volume of it in the market, and the same way if this crypto asset is been supplied the volume of it being supplied will also be high. Therefore, the OBV indicator makes good use of the volume of the asset either been demanded that is bought and held or sold to indicate the price direction.
Thus, the direction in which the indicator predicts the price movement of the asset is a result of it being high in terms of volume. For instance, let's take this scenario which will help explain the indicator. In the crypto market where we have a lot of traders making a purchase of a certain crypto asset and holding it. This will make the token gain popularity as well as a lot of volume on the market. That is to say, it will be a trending token or asset. This activity will affect the price and thereby causing to increase in value. That is we will be seeing an uptrend movement of this asset. This was a result of the high volume of buyers purchasing the asset and holding it.
On the other way round, when we have numerous traders letting go of an asset in the sense that they sell off this asset in the market. That is, the price of the asset has reached a particular value that they think is enough of them holding and for matter, they decide to leave trade by selling the asset will affect the price value. That is to say, if the volume of this activity is high it will cause the falling of the price of the asset. The On balance indicator, therefore, puts all these analyses together in terms of the buyers and sellers to give the direction as to which the price value will be moving.
The OBV indicator as a momentum indicator, therefore, indicates the trend of the market of the crypto asset as it comes in the form of oscillatory lines. We have the uptrend to be indicated by the higher highs and that of the higher lows with the lower lows and that lower highs to be that of the downtrend indication. Also, the price of the asset is been determined by the indicator with the volume of buy orders and that of sell orders of the asset. The indicator goes in a long run to make it clear to traders of the price breakouts of the asset in the market.
Using any charting platform of choice, add On-Balance Volume on the crypto chart. (Screenshots required).
With the help of the trading view platform, I will make an addition of the OBV indicator to any chart of my choice.
- To start the process, we need to visit the trading view platform with the help of this link.
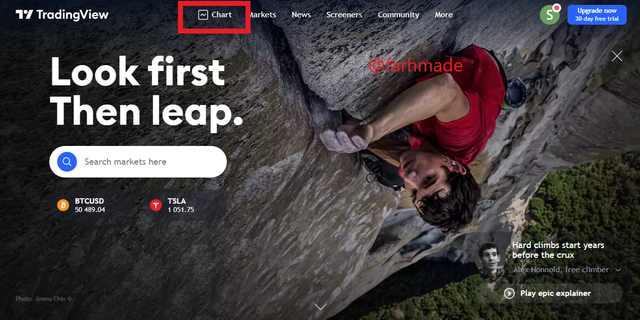
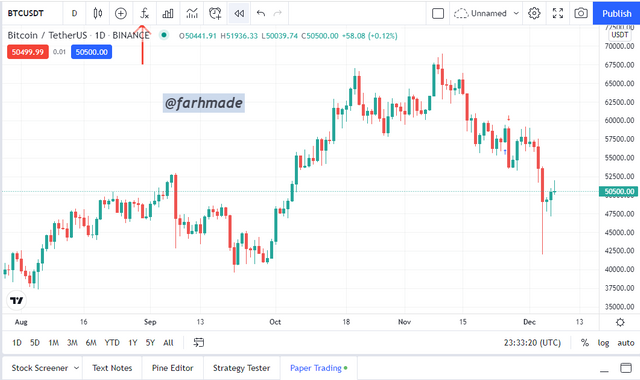
- Click on Chart to take us to chart to continue the process. From the interface that opens, make a click on the indicator icon in form of Fx to continue.
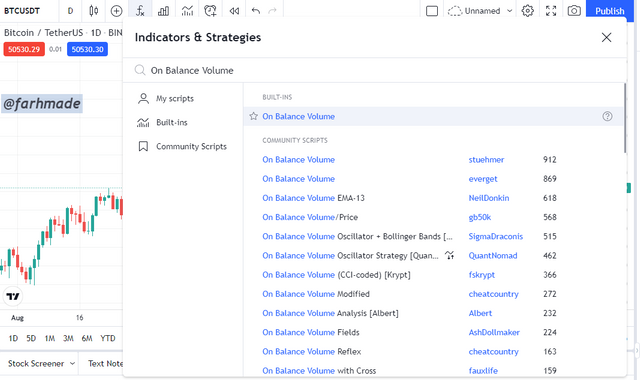
- Make a search of the On Balance Volume indicator to add to the chart.
- Click to add the indicator to the chart successfully as seen below.
What are the Formulas and Rules for calculating On-Balance Indicator? Give an illustrative example.
With the calculations of the On-Balance Indicator, it is one that does not require a lot of technical analysis to manipulate. The calculations are focused on the preceding day price of the asset with that of the present day closing price of the asset. That is, we get the value of the OBV indicator by either adding or subtracting the Present Volume of the asset depending on the preceding day price of the asset. We also do add 0 if we have no difference.
- In a situation we have the Present day closing price to greater than that of the preceding day we have the formula to be,
On Balance Volume= OBV previous + The Present Volume
In a situation we have the Present day closing price to lesser than that of the preceding day we have the formula to be,
On Balance Volume= OBV previous - The Present VolumeIn a situation we have the Present day closing price to same as the preceding day we have the formula to be,
On Balance Volume= OBV previous + 0
What is Trend Confirmation using On-Balance Volume Indicator? Show it on the crypto charts in both bullish and bearish directions. (Screenshots required).
With regards to determining the Trend of a market using the On Balance Indicator this is simple as we all know that, the indicator predicts the price direction of a crypto asset as a result of the volume which is been injected into the market. That it to say, when we have interactions of buyers and sellers in the market, this will affect the price to either be in an Uptrend or that of a Downtrend.
In using the OBV indicator, we have the lines to be in forms of higher highs and that of higher lows to be indicating an Uptrend of the asset. That is, when we have the OBV to be showing or be in form of higher highs and higher low lines we have the Trend to be Bullish.
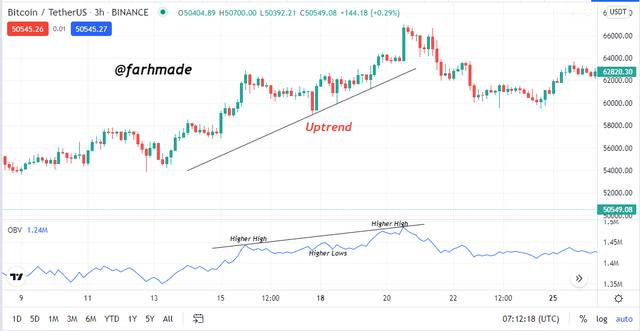
From the above chart, we have seen the Trend to be in an Uptrend as the OBV indicator comes in forms of higher Highs and that of higher lows making the trend to be bullish. This will be a great opportunity for traders to move into the trade in order to make purchases for profits at the end.
Moving further to the Downtrend of the market, this trend is also figured out with the help of the OBV indicator which comes in the form of lower highs and that of lower lows. This trend happens as the indicator shows it as a result of volume reduced in the market of traders selling of the asset. Thereby causing a downtrend in the market.
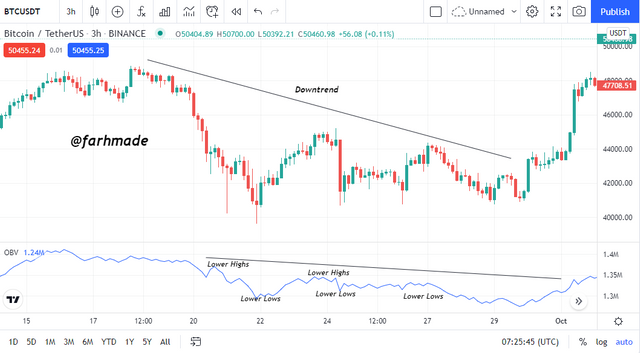
From the chart above, we can see the Trend of the market to be in a Downtrend as the OBV indicator is in form of lower lows and that of lower highs. This as a result of the volume that is been reduced in market causing a downtrend of the market and bearish trend for that matter.
What's your understanding of Breakout Confirmation with On-Balance Volume Indicator? Show it on crypto charts, both bullish and bearish breakouts (Screenshots required).
When we talk of Price breakout, this is simply the situation where we have the price accumulating for sometime and then breaking out to either the uptrend direction or that of the downtrend direction. That is, this stage happens in such a way that, the price of the asset will be seen stable for sometime before moving either upward or downward after gaining some momentum. The On Balance indicator is able to determine these breakout of the price after volume is been pumped into the market for an uptrend direction and reduced for a downtrend.
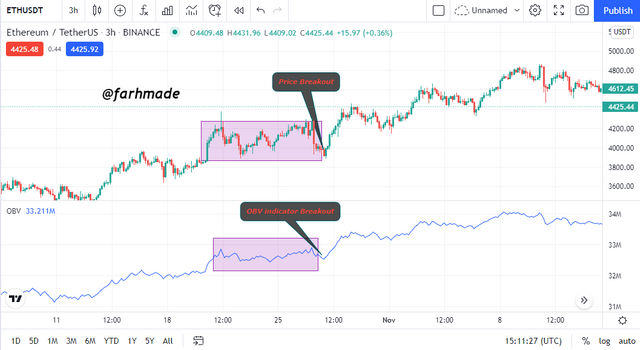
Looking at the chart above, we can see the breakout of the price after been stable for sometime and then trending in the upward direction. This was also indicated by the OBV indicator as we can see the volume which was been pumped into the market and therefore causing an uptrend with high pressure.
Moving ahead, we have the Price breakout moving with regards to downward direction of the asset. That is, we will see the price of the asset been stable for a while and then trending in the downward direction as a result of the volume reduced in the market. The OBV indicator makes this clear by indicating this downward movement of the crypto asset as seen below.
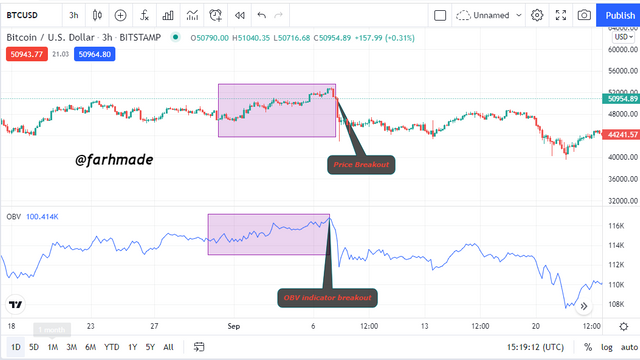
From the chart above, we can see the price breakout of the asset and then moving to the downward direction. This was indicated and confirmed by the OBV indicator as seen above.
Explain Advanced Breakout with On-Balance Volume Indicator. Show it on crypto charts for both bullish and bearish. (Screenshots required).
In the just ended question we have taken our time to go through what price breakout is and also using the OBV indicator to confirm it. With this section, we are looking at the situation where we have the indicator breakout to happen before that of the Price breakout of the asset. Thus, with this phase, we have the price of the crypto asset not been able to break with regards to the previous low or that of high but the OBV indicator been broken with it's previous high or that of low. This is as a result of the volume that was been injected into the market to cause the breakout of the price to either an uptrend or downtrend direction.
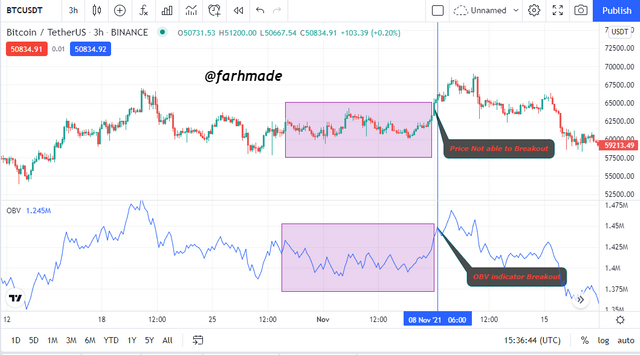
From the chart above, we can see the price of the asset not been able to break out it's previous high for an uptrend but we have the OBV indicator to break out in price.
Moving ahead to the bearish breakout also, this situation also occurs when the price of the asset is not able to breakout the previous low but the OBV indicator has already broken out. This was as a result of the volume that was reduced in the market making the price to fall to move below the previous low.
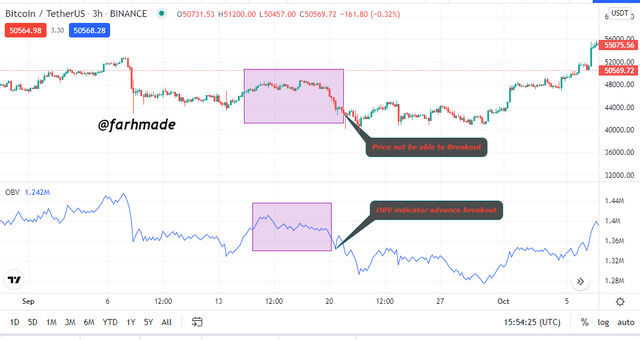
From the chart above we can see the price of the asset failing to breakout of it's previous low but that of the OBV indicator breaking out it's previous low. This is as result of the volume reduced in the market.
Explain Bullish Divergence and Bearish Divergence with On-Balance Volume Indicator. Show both on charts. (Screenshots required).
In the crypto market, we do have the occurrence of divergence which seems to be a normal situation. That is, the indicators used in the crypto market do have bullish and that of Bearish divergence with the price of various crypto assets. These occurrence if studied well by traders will be of great help as the reversal of the divergence will be of great aid.
With regards to the Bullish or Uptrend movement, the crypto asset will be seen in forms of higher highs lines and for that matter we have the price to be in an uptrend movement but that of the OBV indicator indicating lower lows and lower highs. This happens to be a divergence occuring and it will be a signal for sell as the volume injected will be reduced.
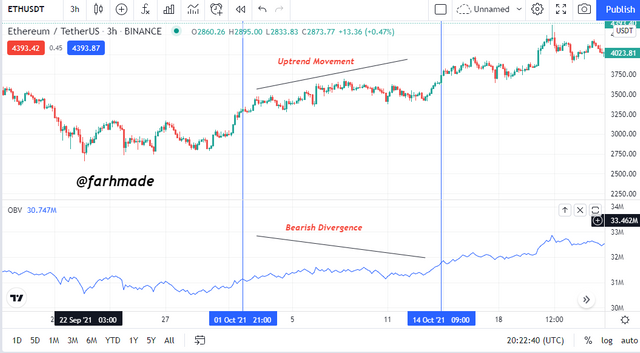
From the chart above, we have the bearish divergence to occur as we see the price of the crypto asset been in an uptrend of higher highs and that of the OBV indicator indicating lower lows lines. This will serve as a great signal that there will be a trend reversal and will aid in making profits.
Moving further to the Downtrend of that the Bullish Divergence, it can be seen that the price of the crypto asset will in form of lower lows and the indicator will be indicating lines with that of higher highs. This is therefore a Bullish divergence and serves as a signal for buying in order to make profits.
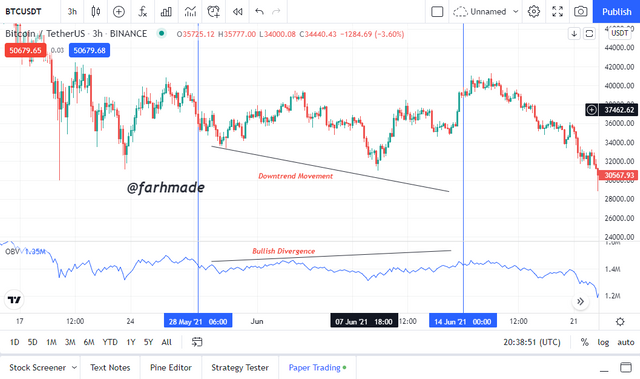
From the chat above, we can see the price of the asset being in the form of lower lows candles and that of the OBV indicator signalling with lines of higher highs indicating a buy signal as there will be a trend reversal for an uptrend soon
Confirm a clear trend using the OBV indicator and combine another indicator of choice with it. Use the market structure to place at least two trades (one buy and one sell) through a demo account with proper trade management. (Screenshots required).
I will make good use of the Alligator indicator and that of the OBV indicator to carry out my trades for this question. That is, with the Alligator indicator, we have the Buy signal to be given when there is a crossover of the lines, that is the green line crosses that of the blue line and making the green line to be on top. This serves as a buy position as there will be an uptrend. On the other hand, we have a sell position when the blue line is found at top of the green line as there will be a downtrend going to happen.
With the buy signal we have this situation when the OBV indicator is forms of higher highs and that of higher lows and also the Alligator indicator having the green line to be found on top of the blue and red line.
I therefore placed the order of buy when the uptrend it to begin in order to make profits as all indicators as made is clear.
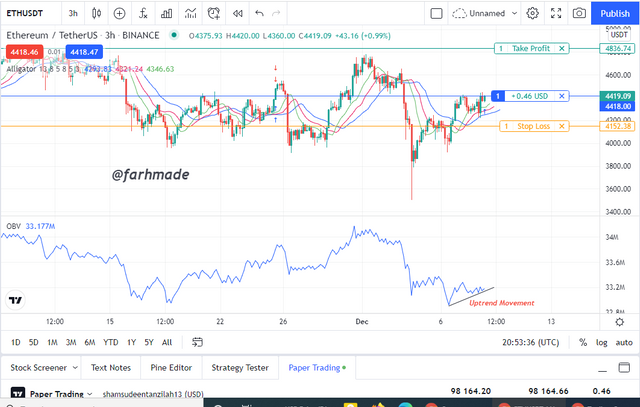
From the chart above of that of ETH/USDT, we can see it to be in an uptrend as the green line of the Alligator indicator is on top and that of the OBV indicator been in the form of higher highs. This serves as a signal for buy. I therefore placed my order with my take profit and stop loss as seen above.*
With regards to the sell signal, we will have the blue line of the Alligator indicator been on top and that of the OBV indicator being in the form of lower lows and lower highs. This shows a downtrend and for that matter one is expected to exit the trade with profits made.
I therefore placed my sell orders as a result of the downtrend occuring in the market.
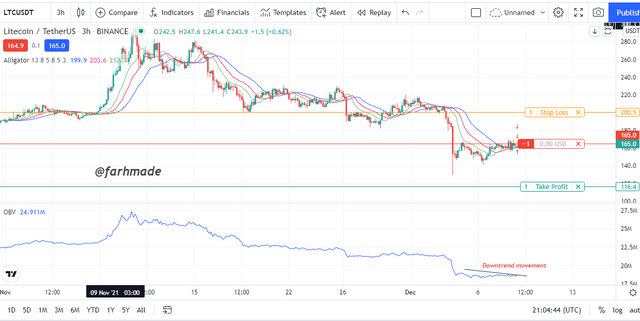
From that chart above of that of LTC/USDT, we have the Alligator indicator indicating a downtrend and for that matter a sell signal as the blue line is on top with the OBV indicator being in the form of lower lows. This shows a downtrend and for that matter I placed my sell order with my stop loss and take profits.

What are the advantages and disadvantages of On-Balance Volume Indicator?
As we all know, in the crypto ecosystem, we have great indicators that do help in our trading analyses but they do have advantages and that of disadvantages. I will therefore list out these advantages and that of disadvantages.
OBV indicator is great indicator that does not require a lot of technical know how to operate.
This indicator is a simple indicator and and very easy to use.
The Indicator is able to give out signals on trends of the market that is, the breakout of prices and so on.
The OBV indicator also can be used by any type of trader with any trading techniques.
The OBV indicator is best when combined with other indicators.
The OBV indicator does not give correct signals with regards to assets with low volatility.
In a nut shell, I am grateful to our noble professor for this wonderful lesson. The OBV indicator is yet another great indicator I have learnt about. This indicator operates as a result of the volume of interaction between sellers and buyers in the market. That is an uptrend will be indicated as many traders to buy and make hold og the token or asset and a downtrend will be signal as many people leave the trade of an asset buy selling it off.
The Price breakouts of the market are been identified with the help of the OBV indicator as well as divergence which are all of great benefits to traders to make profits.
I am grateful to professor @fredquantum for this lecture and hoping to takin part in more of your class.
