I am very happy to be taking part in your second assignment prof @reminiscence01 having partook of the first class on understanding trends I, and having taken time to carefully go through and analyze the homework post i make my post thereof based on my understanding of this weeks class.

1. a) My Understanding of Trend Reversal.The Benefit Of Identifying Reversal Patterns In The Market?
In the financial market or stock, or in trading of derivatives or forex or crypto markets it kind of follows a trend which we are very much familiar with. Ofcourse a market could be in an uptrend or in a downtrend as the case maybe. When the market is in an uptrend we could rightly say the market is bullish but when in a downtrend then it is a clear indication of the market bearish stance, now being aware of this we might wonder what then is trend reversal?
Well we could say that a trend reversal often marks the end of an existing trend and the beginning of a new one in the crypto markets or while trading derivatives. For there to be a trend reversal then an existing trend has to be broken an a new one formed, yes a trend can breakdown without forming a new trend in which case it could not really be a reversal pattern. So for us to really say there has been a trend reversal then a bull trend has to end and form a downward trend or vice-versa.
A trend reversal often involve the breakdown of a trend and the establishment of a counter trend. It is good to note too that reversals could easily happen in any time frame. We have different types of reversal which could be head and shoulders pattern, tops or double tops which often suggest the end of and uptrend and a reversal to downtrend, we could also have double bottoms, triple bottoms which suggest a reversal pattern from a downtrend to an uptrend and recently many analyst has been signaling a doge coin triple bottom which could suggest a reversal from a downward trajectory to an upward one and results in a spike for the price of doge.
So basically that's the basic idea behind trend reversals and ofcourse as traders it is good to be able to note this reversal in the market for this reasons;
For me the possible benefits of understanding trend reversals in the market is simply to make profit, that is basically the idea behind trading. A trader who can be able to perfectly spot this reversals will make huge profits off of the market because let's say we are in a downtrend and he is able to spot the end of this trend and jump in after seeing the formation of a bullish trend and rides it up to the top then for sure he is guranteed huge profits.
Identifying this reversal patterns helps a trader not only in making profit but to avoid loss, if a trader is in a trade and notices signs of reversal and weakness in the market and sees clearly that this trend is ending then it could only be wise to close his position which will help him to avoid loss or minimize his loss at least to a minimum degree.
This to me are the possible benefits of being able to identify the markets trend reversal, making profit and avoiding loss, the trend is your friend all the way until it is invalidated.
How can a fake reversal signal be avoided in the market? (Screenshot needed).
I believe one way to ensure we are not running the risk of entering a trade with a false signal believing the market is going to reverse only for it to turn on us then we must take care to make sure we use all the proper indicators, i believe using the appropriate reversal indicators to ascertain for sure if the market is forming a certain reversal pattern will help us to minimize risk of fake outs.
Some traders simply enter a position based on their feelings or what they think the market will do, some maybe of the opinion for instance if a market has been bullish for a long time they may feel that that means a reversal is coming and hence at any slight opportunity of a breakdown they will enter a position expecting the market to go down whilst forgetting it is possible for a market to breakdown without forming a reversal pattern. Entering in this kind of trade could be risky.
Some traders don't care much about technicals and would rather trade the news or speculation without any clear indication from the chat that a certain reversal is forming, that is another way where they could run into risk of a fake-out. Because most times this bullish news or bearish without strong technical backing in most cases could lead to a trend reversal fake-outs that is why i believe or feel that for fake-out to be avoided then traders must make use of the various indicators used in the identification of trend reversal pattern, and wait until this said pattern is confirmed in a particular time frame before opening a position which i believe will help in reducing the risk of a potential trend reversal fake-outs.
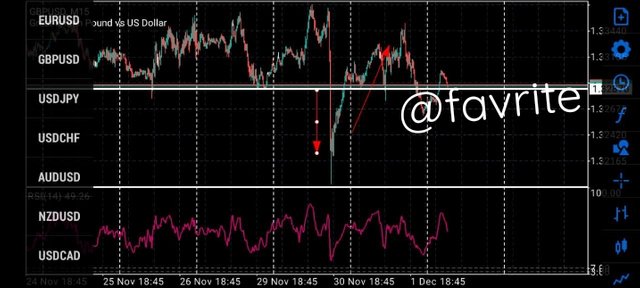 screenshot by me from MT5 App
The chart is illustrating an example of a fake-out, first of we saw the chart form something of a double top then we saw a reversal and it rightly broken below the support range now rightly expecting to continue in this downtrend it quickly shootup above support. Now in this case if a trader had entered a position after seeing breakdown of support he will likely be stopped out or liquidated as this is a trend reversal fake-outs. So sometimes a particular indicator or pattern may not be enough in spotting a trend reversal that is why we should make sure of not just one indicator but various trend reversal indicators to minimize the potential risk of a fake-out.
From last class and based on the homework post which i participated i was able to get what a market structure really is which will used in determining the general trajectory of the market whether it is in an uptrend or downtrend. Yes the market structure has a set of pattern which entails that if it's in a bullish phase or in an uptrend it usually forms series of higher highs and higher lows and if it's in a downward trajectory it forms a lower high and lower low such is the pattern of a market structure.
A market structure often follows this said pattern and in an even that it fails to follow such pattern then a bullish or bearish trend could be invalidated upon which a bullish or bearish reversal will issue.
In the case of bullish reversal It's usually formed when the market no longer follow the bullish pattern of higher highs and higher lows and breaks from this pattern and move sideways before before down in which case we can saw this is a bullish reversal.
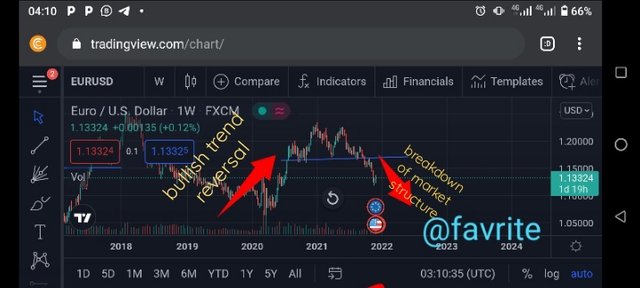 image source
Bullish reversal
The above chart shows a bullish reversal to a downtrend of EUR/USD pair from my analysis carried out on trading view.
A bearish reversal ofcourse is rightly talking about change of trend from bearish to bullish. A bear trend patterns is usually formed following a series of lower highs and lower lows and in any case that this no longer holds true then it is invalidated and usually follows the formation of a new trend upon which we could rightly say that there has been a bearish reversal trend.
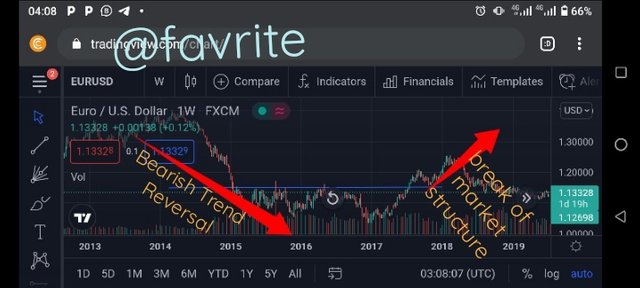 image source
Bearish reversal
The above chart shows the breakdown of a bearish trend and the formation of a bullish one indicating a bearish trend reversal to the upside.
b). Break Of Trendline
A trendline like also previously discussed is another indicator we used in determining the market direction. The trendline is in this way, in the case of a bullish trend is usually has lines connecting atleast 2 lows serving as the support upon which the trend line is drawn and in any event that the trend line is broken then a bullish trend is said to be invalidated with a reversal to a bearish one, the same also goes for a bear trend.
When the lines connecting two lows or two highs of a trendline acting as support or resistance in either a bullish or bearish trend is broken then that trend is invalidated and we would have a trend reversal.
Ordinarily in the case of trend lines so far as the price keeps on bouncing on the trend line support or resistance range that trend continues but whenever it breaks the trendline then we are in for a trend reversal and it's often wise for a trader to act in that case.
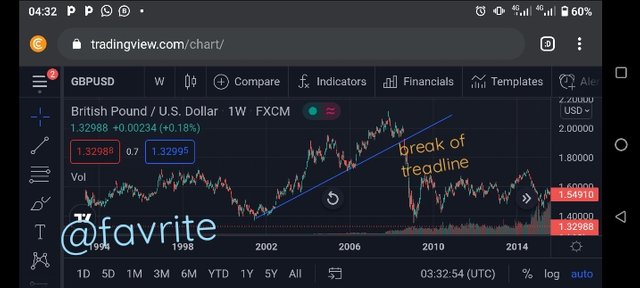 image source
Bullish reversal
Now in this case illustrated above as the chart depicts we see a case of a bullish reversal. We see a chart following a pattern of higher highs and higher lows suggesting it is in an uptrend and then we see this pattern broken when it fell below the trend line and the a new trend was formed, a bearish one as a result of the bullish trend breaking the line of support of the trendline.
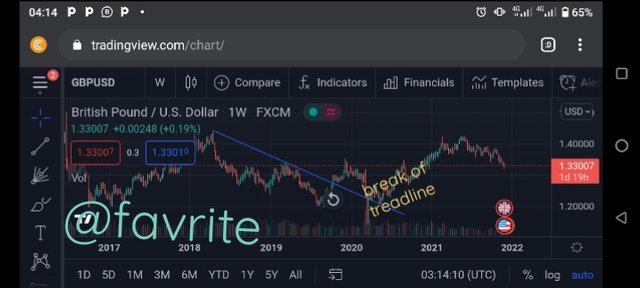 image source
Bearish reversal
In this case as well it is a case of bearish reversal, a trend formally forming a lower low and lower high in a downtrend always getting rejected at the resistance line upon which point the trend line is drawn but at a point we saw a trend reversal when it successfully broke through the trend line and formed a new trend, an upward one. So this is a case of bearish reversal to a bullish trend.
c). Divergence
Divergence literally means to move in a different direction from a common specific point. In the crypto or stock market generally we notice divergence when the rsi is showing signs of weakness even though a particular trend is still active but the rsi is showing or indicating to be acting in different directions. When the trend is moving in a specific directions and the rsi indicator is moving in an opposite direction then we could say there is a divergence and this divergence often indicates trend reversals.
When a market is moving up and the rsi is showing a slope to the downside it indicates a trend reversal. Divergences is used to show reversals in the market.
Bullish Divergence
A bullish divergence is actually a price reversal from a bearish trend. In a bear trend ofcourse we know that the price makes lower highs and lower lows but in a case when the indicator is making this lower lows and the rsi indicator is making a higher high a move opposite of what the bear trendline is showing then that shows that the bearish momentum is running out and we are setting out for a bullish reversal which usually leads to an uptrend move.
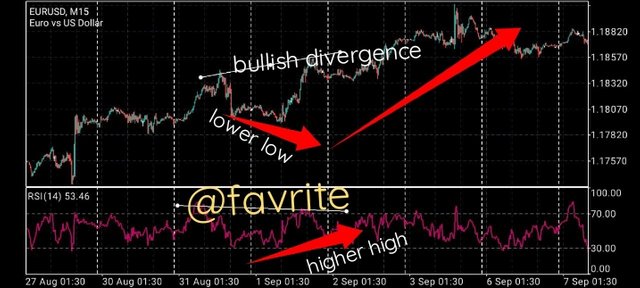 screenshot by me from my MT5 App
Bulllish reversal
Bearish Divergence
Similar to a bullish divergence a bearish one is quite the opposite. It usually occurs when the trendline is making higher highs while the rsi indicator is showing signs of weakness by disagreeing with the price movement which it does with the formation of lower lows. When this happens it shows that the bulls are running out of steam and are not able to continue any longer in an uptrend, it usually leads to a breakdown of a bullish trend followed by a reversal to the bearish trend.
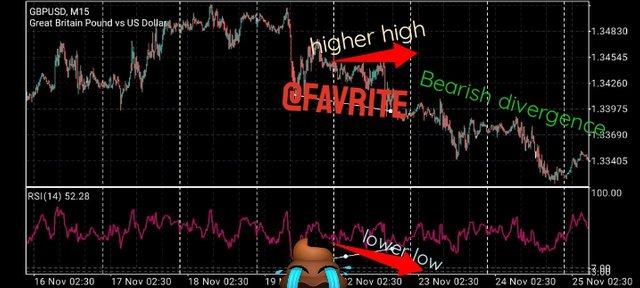 screenshot taken by me from MT5 App
Bearish divergence
Double Tops & Double Bottoms
Double tops or double bottoms as the case maybe simply refer to points in the market where price is not able to move further. For the case of a double top it is actually a reversal pattern because of the the inability of the market to form a high higher than the previous one. When the price is not able to pass through the first high point or make a higher high it suggest weakness by the bulls and a reversal to the downside often follows after the formation of a double top.
So in the case of a double top the price is only able to come up around the same price point as the previous high thereby forming a reversal pattern known as a double top because of its inability to penetrate further.
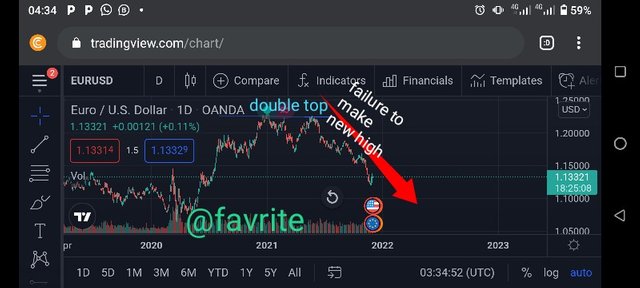 image sourceDouble Top
Now in the case of a double bottom it is very similar to that of a double tops in that it is actually formed as a result of the inability of the market to form this time a low that is lower than the previous low to confirm the trend. The formation of a low that is lower than the previous low we actually confirm the continuation of a bear trend but in this case it seems that the bears run out of steam and are unable to push the price of the market lower than the previous low originally obtained which then leads to the formation of a double bottom which is a reversal pattern that often leads to an uptrend.
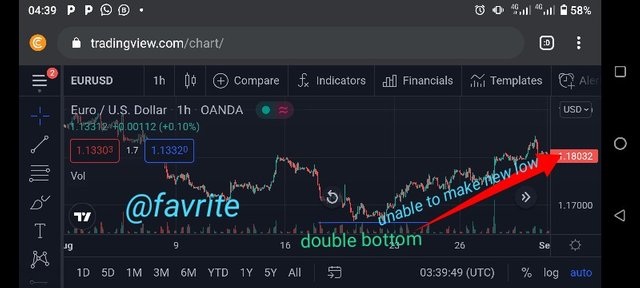 image sourceDouble bottom
3). place a demo trade using any crypto trading platform and enter a buy or sell position using any of the above mentioned trend reversal/continuation pattern
Well i used btc chart to analyze open this position with my demo account on meta 5 trader app and i was able to dictate a double bottom in the 1 hour time frame as of when i carried out my analysis.
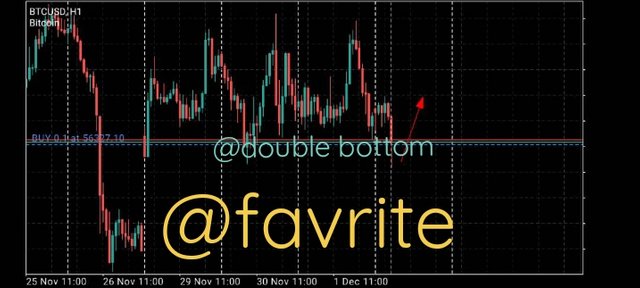
As the image shows i sighted a double bottom and i put in a buy position, an order to buy btc at $56327.10 with a lot size of 0.1 after sighting this buy order and after a while i witnessed this👇
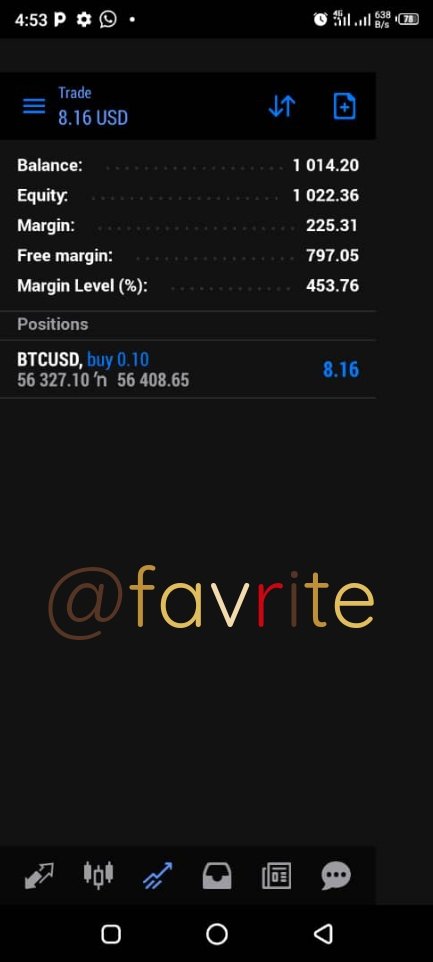 Result of my trade
This image indicates my trade success rate which was playing out fine really from my analysis on the double bottom reversal pattern.
Conclusion
Indeed i believe trend reversal is a powerful signal that any trader can leverage on to make some profits in the market by spotting them at the right time and taking appropriate action when the need arises either to buy long or to exit a trade when the trend reverses against us. I believe in order to make huge profits with the reversal trend then it is of utmost importance that a trader enters the position quickly when it is detected not after it must have played out which will be meaningless taking action then. To make sure we are not faced with the risk of fake-outs after entering a position then we should take care to make appropriate use of the various reversal tools or indicator to confirm that it is indeed a valid reversal pattern and not a trap.
Hello @favrite , I’m glad you participated in the 3rd week Season 5 of the Beginner’s class at the Steemit Crypto Academy. Your grades in this task are as follows:
Observations:
You have violated the homework guidelines by using a non cryptocurrency chart for your study. This is crypto academy and every study should be related to the crypto market.
Please pay attention to homework guidelines. Thank you for participating in this homework task.
Downvoting a post can decrease pending rewards and make it less visible. Common reasons:
Submit
Please prof @reminiscence01 my homework post is yet to be curated please do help me out
CC:
@reminiscence01
@sapwood
Downvoting a post can decrease pending rewards and make it less visible. Common reasons:
Submit