Good day steemians, I want to welcome everyone to the season 6 and it feels good to post here again after the short break. I will be posting my assignment on the topic BASIC TO TRADE CRYPTOCURRENCIES CORRECTLY (PART 1).
.jpg)
IMAGE DESIGNED ON POSTERMYWALL.COM
What do you understand by trading? Explain your understanding in your own words.
What are the strong and weak hands in the market? Be graphic and provide a full explanation.
Which do you think is the better idea: think like the pack or like a pro?
Demonstrate your understanding of trend trading. (Use cryptocurrency chart screenshots.)
Show how to identify the first and last impulse waves in a trend, plus explain the importance of this. (Use cryptocurrency chart screenshots)
Show how to identify a good point to set a buy and sell order. (Use cryptocurrency chart screenshots)
Explain the relationship of Elliott Wave Theory with the explained method. Be graphic when explaining.
Conclusion.


The concept of trading has been in existence for a very long time now. Right from the time of our forefathers to this present time, the act of trading has been practiced from generation to generation. From trade to barter to Fiat trading and down to crypto trading there've been series of evolution in this practice as time changes. Today, we are all living to experience the modern day form of trading which is digital trading and this encompasses crypto trading, forex trading, stock market trading, etc. Trading itself is an act of buying and selling between two or more parties. Different things could be traded ranging from synthetic Index, Gold, oil, commodities, cryptos, stock and currencies. All this aforementioned assets all have their unique value also known as market value i.e the way a crypto is being valued and traded is different from the way foodstuff commodity is being traded. Moreover, this market value interacts with the forces of demand and supply, for example the higher the price of a commodity, the lower the demand and vice versa. Also the higher the value of a commodity, the higher the supply and vice versa.
In relation to our study, as far as this course is concerned, crypto trading is a digitalized form of trading that has change the world finance. The crypto traders employ the use of both fundamental and technical analysis to buy or sell their coins on popular trading sites or exchanges such as Binance, Bitfinex, poloniex, etc among several example of this coins that can be traded include Bitcoin, Tron, Steem, Ripple, Etherum etc. However, we mustn't forget that the major aim of trading is to make profit and that's what every trader works towards to.


As some people say, trading can be likened to a football game where so many opportunities and chances always present itself. But in this scenerio, we are talking about buying and selling opportunities. Unfortunately, we have market manipulators who can change the gears of the market at their own will, follow me closely as I unravel the mystery behind this.
STRONG HANDS IN THE MARKET
The financial and crypto market are full of the strong hands and weak hands, these two categories of investors make the game tick. Firstly, let me throw more light on the strong hands. The strong hands are basically the big investors who have huge portfolio, huge capital and high stake in the market. These category of persons have the ability and capability to drive, swing and change the market gears in their favour. They are also popularly known as the whales in the crypto ecosystem. They are called strong hands because they are strong enough to manipulate the market to their favour. They usually do this in two ways namely ; via accumulation and distribution. Before I explain this further, I want to remind us that these strong hands are predominantly financial institutions like banks, cooperate organizations, multinational companies, tech giants, and several others.
Now, by accumulation, these strong hands as have listed above ensure that they gather and acquire as much assets as possible at a very low price, whereas, the weak hands are being deceived to sell their assets. After this scenario plays out, the strong hands will begin to push the market upward by buying the assets until the supply have all been exhausted, this results in a Bullish trend as illustrated in the image below.
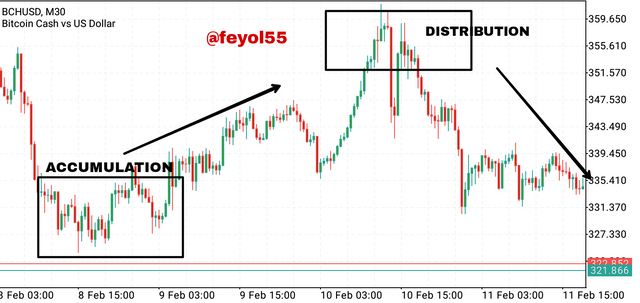
After this phase, the distribution phase then happens, in this phase, after the price has skyrocket and reach a high level, the strong hands will start selling their assets again and some traders will buy the asset with the thought that it will go up back. After the strong hands are done distributing the asset and the demand has finished, there is now going to be a sharp decline/decrease in the price of the assets.
WEAK HANDS IN THE MARKET
Now that we've understood who the strong hands are, let's talk about the weak hands. This category of persons are the small investors and retail traders who do not have big capital to drive the market. Their capital or stake is too small in the market and most times they are always at the loosing end. The strong hands end up buying their positions at a very low price when the weak hands wrongly assume and sell their positions thinking the market price will keep dropping. Also in sharp contrast, the strong hands also sell their assets to the weak hands at a very high price, by so doing, they are taking advantage of the weak hand because the weak hands wrongly assume that the price of the asset will keep increasing which is actually not the case.


Often times most retail traders especially the newbies and novice who are new to the game end up making wrong investment and trading decisions. Reason is, they are quick to let their emotions rule them which is against trading rules. You see them trading according to market sentiment which is quite detrimental. Sometimes, they hear news on popular social media sites like Twitter, Facebook and the rest especially from the popular crypto influencers.
These traders are easily swayed by popular believe and market sentiment, they follow the herd and majority just believe and hope they are taking the right decisions. The truth is not all news that are being given by these influencers on social media that are correct, sometimes, the information are disseminated late and the crypto market being a very volatile market will wreck havoc on the gullible traders who came in late. It will then be too late to discover that the market has actually left them. Not only that, sometimes the strong hands also known as the whales play the dirty game by trading against the popular decision. (Opp. Direction) they do this because they know the retail traders have been clouded by emotions and sentiments.
So to answer this question, I would say it's better to think like a PRO than like a pack. A trader should DYOR and take his due deligence in doing that, never be in a hurry to take positions in the market due to FOMO, there are always thousands of opportunities daily in the market, the market is always there, this is what gives the professionals the cutting edge, they obviously understand the game better, we need to emulate their trading style to have a chance at making profits from the market.


Trend trading is a popular trading concepts among crypto experts. A trader place an entry position according to trend moves in order to take either a SELL POSITION or a BUY POSITION. A trend is typically identified by the direction it's facing. It could either be facing up or down showing a sharp and clear direction. Now, let me demonstrate how we can identify this trends, we have the uptrend, downtrend and sideway trend.
- UPTREND
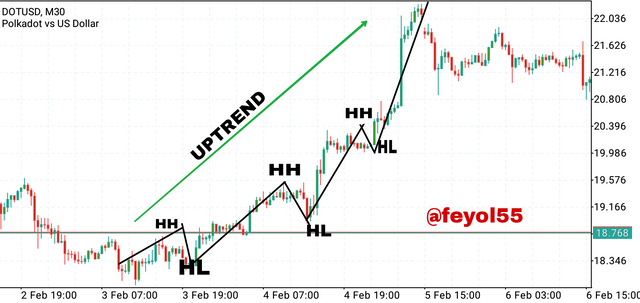
This is popularly known as the bullish trend, this trend direction usually faces up and it's usually characterised by series of higher highs and higher lows as seen in the image below. The trend indicates that the buyers are currently active and in control of the market. A trader can take a BUY position here and exit before a reversal occurs.
- DOWNTREND
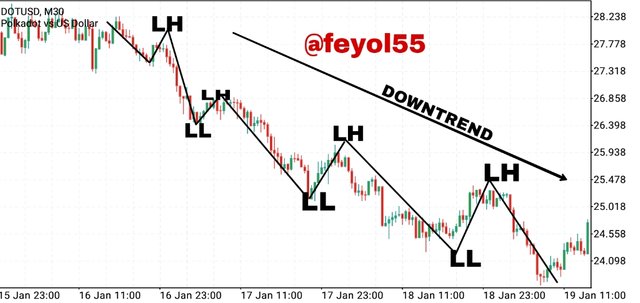
This is also known as the Bearish trend, this trend direction usually faces downward and its characterised by series of lower highs and lower lows as demonstrated in the image below. This trend indicates that the sellers are currently active and are in control of the market price. A trader can take a SELL position here and exit before a reversal occurs.
- SIDEWAY TREND
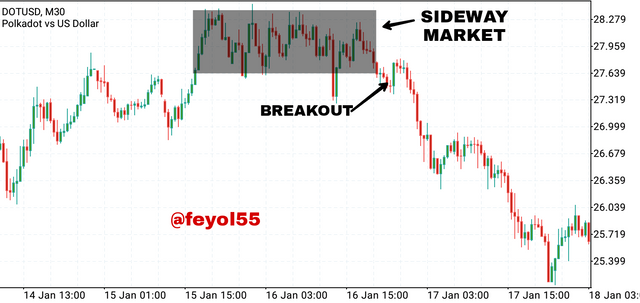
This particular trend is also known as the ranging market, here price moves up and down without a clear direction. In this trend, prices usually form a support and resistance. The best time to place a trade in this particular trend is to wait for a breakout in either at the support or resistance zone, once a breakout eventually occurs, the trader is expected to place an entry in the direction of the breakout.
However, one can also use the Elliot waves theory to understand trends, more will be discussed on this in the next section.


Firstly, before I begin to identify the first and last impulse waves in a trend. I think it's sancrosant and imperative to briefly talk on the Elliot waves theory. The Elliot waves theory postulated that market trend consist basically of 5 waves in its impulsive leg and another 3 waves in its corrective leg. The first 5 waves signifies a trend while the 3 other waves connotes a correction or reversal. However, there are 3 rules guiding this theory.
The wave number 1 should be higher than no 2 meaning the number 2 wave should fall below wave number 1.
The wave number 3 should be the highest of the 5 waves (or close to but must never be short)
The wave of number 4 must not meet the the peak of wave number 1.
Now having clarify this, let's see how the first and last impulse wave in a trend can be identified.
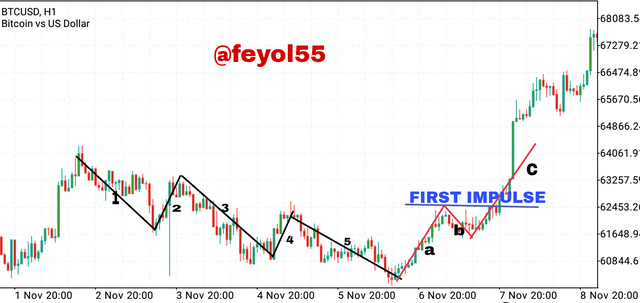
To identify the first impulse, we should focus on the correction waves because that's where the first impulse can be seen. The correction waves are usually formed at the end of wave 5 as seen above, this correction signals a reverse in identification of trend. Immediately the new trend starts, we can look for the first impulse. As seen on the chart above, we can see that the correction wave b and c formed a new high peak that was higher than the swing high formed by A. Also, the new high formed by C can be traced to wave 'b' using a parallel line or trendline as the case may be. We can then confirm a new trend after correction wave 'c' forms a new lower peak. This new trend is the first impulse wave of the Elliot waves. The impulse helps the trader to get an early entry into the new trend.
Now let's look at how to identify the last impulse.
Similarly to the last impulse, we are going to identify the maximum point here which is the wave 5, because after the wave 5 marks the beginning of a new trend.
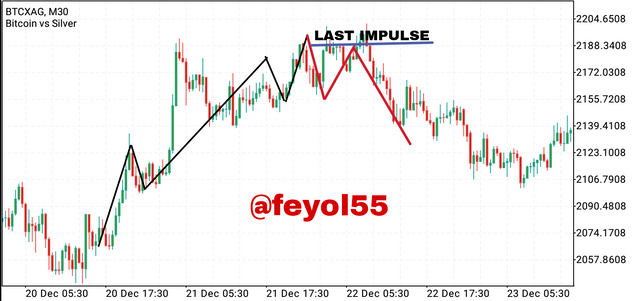
As seen in the image above, price couldn't go below the wave 5 point and this led to the formation of the new waves a, b, c which are the correction waves. The point identified by a trendline in the image above is the last impulse wave because from there price reversed in a new direction and went bullish. At this point, it's best for the trader to watch out for a BUY ENTRY


As explained earlier, we can identify a BUY and SELL ENTRY using the first and last impulse wave.
BUY ORDER
A buy order can be identified when the correction wave C line breaks the last previous peak. And to identify this peak, we can draw a parallel line to connect to the last high peak which is the first impulse. This line forms the price resistance, so once the new trend breaks above the parallel line, it is a signal to place a BUY ENTRY. This is illustrated as seen in the image below.
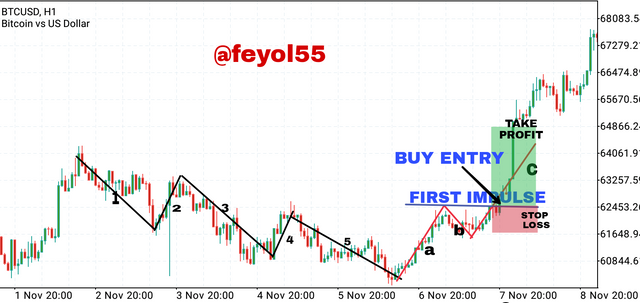
As illustrated in the image above, we've been able to establish a buy position and also stop loss was placed below the entry and the take profit was place above the entry point.
SELL ORDER.
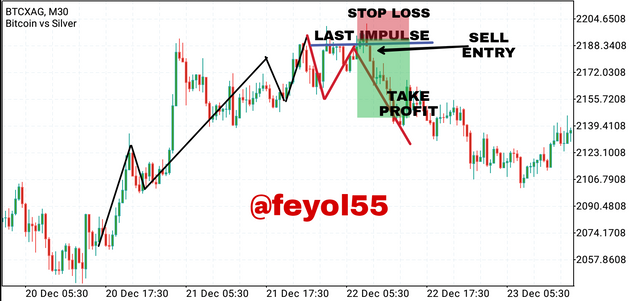
To identify a SELL order, our focus will be on the last impulse formed. After the 5th wave and the correction wave A, B, C has been formed, we can identify a SELL position once the price comes down to break the resistance line connecting the last impulse which is the previous low pack of wave 5. We can then place a SELL ENTRY at the point and also put a stop loss above the entry level and a take profit can be set below the entry.


As discussed earlier, we have the accumulation and distribution phase of the market, this two phases are majorly controlled by the strong hands who drive the market and tend to manipulate it in their favor. However, having looked at the Elliot wave theory, we can use this theory to identify this points in the market.
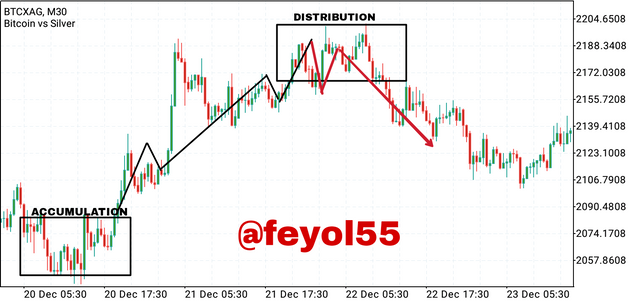
As we can see on the chart above, we can use the market interaction between the Elliot waves and the accumulation and distribution points. The accumulation point can be seen just before the start of the 1st wave of the Elliot theory, immediately after the accumulation phase is over, price went up and formed a new trend. Also at the distribution point, the strong hands were selling off which resulted in trend reversal. The correction wave A, B, C also marked the distribution phase as seen on the chart validating the theory of Elliot wave. Hence, we can confirm from this demonstration that the Elliot wave theory is a good concept to use to understand market interactions between the strong hands and weak hands and also identifying trend reversals.


As we've discussed in this study, trading encompasses a whole lot of things, proper study of the market is required to be done by the trader in order not to fall victim of the market manipulations. We can use the fundamental and technical analysis to get our fact right instead of joining the herds. We need to play the game the pros do, checkmate our emotion and trade without sentiment. After getting the analysis correct, one can buy at a low price and sell at a high price to maximize profit. Also using the Elliot wave theory, a trader can identify the relationship between the strong hands and weak hands. This theory also helps a trader to identify points of price reversal which will enable one to effectively place either a BUY or SELL ENTRY position. Special thanks to professor @nane15 for this wonderful course.
NOTE: ALL IMAGES USED IN THIS POST ARE ORIGINAL SCREENSHOTS TAKEN FROM THE MT5 TRADING APP UNLESS STATED OTHERWISE