Good day steemians, it feels good to post again in this week 4 and today I will be posting my assignment on the topic 'CRYPTO TRADING STRATEGY WITH TRIANGULAR MOVING AVERAGE (TRIMA) INDICATOR'.
.jpg)
IMAGE DESIGNED ON POSTERMYWALL.COM
What is your understanding of the TRIMA indicator?
Setup a crypto chart with TRIMA. How is the calculation of TRIMA done? Give an illustration. (Screenshots required).
Identify uptrend and downtrend market conditions using TRIMA on separate charts.
With your knowledge of dynamic support and resistance, show TRIMA acting like one. And show TRIMA movement in a consolidating market. (Screenshots required).
Combine two TRIMAs and indicate how to identify buy/sell positions through crossovers. Note: Use another period combination other than the one used in the lecture, explain your choice of the period. (Screenshots required).
What are the conditions that must be satisfied to trade reversals using TRIMA combining RSI? Show the chart analysis. What other momentum indicators can be used to confirm TRIMA crossovers? Show examples on the chart. (Screenshots required).
Place a Demo and Real trade using the TRIMA reversal trading strategy (combine RSI). Ideally, bullish and bearish reversals. Utilize lower time frames with proper risk management. (Screenshots required).
What are the advantages and disadvantages of TRIMA Indicator?


The TRIMA indicator is another type of indicator that can be used for technical analysis. The TRIMA indicator (TRIANGULAR MOVING AVERAGE) is actually a smoothed version of the simple moving average, it measures the average of prices by placing weight on the middle prices of the time period to get smooth and clear trading signal from the market. One of the limitations of the SMA however is that it reacts to price fluctuations and it is noisy but the TRIMA indicator helps to correct that by filtering noise and reacting less to the price fluctuations in the market using a double-smoothed SMA that has been averaged twice.
However, the TRIMA doesn't react quickly in a volatile market and it reacts more slowly to price fluctuations than other types of moving average that we have.
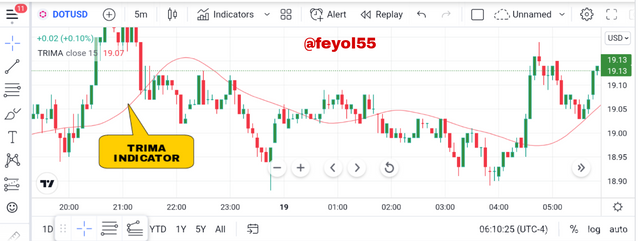
We can use the indicator to generate trade signals on the trading chart. More on this will be discussed subsequently in the course of this post.


In this section, I will be using the https://tradingview.com platform to set up the TRIMA indicator on a chart.
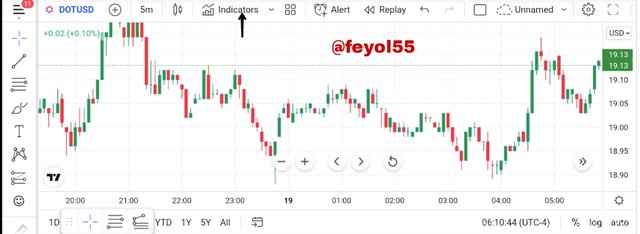
1st step : I'm going to click on the indicator icon located at the top of the trading interface as seen below
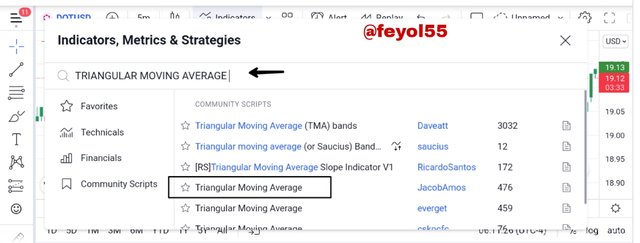
Step 2 : On the search box below, type 'Triangular Moving Average' and select the indicator from the list of option given out.
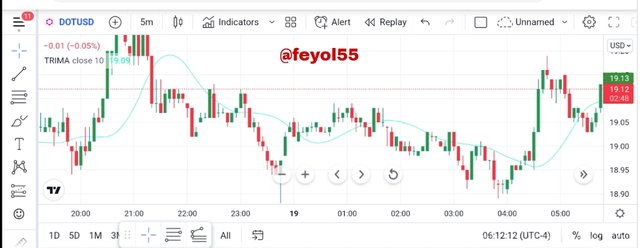
Step 3 : Now, we have the indicator on the chart as seen below.
Furthermore, let's see how the calculation for this TRIMA indicator is being done.
As I mentioned earlier, this TRIMA indicator can be calculated using the SMA of a given asset over a period of time. We then proceed to average these SMAs to determine TRIMA value.
Firstly, we are going to calculate the Simple Moving Average (SMA).
SMA = (P1 + P2 + P3 + P4... + PN)/N
Where P= price of the asset
PN = the total number of periods
P1-p4 = prices of the asset over 4 periods.
next, we are going to take the average of all the SMA to get the TRIMA value.
TRIMA = (SMA1 + SMA2 + SMA3 + SMA4...SMAN) /N
Using this formula above, we can get the value for our TRIMA indicator.


In this section, I will be showing us how we can use the TRIMA indicator to identify both uptrend and downtrend.
UPTREND
During an uptrend, prices move upward forming higher high and higher low. To identify this uptrend using the TRIMA indicator, our focus will be on where the price crosses above the indicator. Once price goes upward, we can confirm an uptrend.
Let's take a look at the chart below
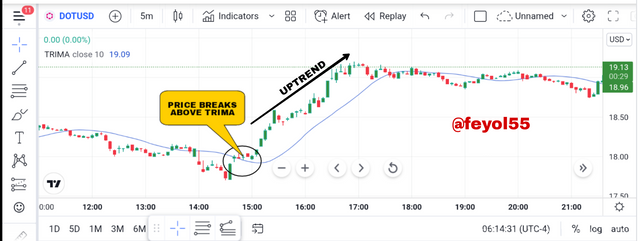
From the DOT/USD chart above, we can observe that price crossed over the TRIMA indicator which means that there is a potential change in trend from bearish to bullish. However, we should note that the TRIMA indicator can also serve as a dynamic support level when the price is moving uptrend.
DOWNTREND
During a downtrend, prices move downward forming higher high and higher low. To identify the downtrend using the TRIMA indicator, our focus will be on where the price cuts below the indicator line. Once price breaks down below this line, then we can continue a downtrend.
Let's take a look at the chart below.
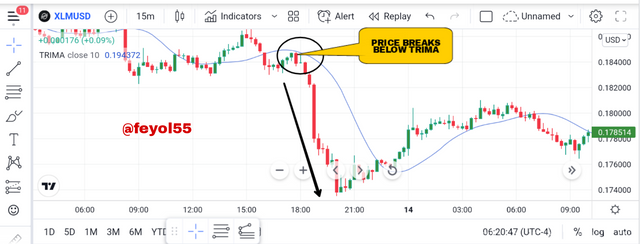
Looking at the XLM/USD chart above, we can observe that price broke below the TRIMA indicator which means that is a potential change in trend from bullish to bearish which we can see on the chart above. However, we should also note that the TRIMA indicator can also serve as a dynamic resistance when the price is moving downtrend.


Support and Resistance are two key zones that most traders watch out for on the price chart. We can use this areas to take key trading decisions like entry and exit points. We can also use the TRIMA indicator to idnetify this zones.
DYNAMIC SUPPORT
This can be observed when the market is moving uptrend. Using the TRIMA indicator, when price moves up and retraces, it forms a dynamic support on the indicator which we can see below
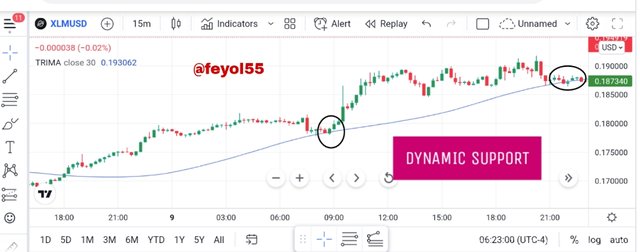
As we can see on the XLM/USD chart above, we can observe the key points where price retraced to touch the TRIMA indicator and later reversed to continue in the original direction. The TRIMA line rejected the price and served as a dynamic support.
DYNAMIC RESISTANCE
This can be observed when the market is moving downtrend using the TRIMA indicator when the price move down and retraces, it forms a dynamic resistance on the indicator which can be seen below.
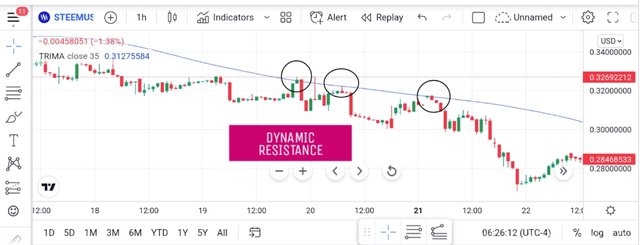
As we can see on the STEEM/USD chart above, we can see the key points where price retraced to touch the TRIMA indicator and later reversed to continue in the original direction. The TRIMA line rejected the price at this zone which served as a dynamic resistance.
CONSOLIDATING MARKET
When the market is consolidating or ranging, it usually have no specific direction. Price moves in between the support and resistance level. This scenerio in the market translates to an equilibrium of demand and supply and low volatility in the market. In this case, the TRIMA indicator moves across the price.
Let's see the image below which illustrates this.
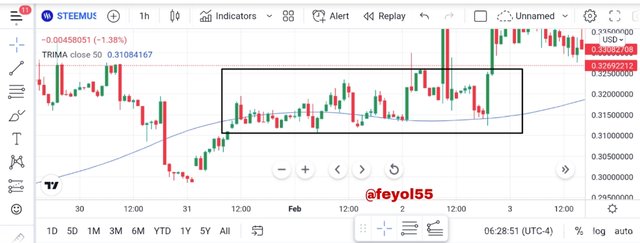
From the chart above, we can see how the TRIMA indicator moved during a consolidating market. The TRIMA indicator was seen floating across the price as price fluctuates within the range.


In this section, I will be using two different period TRIMA to identify BUY and SELL entries with the aid of the TRIMAs crossover. I will be using period 15 and 30 to identify the entry points.
BUY POSITION
When the smaller period TRIMA crosses over the longer period TRIMA, this signifies a potential uptrend and we can place a 'BUY ENTRY' in this direction using proper risk to reward ratio.
Let's take a look at the chart below
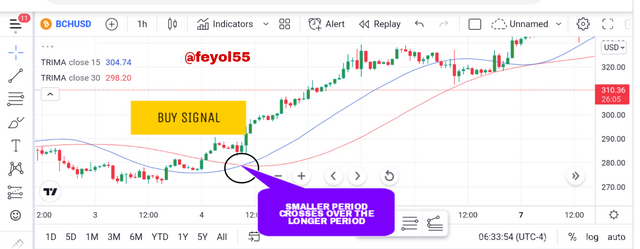
From the BCH/USD chart above on the 1hr time frame, I used the combination or two TRIMA with period 15 (short period) and 50 (longer period). The shorter period (15)TRIMA crosses over the longer period TRIMA (50) and the uptrend began from the crossover point. We can place a BUY ENTRY here.
SELL POSITION
In contrast to the BUY ENTRY, in this scenario, the longer period TRIMA crosses below the shorter period TRIMA, this signifies a potential downtrend and we can place SELL ENTRY in this direction using proper risk to reward ratio. Let's take a look at the chart below.
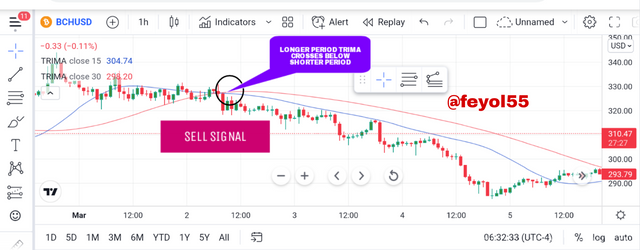
From the BCH/USD chart above on the 1hr time frame, i used the combination of two TRIMAS with period 15 (short TRIMA) and 30 (longer TRIMA). The longer period (30) crosses below the shorter period (15) and the downtrend began from the crossover point. We can place a SELL ENTRY here.


The TRIMA indicator can be combined with other technical indicators like the RSI, to confirm trend reversals which I will be explaining in this section.
CONDITIONS FOR TRADING BULLISH REVERSAL USING TRIMA
First step to take here is to add different period TRIMA indicator on the chart (one short period and the other longer period). Also we are to add RSI indicator to the chart.
The RSI must be at the oversold region during a downtrend, this signifies a potential bullish reversal signal.
Now, we will wait for the short period TRIMA to cross above the longer period TRIMA which also confirms a trend reversal Signal.
A BUY trade can be executed after step 1-3 has been confirmed and formation of at least a two candlestick formation.
The stop loss can be placed below the dynamic support and the take profit should be placed at strategic position above the entry point. The risk to reward ratio of 1:2 can be used.
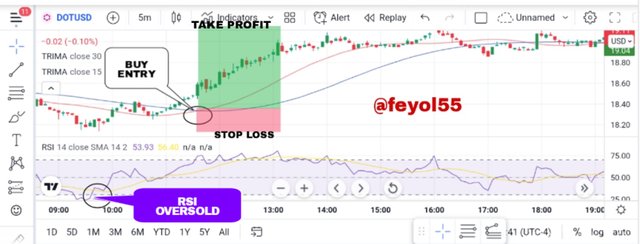
Looking at the DOT/USD chart above, we can see that RSI is at the oversold region which signals a trend reversal, also we can see where the shorter period (15)TRIMA crossed over the longer period (30)TRIMA and I indicated the entry position after the formation of two candlesticks.
CONDITIONS FOR TRADING BEARISH REVERSALS USING TRIMA.
The first step to take here is to add different period TRIMA indicator on the chart (one short period and the other longer period). Also, we are to add the RSI to the indicator.
The RSI must be at the overbought region during an uptrend, this signifies a potential bearish reversal signal.
Now, we will wait for the short TRIMA (15) period to cross below the longer period (30)TRIMA which also confirms a TREND reversal signal.
A SELL trade can be executed after step 1-3 has been confirmed and formation of at least two candlestick.
The stoploss can be placed above the dynamic resistance at the top of the crossover and the take profit should be placed at strategic position below the entry point. The risk to reward ratio of 1:2 can be used.
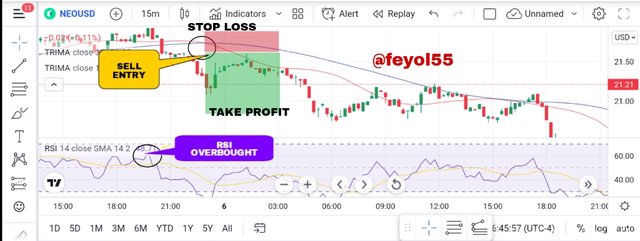
Looking at the NEO/USD chart above, we can see that the RSI is at the overbought region which signals a trend reversal. Also we can see where the longer period (30) crossed over the shorter period and I placed a SELL ENTRY position after the formation of the crossover. We can see how price further moved in downtrend direction from there indicating a bearish reversal.


REAL TRADE (BULLISH REVERSAL)
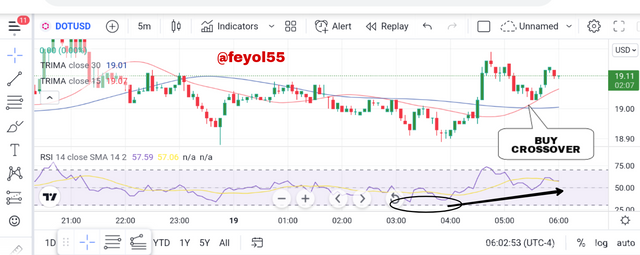
As you can see on the DOT/USD chart above, I observed that the short period (15(TRIMA crossed above the longer period (30)TRIMA and I noticed that the price was in the oversold region of the RSI which further confirms a possible bullish reversal. I waited for some candles to form above the crossover before entering a 'BUY TRADE'. I used a risk to profit ratio of 1:2
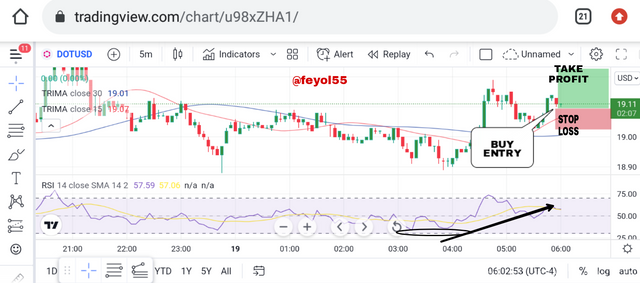
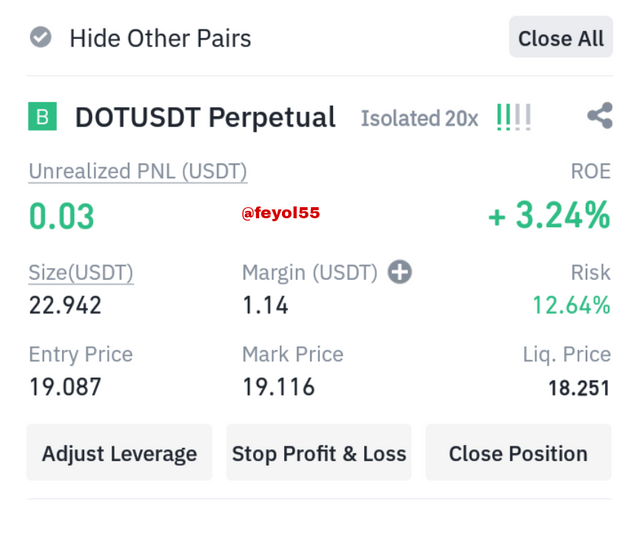
This is the proof of the trade taken on my binance account below.
DEMO TRADE (BEARISH REVERSAL)
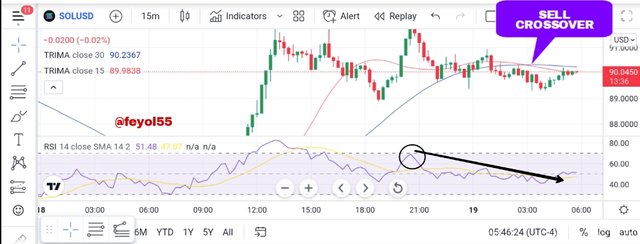
Looking at the SOL/USD chart above, I observe that the shorter period (15) TRIMA crossed below the longer period (30) TRIMA. Also, the RSI indicator was at the overbought level which further confirms a potential bearish reversal. I placed a SELL TRADE after waiting for some candles to form. I used a risk to reward ratio of 1:2
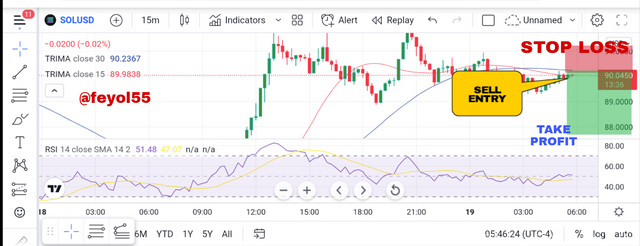
This is the proof of the trade taken on my demo acct.


ADVANTAGES
The TRIMA indicator is more accurate than the SMA indicator in terms of signals generated.
The TRIMA indicator also smoothen out price fluctuations in the market and it's not noisy compared to the SMA.
Using the TRIMA indicator, a trader can identify trends and reversals on the chart.
We can use the TRIMA indicator to identify BUY or SELL entries and execute trade using the crossover system.
We can develop a trading strategy using the TRIMA indicator and another indicator like the RSI or MACD for better result.
DISADVANTAGES
The TRIMA indicator lags behind the market price and they can confuse a trader in taking a trading decision especially after price has already moved.
The indicator doesn't work well in a volatile market.
This indicator can give a false signal unless used with other indicators like the RSI, MACD, stochastic oscillator for signal confirmation.


The importance of trading with indicators cannot be overemphasized, in this study I was able to discuss extensively on the TRIMA indicator which is a trend - base indicator and smoothened version of the SMA. I was able to illustrate how we can use this indicator to identify trends, reversals and entry points. The indicator helps to eliminate market fluctuations and noise and we are able to get clearer signals. I demonstrated how we can combine this indicator with the RSI indicator to filter out false signals.
Also, i placed a demo and live trade using signals generated by this indicator. It was an interesting study and I want to appreciate professor @fredquantum for this awesome lecture.