Good day steemians, trust we are all doing pretty good, it's been a great week here and today, I will be posting my assignment on the topic 'CRYPTO TRADING USING TRIX INDICATOR' taught by professor @kouba01
.jpg)
IMAGE DESIGNED ON POSTERMYWALL.COM
Discuss in your own words Trix as a trading indicator and how it works
Show how one can calculate the value of this indicator by giving a graphically justified example? how to configure it and is it advisable to change its default setting? (Screenshot required)
Based on the use of the Trix indicator, how can one predict whether the trend will be bullish or bearish and determine the buy/sell points in the short term and show its limits in the medium and long term. (screenshot required)
By comparing the Trix indicator with the MACD indicator, show the usefulness of pairing it with the EMA indicator by highlighting the different signals of this combination. (screenshot required)
Interpret how the combination of zero line cutoff and divergences makes Trix operationally very strong.(screenshot required)
Is it necessary to pair another indicator for this indicator to work better as a filter and help eliminate false signals? Give an example (indicator) to support your answer. (screenshot required)
List the pros and cons of the Trix indicator
Conclusion


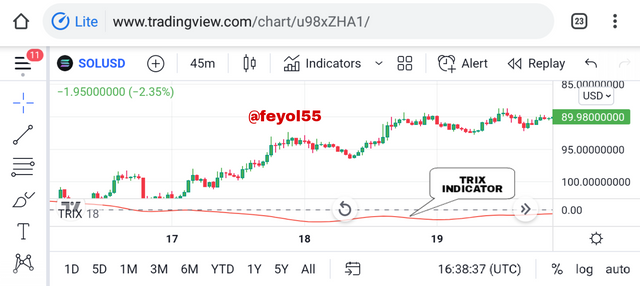
The importance of using an indicator to aid trading decisions cannot be overemphasized. This helps traders to use past price to analyze what will possibly happen to the trading asset in the nearest future. The TRIX indicator also known as the Triple Exponential Average is another unique indicator that traders can use to make profit while trading. Now, what this indicator does is that it helps a trader to figure out the overbought and oversold market zones. It also functions as a momentum indicator and it filters out price movements which are not significant. When the TRIX indicator is reading a positive value, it means the momentum is increasing and when the indicator is reading negative, it means the momentum is also decreasing, also this indicator can be used to identify BUY and SELL entry points, more on this will be discussed in the subsequent sections. This indicator was developed by Jack Hutson and it has been used over the years by many technical analysts, some have even likened it to the MACD indicator in terms of functionality and precision.


Most indicators have a unique mathematical calculation with which it operates. The TRIX indicator likewise isn't different, it has an adopted mathematical model for it calculation. It is to be noted that TRIX indicator uses triple EMA for its calculation.
To start with, the formula for Exponential Moving Average of a price is derived from the expression below :
EMA1 (r) = EMA (Price, N, 1)
Where :
Price (r) = Current Price
EMA1 (r) = The current value of the EMA.
Now, let's use the double EMA to smoothing the average obtained from the first expression.
EMA2(r) = EMA (EMA1, N, r)
We are now going to smoothen the double EMA once more to get the Triple EMA.
EMA3 (r) = EMA (EMA2, N, r)
Now, the formula derived from the 3 expressions above will give us :
TRIX (r) = EMA3(r) - EMA3 (r-1)/ EMA3 (r-1)
Having understood the calculation, I will proceed to show how to configure this indicator.
To do this, click on the settings icon as indicated on the indicator window below.
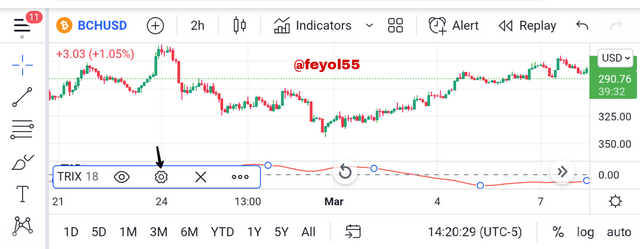
The configuration setting which are the inputs, style and visibility will pop up as seen below.
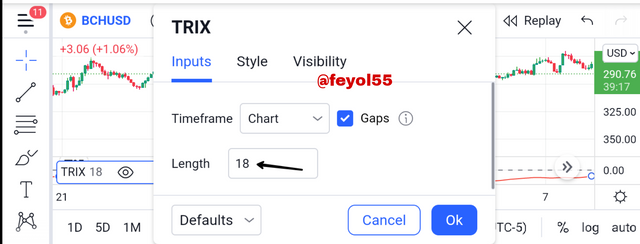
The inputs which is also the period and one of the most important feature can be edited depending on the trader's choice and strategy.
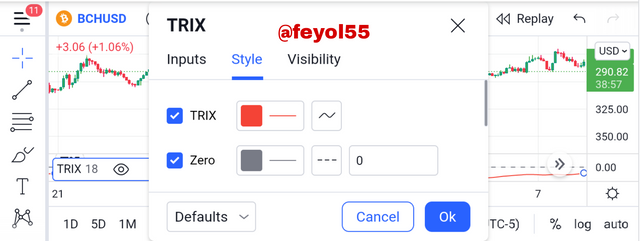
The style and visibility can be left at default settings because they do not really have much effect as the input/period.
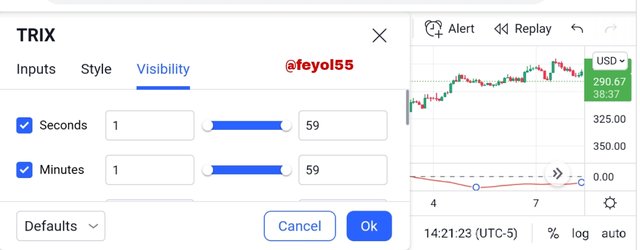
IS IT ADVISABLE TO CHANGE THE DEFAULT SETTINGS ?
It is advisable to change only the input which is also synonymous to the period. The period has the most significant effect of the three settings, scalpers can opt to trade with a shorter period while swing traders can opt to use longer period. But I think the remaining two settings which are style and visibility shouldn't be changed but rather left at the default settings.


As have discussed earlier, one usefulness of the TRIX indicator is that it helps to predict or identify trend which could be bearish or bullish, as a result of that a trader can pick a profitable and good entry (BUY or SELL).
BULLISH TREND
When the TRIX indicator is oscillating above the zero point mark and its reading a positive value, then it's a signal of trend change from bearish to bullish and at this point, a trader can place a BUY ENTRY.
Let's take a look at the chart below for further demonstration of it.
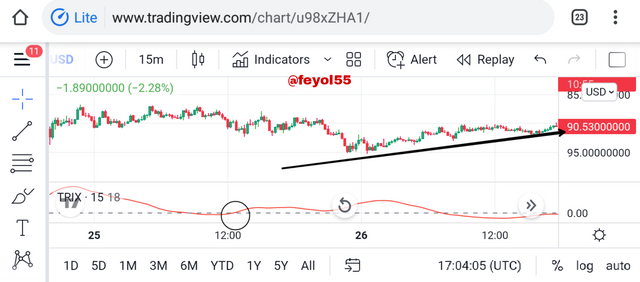
From the chart above, we observe the point where TRIX indicator crossed above the 50 point mark and we could see how the price trend swiftly changed from the bearish to bullish. This is how to identify a bullish trend and buy entry using the indicator.
BEARISH TREND
In contrast to the bullish trend, in this case, when the TRIX indicator is oscillating below the zero point line and it's reading a negative value, then it's a signal of trend change from bullish to bearish and at this point a trader can place a SELL ENTRY. Let's take a look at the chart below which further demonstrates this.
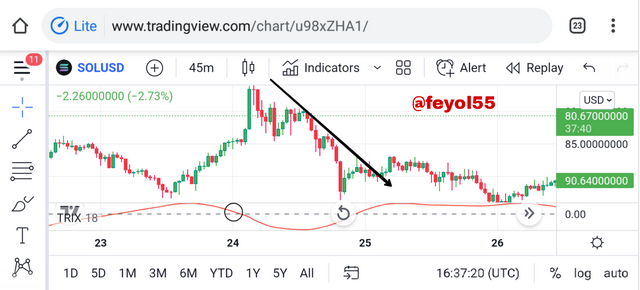
From the chart above, we observe the point where the TRIX indicator crossed below the '50 point line' and we could see how the price trend changed swiftly from bullish to bearish. This is how to identify a bearish trend and a sell entry using this indicator.
Now let's take a look at the limitations of this indicator.
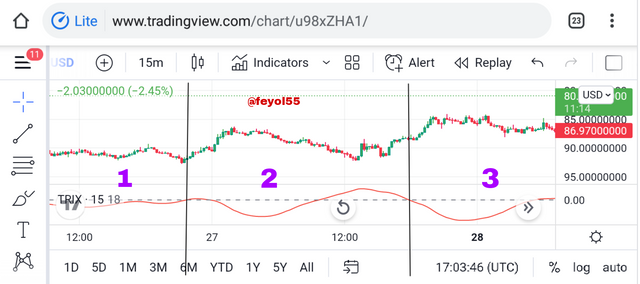
Let's take a look at the chart above, on this chart, we can observe that the TRIX indicator is not always 100% efficient. The chart above is divided into 3 parts. In the first part, we could see the TRIX indicator floating on the zero line and also when we look at the chart, it seems the price trend has no particular direction yet, this seems to validate the TRIX reading but let's move to the part 2 segment on the chart where we can see that price is going up but the TRIX indicator is below the zero line, this means the TRIX indicates is inefficient at this point, on the 3rd part, we can see how price went uptrend again but on the TRIX indicator, price is oscillating below zero point, this further ascertain the fact that sometimes, the TRIX indicator could be limited in efficiency so I think traders need to take note of this.


The MACD and TRIX indicator work similarly since they both read price momentum. However we can get a more accurate result when we combine this two together. To filter signal and get a similar line signal as the MACD, let's use a 9-period EMA for the TRIX indicator.
Now, when this TRIX indicator crossed above the moving average. We can take a 'BUY ENTRY', but when TRIX crosses below the moving average, we can take a 'SELL ENTRY'.
Let's take a look at the image above to compare the signal gotten on the TRIX indicator with the MACD.
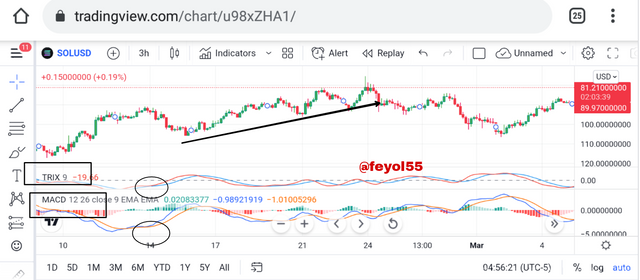
I used a 9-period M.A signal line with a 18-period TRIX while the MACD has a default periods of (12, 26, 9).
As we can see on the chart above, both indicators have now look similar and they are both oscillating above and below the zero line which gives us the signal to BUY or SELL.
Also, as observed on the indicators, the TRIX indicator have a smoother line signal and it filtered the market noise while the MACD signal line is noisy and gives some unnecessary price fluctuations.


The Zero line cut off is an important area of placing our entry using the TRIX indicator. When the TRIX oscillated above this zero line, we know specifically that is a BUY SIGNAL and when it is below the zero line, we know that is a SELL SIGNAL. Now, to further ensure that this signals are strong and valid, we can watch out for divergences on the chart. This divergences further strengthen the signal we get from the TRIX indicator.
Let's take a look at the SOL/USD chart below.
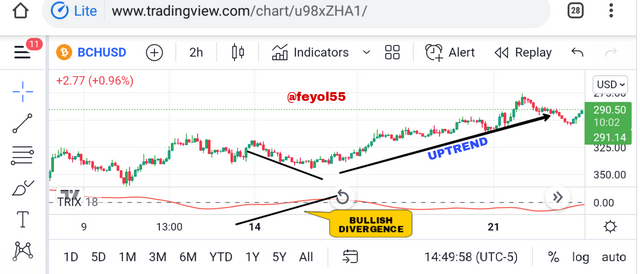
We can see a bullish divergence on the TRIX indicator which was followed subsequently by an uptrend. The divergence signals a weakness in the downtrend and it means price will potentially reverse as seen on the chart. The TRIX indicator crosses the point zero and we saw an uptrend.


No strategy or indicator is always 100% correct or effective. As a result of that, I think it's best to pair this TRIX Indicator with another indicator in other to get a more accurate result. Also, false signal can be filtered out from the TRIX indicator by using another indicator with it.
In this section, I will be combining the TRIX indicator with the stochastic Indicator to filter out false signals from the TRIX indicator.
let's take a look at the chart below which illustrates this
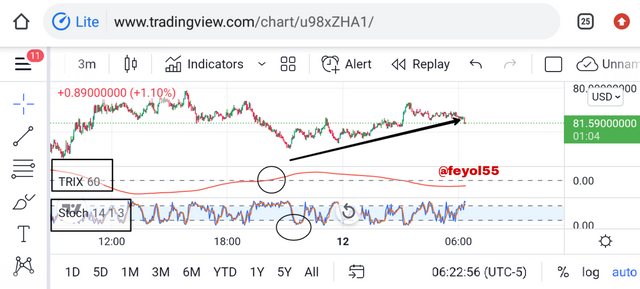
As seen on the DOGE/USD chart above, have added the stochastic oscillator to the chart and I was able to detect a BUY SIGNAL combining the TRIX and STOCH together. Price went uptrend as indicated on the chart. I observed that the TRIX crossed the zero point and the Stoch was oscillating at the oversold region which both validates an uptrend entry.


Now, let's look at the advantages and disadvantages of using this indicator.
PROS
I think the first major advantage of using this indicator is that it filters out market noise and price fluctuations.
We can use the indicator to identify the price trend i.e the direction of price movement which could be Bearish/Bullish.
The TRIX line helps trader to discover BUY and SELL entry points using the indicator.
Using this TRIX Indicator, a trader can trade divergences in the market chart. Using this divergences, one can ascertain the next possible price trend.
When we use this indicator in combination with indicators, we can increase our trading efficiency and make better trading decisions, this ensures that we get a stronger signal from the indicator.
CONS
The indicator can produce False signals especially in situations where the market is not in an impulse trend move.
The indicator has a lagging effect, it sometimes lag behind price which could compromise trading decisions.
The indicator is inefficient when used alone, one might not get a perfect signal using the TRIX indicator alone, therefore it's important we combine it with another indicator to increase its efficiency.


TRIX indicator is another useful technical indicator that can be used to aid trading decisions. It can be used to determine trends, divergence and as well as BUY and SELL entries. One major reason why traders find this indicators beneficial is that it is simple to use and it filters out market noise and price fluctuations. I learnt a great deal from
this study as have been able to understood the technique behind using the TRIX indicator to make profitable trading.
Special thanks to prof. @kouba01 for this wonderful and educative study.