Good Evening Everyone, trust we all had a great weekend, I will be posting my assignment on the topic 'Ultimate Oscillator Indicator' as taught by professor @utsavsaxena11
~2.jpg)
IMAGE DESIGNED ON POSTERMYWALL.COM
QUESTION 1:
What do you understand by ultimate oscillator indicator. How to calculate ultimate oscillator value for a particular candle or time frame. Give real example using chart pattern, show complete calculation with accurate result.
QUESTION 2 :
How to identify trends in the market using ultimate oscillator. What is the difference between ultimate oscillator and slow stochastic oscillator.
QUESTION 3:
How to identify divergence in the market using ultimate oscillator, if we are unable to identify divergence easily than which indicator will help us to identify divergence in the market.
QUESTION 4:
what is the 3 step- approach method through which one can take entry and exit from the market. Show real example of entry and exit from the market.
QUESTION 5:
What is your opinion about ultimate oscillator indicator. Which time frame will you prefer how to use ultimate oscillator and why?
QUESTION 6:
Conclusion


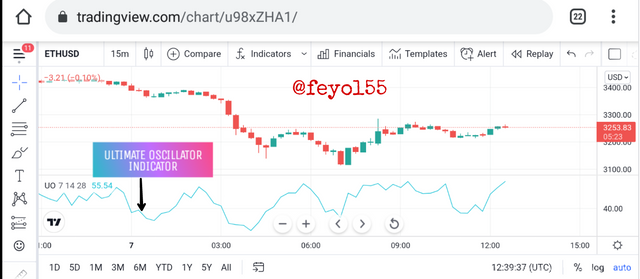
Amongst several indicators used by technical analyst traders to analyze the market is the ultimate oscillator indicator. This indicator was specially deisgnedyby by a man called Larry Williams, what this indicator simply does is that, it takes the measurement of price momentum of an asset/coin using multiple time frames to indicate or predict the trend of the market. This ultimate oscillator indicator generate signals through divergence which could either be bullish divergence or bearish divergence. It is also characterised by the reading scale of 0 to 100, when readings are below 30 level, it means that is an oversold price and when the readings are above 70, then it means the price is overbought. This indicator has been termed to be a reliable one because it produces less false signal compare to some other indicators, not only that, the indicator uses the 7, 14 and 28 periods to calculate its true range of volatility which enables us to get a more reliable signal for either a buy or sell entry.
HOW TO CALCULATE THE ULTIMATE OSCILLATOR
The General formula for calculating this is :
UO = [(A7 X 4) + (A14 X 2) + A28 )] /7 X 100
Where UO is ultimate oscillator and stands for Average.
- A7 is the average for 7 period
- A14 is the average for 14 period
- A28 is the average for 28 period
Now, we are going to calculate for each of this average periods.
A7 = sum of BP for the past 7 days divided by sum of TR for the past 7 days.
A14 = sum of BP for the past 14 days divided by sum of TR for the past 14 days.
A28 = sum of BP for the past 28 days divided by sum of TR for the past 28 days.
Our BP is calculated as :
BP = Current close - Min (current low or previous close)
TR = Max (Current High or Previous close) - Min (Current Low or Previous close)
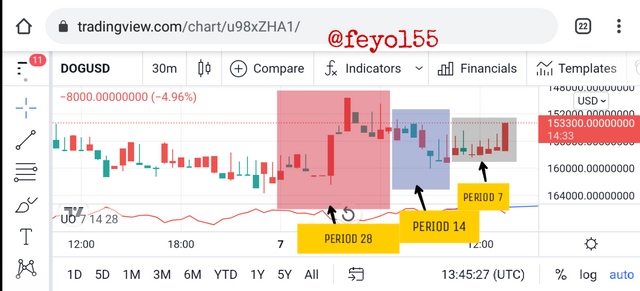
Now, I am going to use the DOG/USD chart to illustrate this calculation.
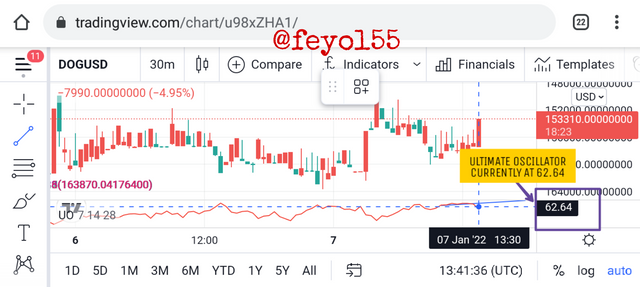
| nPeriod | BP | TR |
|---|---|---|
| 1 | 7.05 | 6.50 |
| 2 | 5.5 | 9.6 |
| 3 | 6.47 | 10.2 |
| 4 | 11.2 | 20.5 |
| 5 | 6.9 | 7.5 |
| 6 | 9.31 | 13.42 |
| 7 | 9.1 | 11.21 |
| 8 | 11.05 | 15.35 |
| 9 | 3.68 | 7.2 |
| 10 | 8.3 | 16.53 |
| 11 | 6.5 | 19.2 |
| 12 | 7.5 | 20.15 |
| 13 | 4.2 | 12.3 |
| 14 | 2.5 | 5.3 |
| 15 | 17.05 | 19.66 |
| 16 | 28.01 | 35.12 |
| 17 | 4.36 | 29.23 |
| 18 | 10.36 | 16.99 |
| 19 | 8.36 | 13.52 |
| 20 | 8.53 | 19.12 |
| 21 | 6.11 | 13.24 |
| 22 | 11.55 | 19.23 |
| 23 | 6.50 | 19.55 |
| 24 | 22.21 | 25.69 |
| 25 | 18.51 | 33.05 |
| 26 | 31.32 | 55.44 |
| 27 | 8.35 | 56.55 |
| 28 | 3.14 | 21.48 |
CALCULATIONS PROPER
- A7 = 55.47/78.93 = 0.702
- A14 = 99.2/174.96 =0.566
- A28 = 283.56/552.83 = 0.512
USING THE FORMULA, WE HAVE...
[(0+70X4)+ (0.57X2)+(0.51)]/7 X 100
= 2.8 + 1.14 + 0.51/7 X 100
= 0.635 X 100 = 63.5

From the image above, I got a value close to the UO reading.


The ultimate oscillator can primarily be used to identify two trends which are the 'Bullish' and 'Bearish' trend. Let's take the bullish trend first.
BULLISH TREND
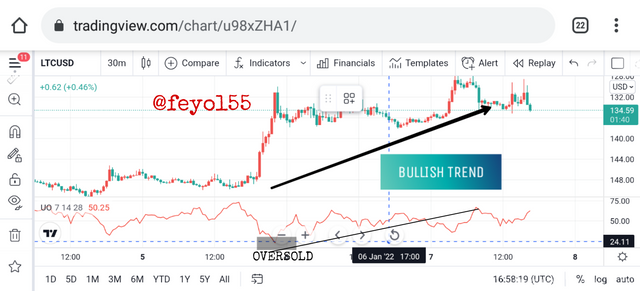
The bullish trend which is also known as the uptrend can be identified on the ultimate oscillator. when the reading on the indicator is below 30, it means the market price has been oversold and the price will shoot up soon meaning it will go in a Bullish/uptrend movement.
BEARISH TREND
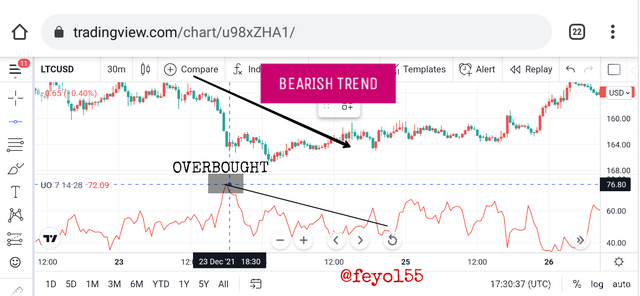
The bearish trend which is also known as the downtrend can be identified on the ultimate oscillator when the reading on the indicator is above 70, this reading simply means that the market price has been overbought and the sellers are prepared to take over the price momentum, meaning price will fall down indicating a bearish/downward trend.
| ULTIMATE OSCILLATOR | STOCHASTIC OSCILLATOR |
|---|---|
| The ultimate oscillator has a single line that is oscillating | The stochastic oscillator has two lines that are oscillating |
| The ultimate indicator calculates it's reading using 3 different periods which are the 7,14 and 28. | The stochastic uses only 2 periods which are 14 and 3 periods. |
| The ultimate indicator uses 30 and 70 level to ascertain the oversold and overbought zones respectively | The stochastic indicator uses 20 and 80 level to ascertain the oversold and overbought level respectively. |
| It generates few signals | It generate more signals. |


BULLISH DIVERGENCE
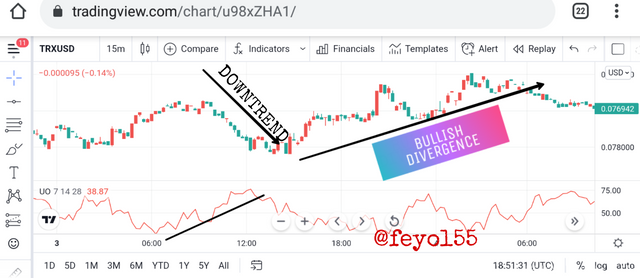
To identify a bullish divergence, we are going to be looking at the price movement on the main chart and the price movement in the Ultimate oscillator indicator. For the main chart, the price will be in a downward/bearish trend while on the indicator which is the U.O, the price will be in bullish direction. Once this two conditions are met, it is an indication there is going to be a Bullish divergence on the main chart immediately after the downward movement of price.
BEARISH DIVERGENCE
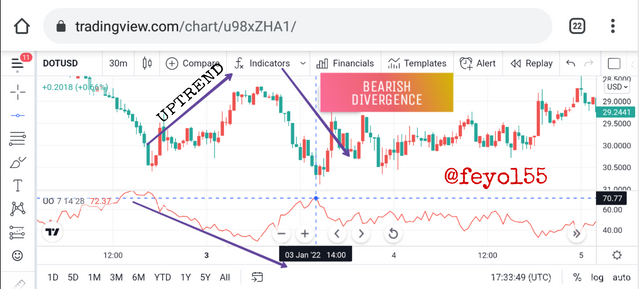
To identify a bearish divergence, we are going to be looking at the price movement on both the main chart and the ultimate oscillator indicator. The price movement on the main chart will be in an uptrend movement while on the indicator, it will be in a downward trend. Once this two conditions happens, then a bearish divergence should be expected to happen next. This scenerio is perfectly illustrated in the screenshot below.
OTHER INDICATOR THAT CAN HELP US IDENTIFY DIVERGENCE
Another indicator which I have used over time and I feel can also do the work of the ultimate oscillator just incase we are unable to identify divergence is the stochastic indicator
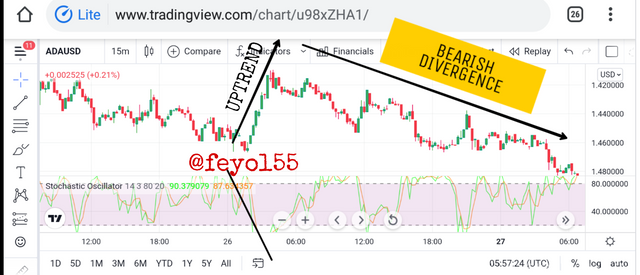
Looking at the image above, we can see that using the stochastic oscillator, we were able to identify a divergence on the ADA/USD chart precisely on the 15mins time frame. This ascertain that the stochastic oscillator can also do this work perfectly.


We can take entry and exit for both BUY and SELL trade, let's take a look at them.
BUY TRADE
The following steps must be strictly adhered to for entry and exit position.
The first thing we should watch out for is that there must be a bullish divergence confirmation whereby the price is making a lower low and the indicator is doing vice versa which is higher high.
Next, we must ensure that the first lower low observed in the divergence is below the 30 level of the ultimate oscillator indicator reading, this means it's at an oversold level. From that oversold level, the divergence will kick start and the price will take an uptrend.
Lastly, the ultimate oscillator must be above the divergence high which is actually the point between the two lows of the divergence.
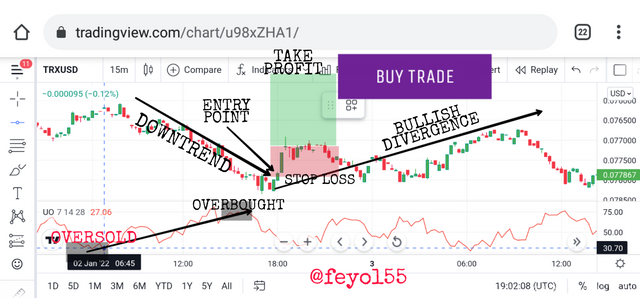
Looking at the TRX/USD chart above precisely on the 15mins time frame. We can see that all the 3 conditions were met and I was able to identify an entry and exit from the market as far as the buy entry is concerned.
SELL TRADE
The following steps below must be strictly adhered to take entry and exit for the sell entry.
The first thing we should watch out for is that there must be a bearish divergence confirmation whereby the market price is making a higher high and the indicator is making lower-lows.
Next, we must also ensure that the first higher high observed in the divergence is above the 70 level of the ultimate oscillator indicator reading, this means that it's at an overbought condition and from that overbought level, the divergence will kickstart with the price taking a downward trend.
Lastly, the ultimate oscillator must be below the divergence low which is the point between the two highs of the divergence.
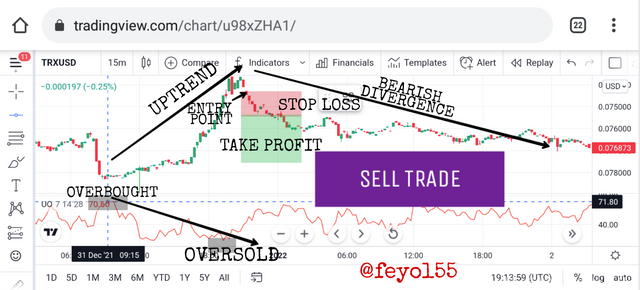
Looking at the TRX/USD chart above, precisely on the 15mins timeframe, we can see that all the 3 conditions were met and I was able to identify an entry and exit from the market as far as the entry is concerned.


My sincere opinion about the ultimate oscillator indicator is that it is a reliable tool to use when using the divergence strategy to identify a perfect entry. It gives accurate signals provided the trader is patient enough to observe all the condition needed to execute the trade. Howbeit, we all know that nothing is 100% guaranteed in trading. I feel it will be better if one combine this indicators with other indicators to form a trading confluence, by so doing better trading decisions will be taken.
This indicator will also favour the swing and scalper traders especially the later because they make use of a shorter time frame to trade and this indicator will generate signal faster in a shorter timeframe like the 15mins time frame which I think is ideal enough compared to trading a larger time frame with this indicator which will give us a slower signal. Overall, if used effectively, this indicator is a top-notch tool for every trader.


Learning never ends as we all know. I must confess this course has really be informative and educative. By the virtue of this homework, have been able to learn how to use this indicator to execute a trade perfectly while observing all the conditions required. Most importantly, I have also learnt how the calculation of this indicator is being carried out using the 7, 14 and 28 period. After studying this course and the indicator, I can now take trades using the bullish and bearish strategy with this indicator.
Special thanks to professor @utsavsaxena11 for this wonderful piece.