

1- Define Fractals in your own words.

Fractals mean continuity in a particular pattern self-similar across different scales. It can be seen as a loop of a particular process over and over. Fractal patterns are familiar, nature examples are trees, rivers, coastline, mountains, clouds, etc. Let's look at fractals in trading and how it has been applied to charts.
Fractals are identified on candlestick charts to get an idea of the direction in which the market will trend or reversal points in the market. On the chart, fractals are made up of five candles where the price struggled to go high creating fractals in the upward direction and lower, in which the fractals are created in the downward direction.
How are Fractals form
Fractals are formed in two ways, either in the up or down. For the up fractal to be formed, two candles to the right with two lower highs and on the left two candles with two further lower highs. While for the down fractal to be formed, two candles to the right with two higher lows and on the left two candles with two further higher lows.
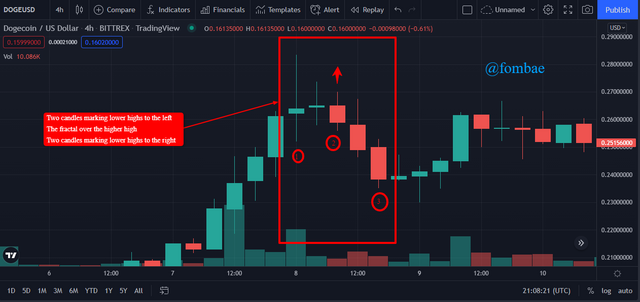 Screenshot TradingView
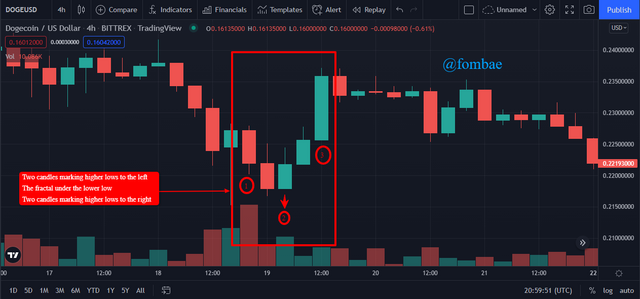 Screenshot TradingView
As mentioned above, fractals are made up of a five candle pattern as the fifth candle must close and complete the fractals. A trader can make any decision only when the fractals are completed be it up or down. As the price moves after the fifth candle, the fractals will either disappear or start forming another fractal.
Fractals can be used to determine market directions and help in stop-loss placement. Fractal is a useful tool for traders in the market.
Stop-loss placement
Stop-loss can be applied with the use of fractals, as it can help a trader decide when to take a position for stop loss. If a trader wants to enter a short market, up fractals are used to place a stop loss. It is cool to use the tip of the actual fractal indicator and not the candle itself.
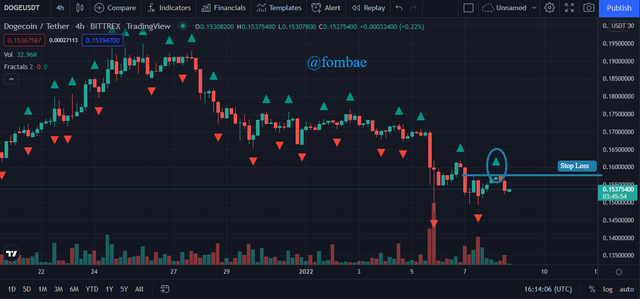 Screenshot TradingView
For a trader in a long position, it is better to place the stop-loss order on the most recent down fractals.
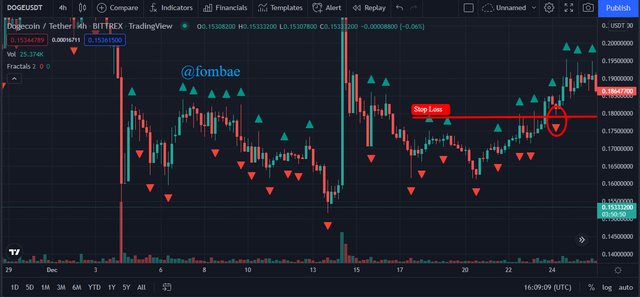 Screenshot TradingView

2- Explain major rules for identifying fractals. (Screenshots required)

Most be Five candles(bars)
As I mentioned above, the fractal pattern on the chart is completed after five candlesticks. So when the number of a candle is less than five, it cant be identified as a fractal. On the image below, I number the bar, for each of the fractals, it is made up of five bars.
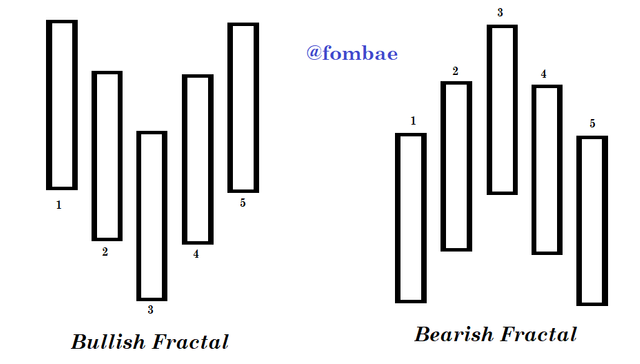
Either Bullish fractal or Bearish Fractal
Every trader wants to be able to identify trends in the market and fractal is one of the tools which can accurately help. Fractals are initiators of a future trend as the end of a fractal can be a formation of a strong market trend(bullish or bearish)
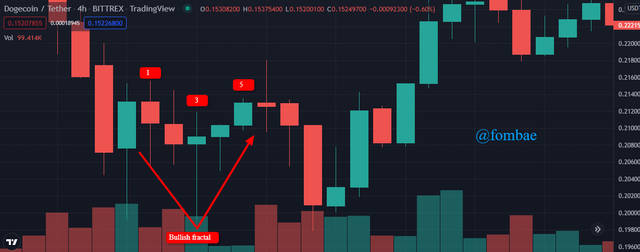 Screenshot TradingView
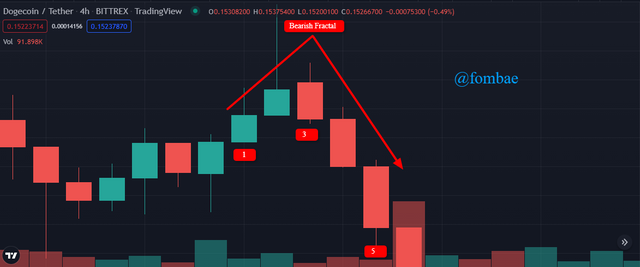 Screenshot TradingView
Middle candle initial a reversal
The middle candle is the reverse point, for a Bullish fractal the candle is the lowest low while the other two at the side are higher lows. From the image above, we can see that a new trend is initiated on the middle candle forming a reversal trend to the current market.
For a Bearish fractal, the candle is the highest high while the other two at the side are lower highs

3- What are the different Indicators that we can use for identifying Fractals easily? (Screenshots required)

I will be using the web platform TradingView to illustrate the different indicators to identify fractals.
Click the fx indicator icon at the top of the chart.
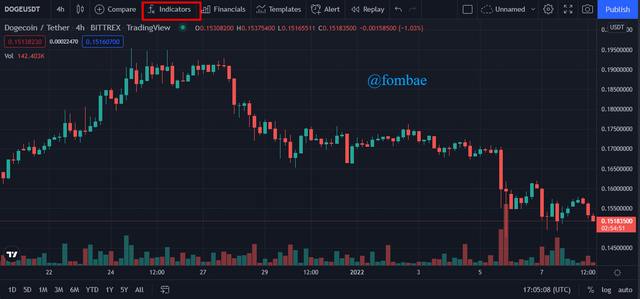 Screenshot TradingView
New window pop on the chart, here I will search the indicators by typing in the search bar 'Williams Fractals"
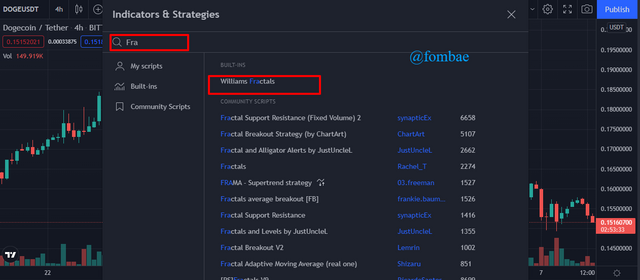 Screenshot TradingView
Click Williams Fractals and click x to close the window.
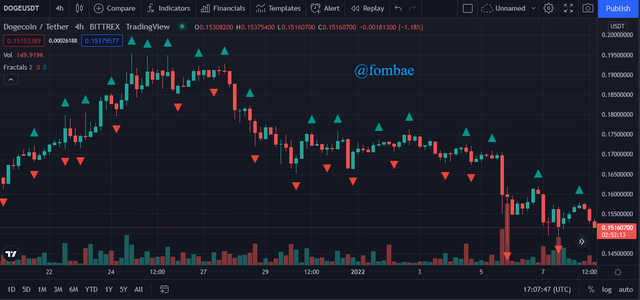 Screenshot TradingView
From the chart above, we can see Red arrows and green arrows which are used to indicate an important point on the chart. The arrow is on the reversal candle which helps to identify the peak or dip of the fractals.
Using the Williams indicator, a trader will identify a bullish fractal with the red arrows which are in the downward direction while bearish fractals can be identified with the green arrow in the upward direction.
Fractal Support and Resistance
With fractals, a trader can easily pick out support and resistance levels to help identify entry and exit points. Fractal can help to connect the different t completed number of a fractal with a horizontal line. A good number of bearish fractals can form a resistance level while the bullish fractals form the support on a chart.
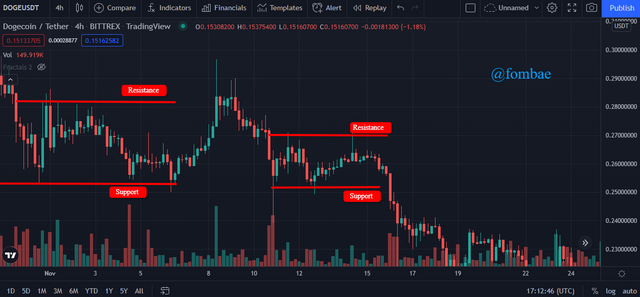 Screenshot TradingView
A trade can use this to anticipate accurate price reversal of breakout in the market.
Fractal Breakout Strategy Indicator
Here is another indicator that can probably be used by a trader to identify breakout points in the market. The indicator is made up of an upper band and down band in which the price candles are found in between.
to accurately spot the breakout point, the bands act as support and resistance levels on the chart. A breakout can be seen when the price candle moves past the band. if the price candle move over the upper band a future bullish trend in the market is anticipated why the lower band, a future bearish trend in the market is anticipated
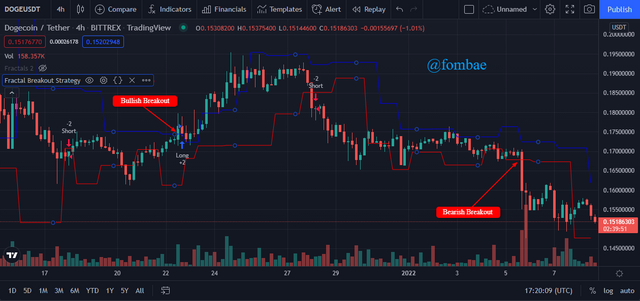 Screenshot TradingView

4- Graphically explore Fractals through charts. (Screenshots required)

I will be exploring Fractals on the DOGEUSD pair, so I will select the tool from the left side of the chart. I will pick a Bars pattern and drag it on the section of the chart I want to apply.
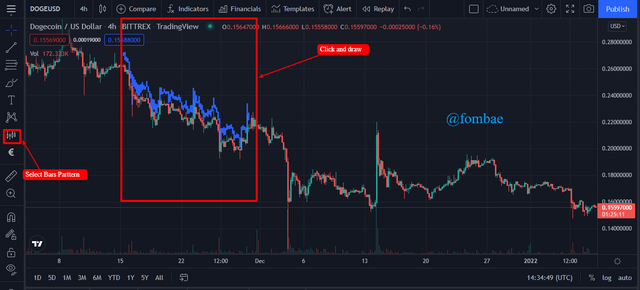 Screenshot TradingView
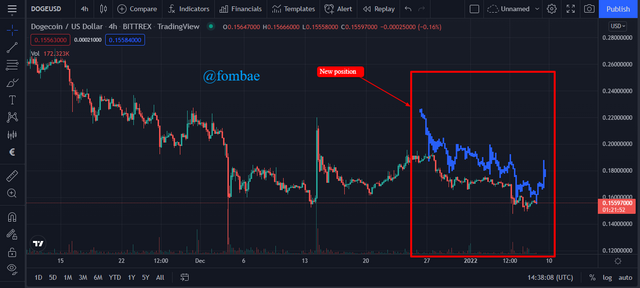 Screenshot TradingView
From the above chart, we can notice I draw my bars pattern in a bearish market. When I move the pattern to the current market trend, we can see a similarity in the pattern. With this, a trade can easily predict the next market trend which is easily stressed in making an accurate decision.

5- Do a better Technical Analysis identifying Fractals and make a real purchase of a coin at a suitable entry point. Then sell that purchased coin before the next resistance line. Here you can use any other suitable indicator to find the correct entry point in addition to the fractal. (Usually, You should demonstrate all the relevant details including entry point, exit point, resistance lines, support lines or any other trading pattern)

Like any other indicator, it is advisable to use more than one indicator during trading. I will be using the William fractals indicator and a moving average indicator to reduce my chance of picking false signals.
Buy order
To set a buy order, I added my indicators to tth chart. the last fractal indicator is a bullish fractal, means the market will move to a bullish trend. I set my order at current market price to take profit.
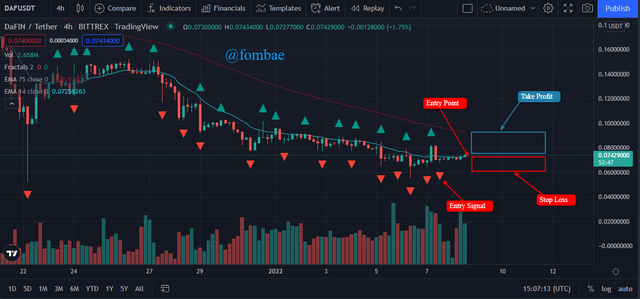 Screenshot TradingView
 Screenshot global bittrex accounr
Sell order
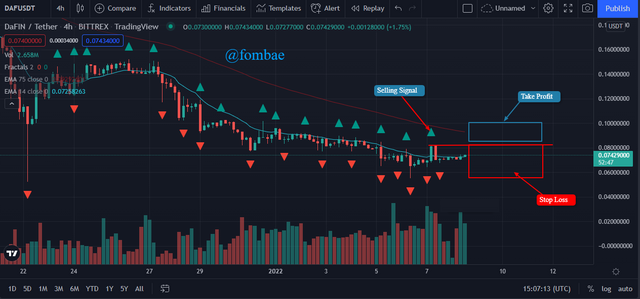
Screenshot TradingView
 Screenshot global bittrex accounr

Conclusion

To Conclude Fractals indicators show potential reversal points in the market and are formed when a particular price action takes place on the chart. As I mentioned above, it is made up of five candlesticks. Fractals can be used to apply to stop lost strategy and a good tool to predict trend directions and price breakout in the market.
cc: @reddileep
https://steemit.com/hive-172186/@faridi1/achievement-4-task-applying-markdown-method-by-faridi1
Please sir verify @fombae
Downvoting a post can decrease pending rewards and make it less visible. Common reasons:
Submit
@faridi1
You have a guide under your post to follow.
Downvoting a post can decrease pending rewards and make it less visible. Common reasons:
Submit
https://steemit.com/hive-172186/@saimrajput/achievement-3-task-content-etiquette-post-by-saimrajput
Verify @fombae sir
Downvoting a post can decrease pending rewards and make it less visible. Common reasons:
Submit
https://steemit.com/hive-172186/@nasirali07/achievement-3-by-nasirali07-or-or-content-etiquette
kindly verify my achievement 3
Downvoting a post can decrease pending rewards and make it less visible. Common reasons:
Submit
https://steemit.com/hive-172186/@saimrajput/achievement-3-task-content-etiquette-post-by-saimrajput
Sir now chak I'm edited this post @fombae
Downvoting a post can decrease pending rewards and make it less visible. Common reasons:
Submit
https://steemit.com/hive-172186/@alis12/achievement-2-task-basic-security-by-alis12.
Verfiy my post plzzz.
Downvoting a post can decrease pending rewards and make it less visible. Common reasons:
Submit